Debugging Live Java Applications with Lightrun
Java is a wonderful, powerful and versatile language/platform. It’s very easy to debug under normal conditions but when it’s deployed in a remote environment this might be more challenging. Especially at scale.
This is true for a simple Java application or for a server application running on tomcat, spring, JavaEE or pretty much anything else out there. We need a way to observe live applications and debug issues without interrupting user flows.
This is where Lightrun steps in to make this process trivial and secure without risking your uptime. Notice that this short tutorial uses a simple prime main calculation app for demonstration purposes. But you can use pretty much any application with Lightrun. The one constraint is that it’s “long running”, so a hello world application will end too quickly and we won’t have time to attach to it.
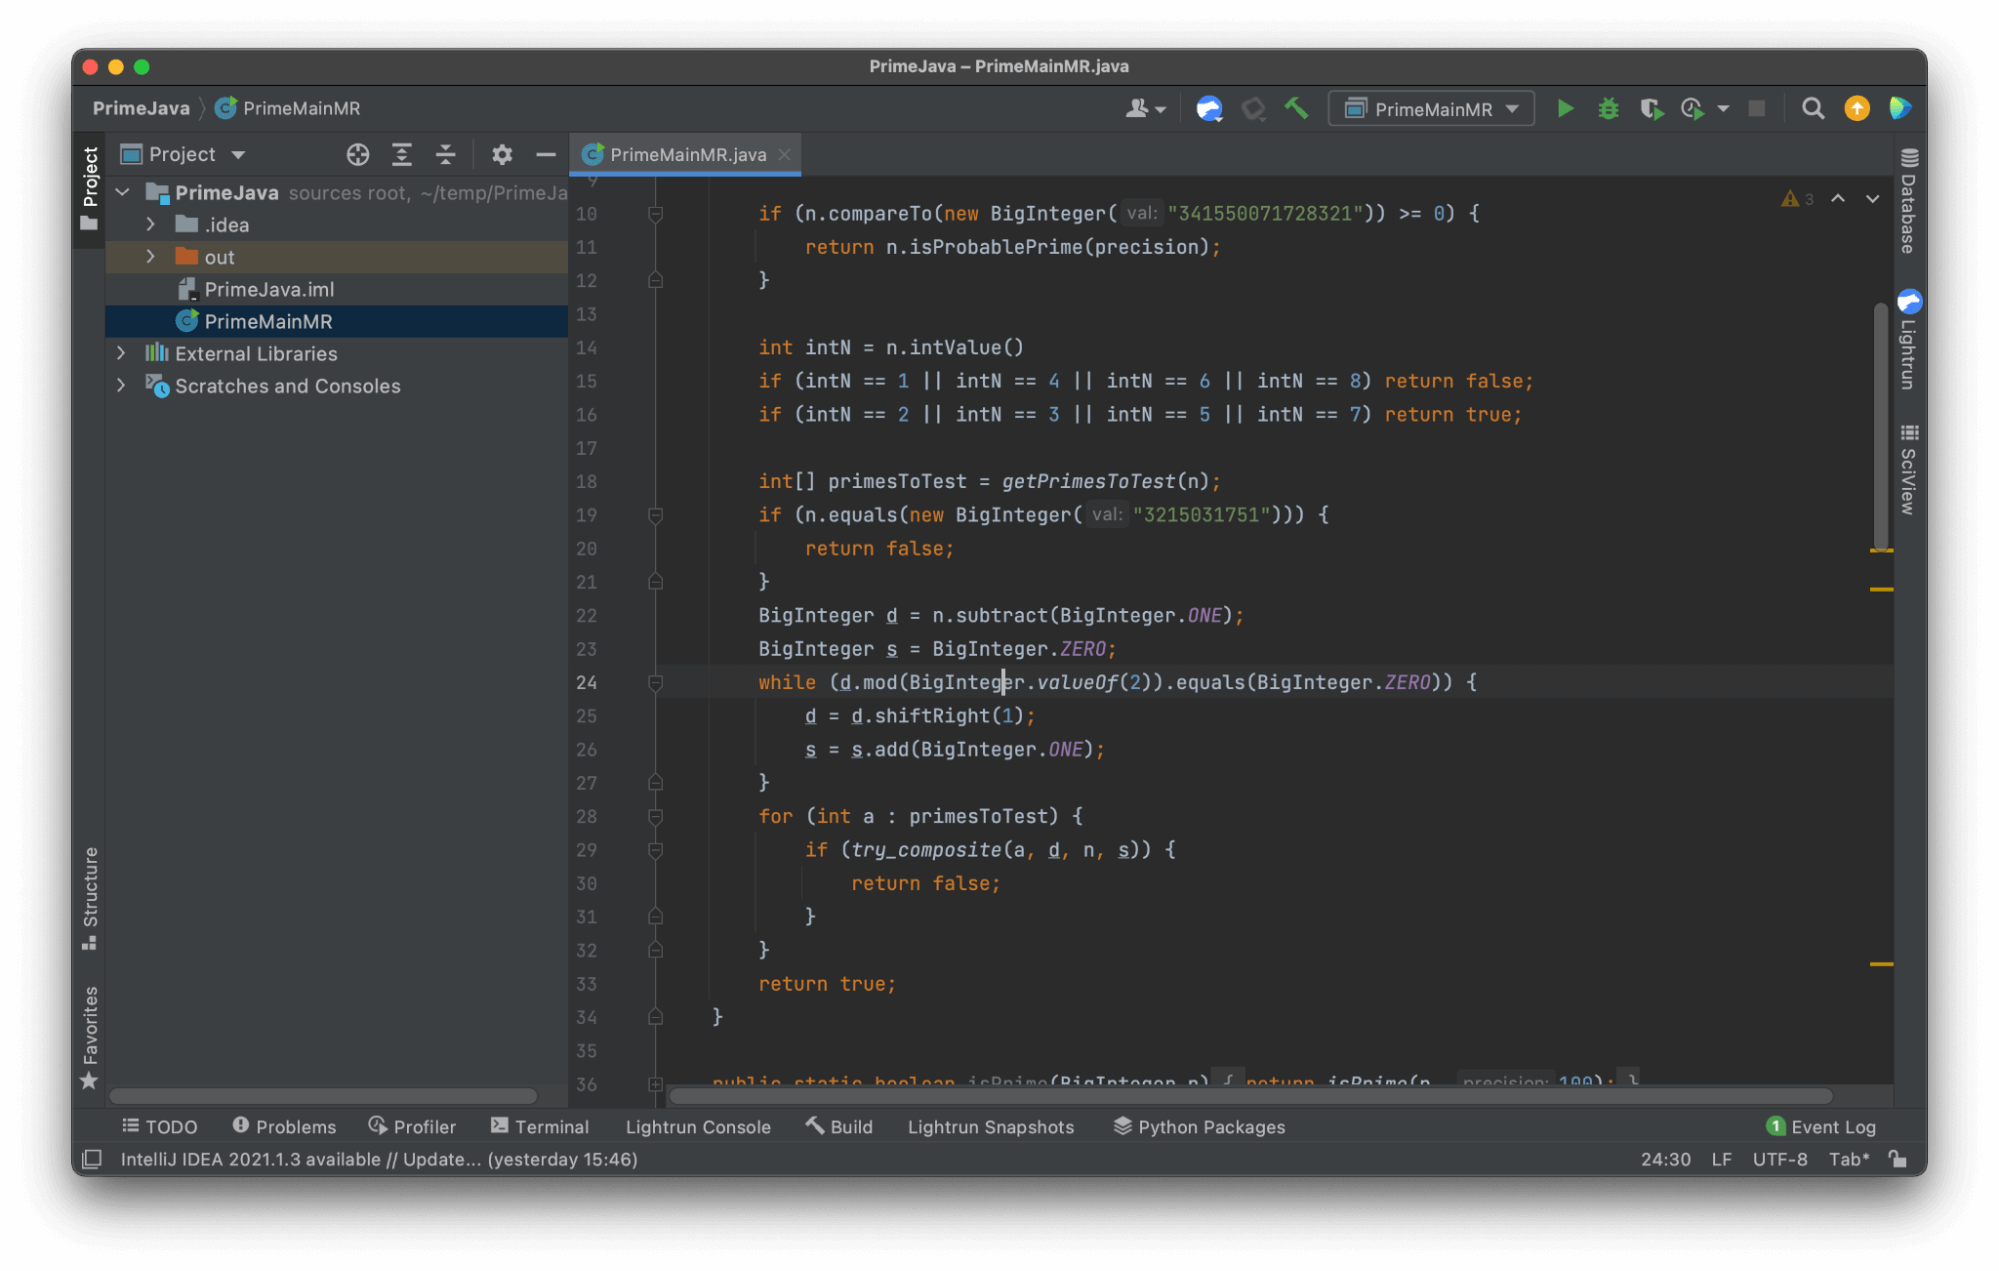
Here is the source code of the prime main application we’ll use in this tutorial.
Step 1 – Build the Test Application
Download the source file, open the directory where it resides and compile the project in IntelliJ.
Step 2 – Install Lightrun & Run Prime Main
If you didn’t do this yet, create a Lightrun account. Download the IDE plugin and set up the agent on your server. I won’t replicate the steps here as they are pretty clear on the website.
You can download the agent into the project directory then run the app using:
java -agentpath:PATH_TO_AGENT_DIRECTORY/lightrun_agent.so -classpath
out/production/PrimeJava PrimeMainMR
Notice you need to replace PATH_TO_AGENT_DIRECTORY with the right path. Try to avoid shortcuts like ~ which might cause issues. Also you might need to fix the classpath to match the name you gave to the project.
Notice that if this works you should see no output, the process will just keep running and calculating.
You can now install the plugin and login via the IDE.
Step 3 – Inject a Log
In the IDE open the PrimeMainMR.java file. Go to line 84 and right click on it. Select Lightrun and Log:

In the Log dialog, enter the following code in the Format field: Prime number {cnt} is {i}
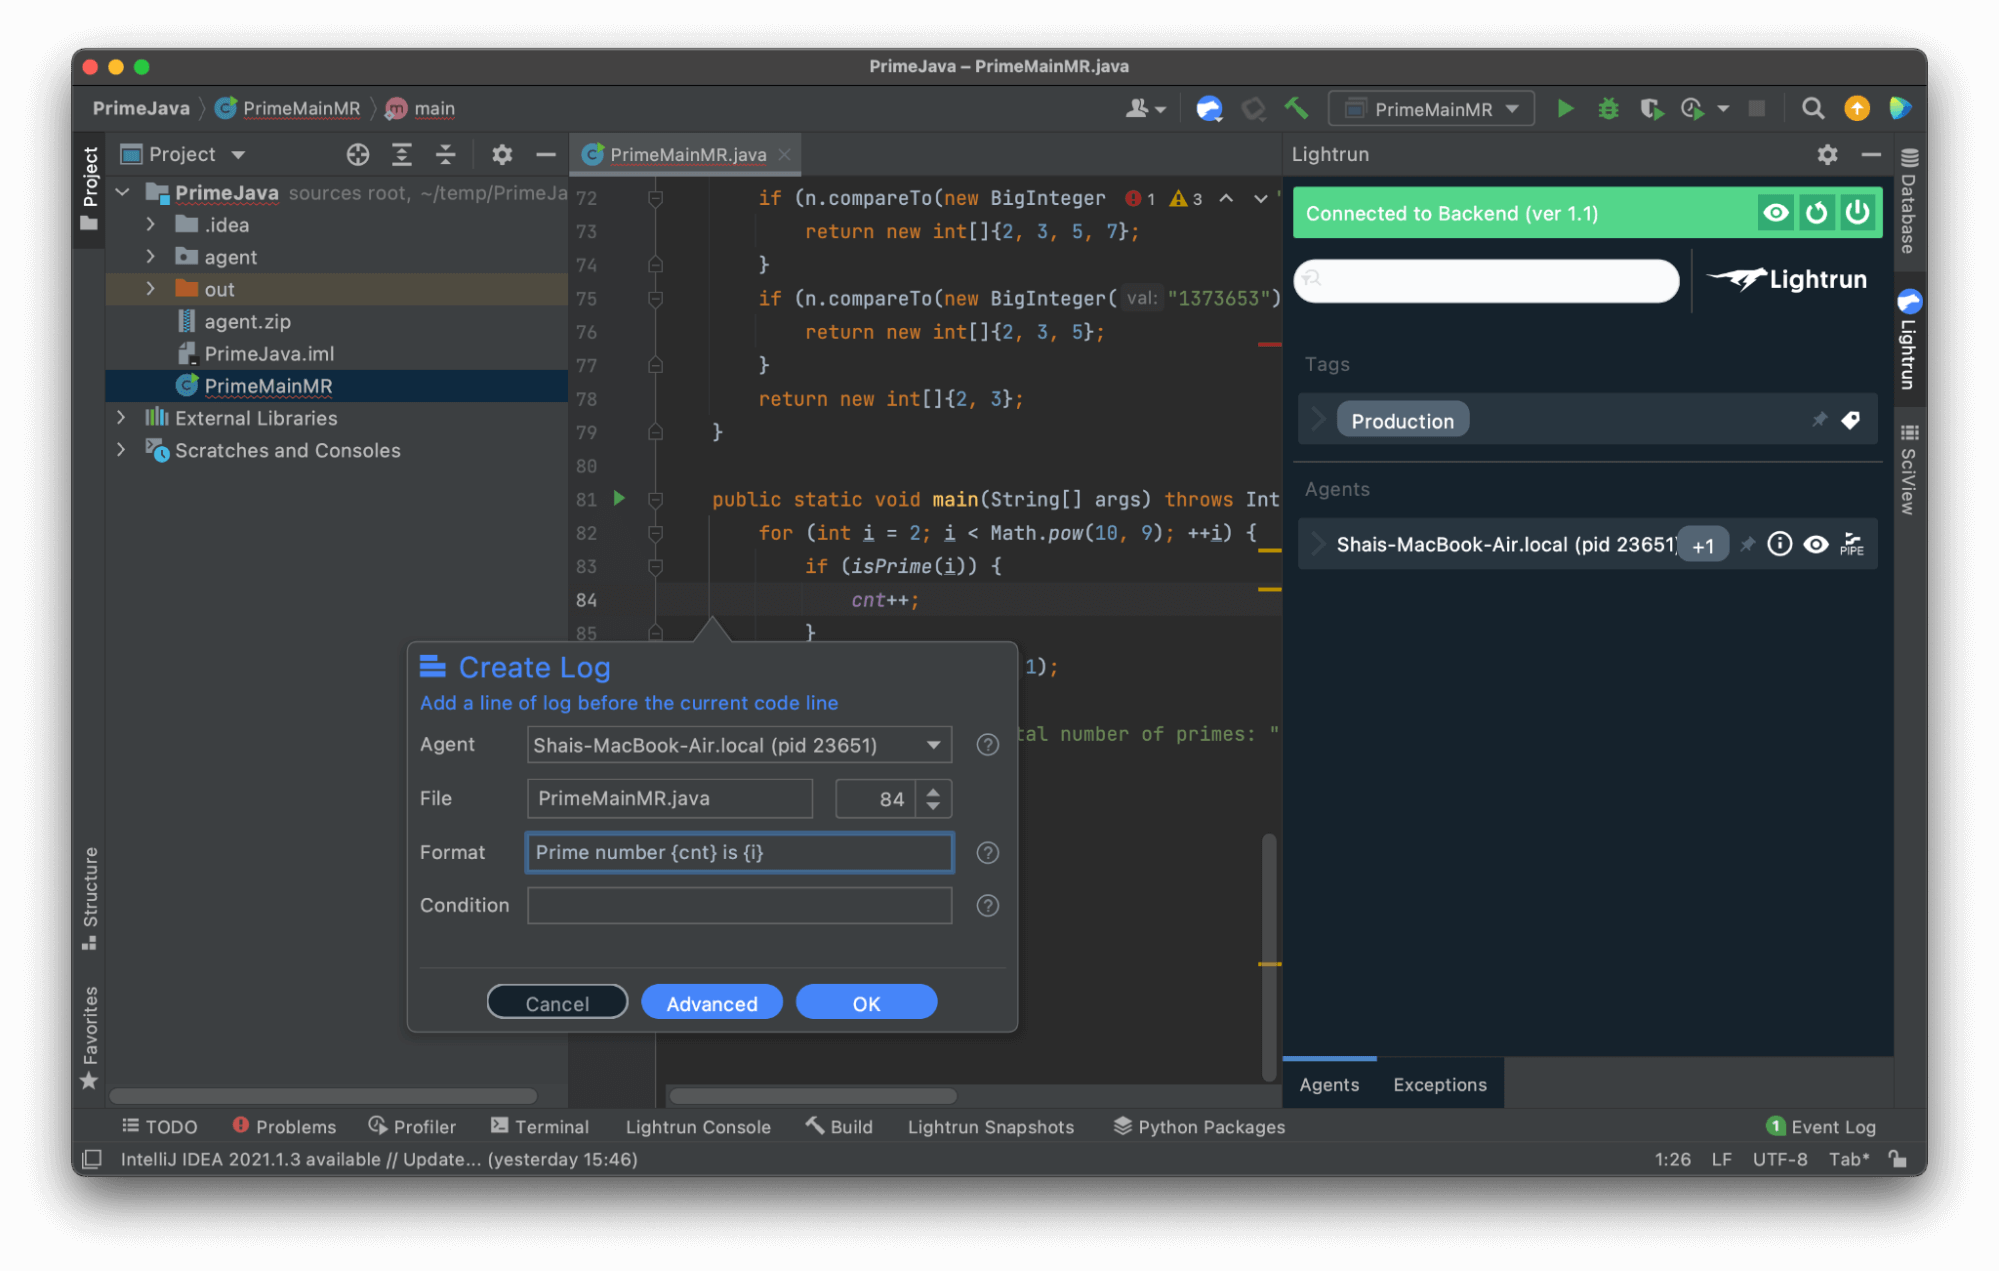
This injects a new log into the application. Notice the variables in the curly braces. In those braces, we can use any valid readonly Java expression, including method calls. Now if you look at the app you’ll notice printouts like this:
Oct 24, 2021 12:39:46 PM PrimeMainMR main
INFO: LOGPOINT: Prime number 22020 is 249721

Oct 24, 2021 12:39:46 PM PrimeMainMR main
INFO: LOGPOINT: Prime number 22021 is 249727

Oct 24, 2021 12:39:46 PM PrimeMainMR main
INFO: LOGPOINT: Prime number 22022 is 249737

Oct 24, 2021 12:39:46 PM PrimeMainMR main
INFO: LOGPOINT: Prime number 22023 is 249749

Oct 24, 2021 12:39:46 PM PrimeMainMR main
INFO: LOGPOINT: breakpointId: [c7b98d7e-2a2d-4c4b-89b3-3e730f9b93a5]:
Logpoint is paused due to high call rate until log quota is restored

Oct 24, 2021 12:39:46 PM PrimeMainMR main
INFO: LOGPOINT: Prime number 22059 is 250169
Notice that printouts were removed to preserve low CPU usage. If you use complex expressions in the log or print out too much data, Lightrun will throttle you. This keeps your servers stable.
Once you’re done with the log, you can delete it from the right click menu or the tree on the right.
Step 4 – Add a Snapshot
In PrimeMainMR.java, go to line 23 and right-click on it. Select Lightrun and Snapshot (Virtual Breakpoint). Notice that a snapshot doesn’t have a format entry.
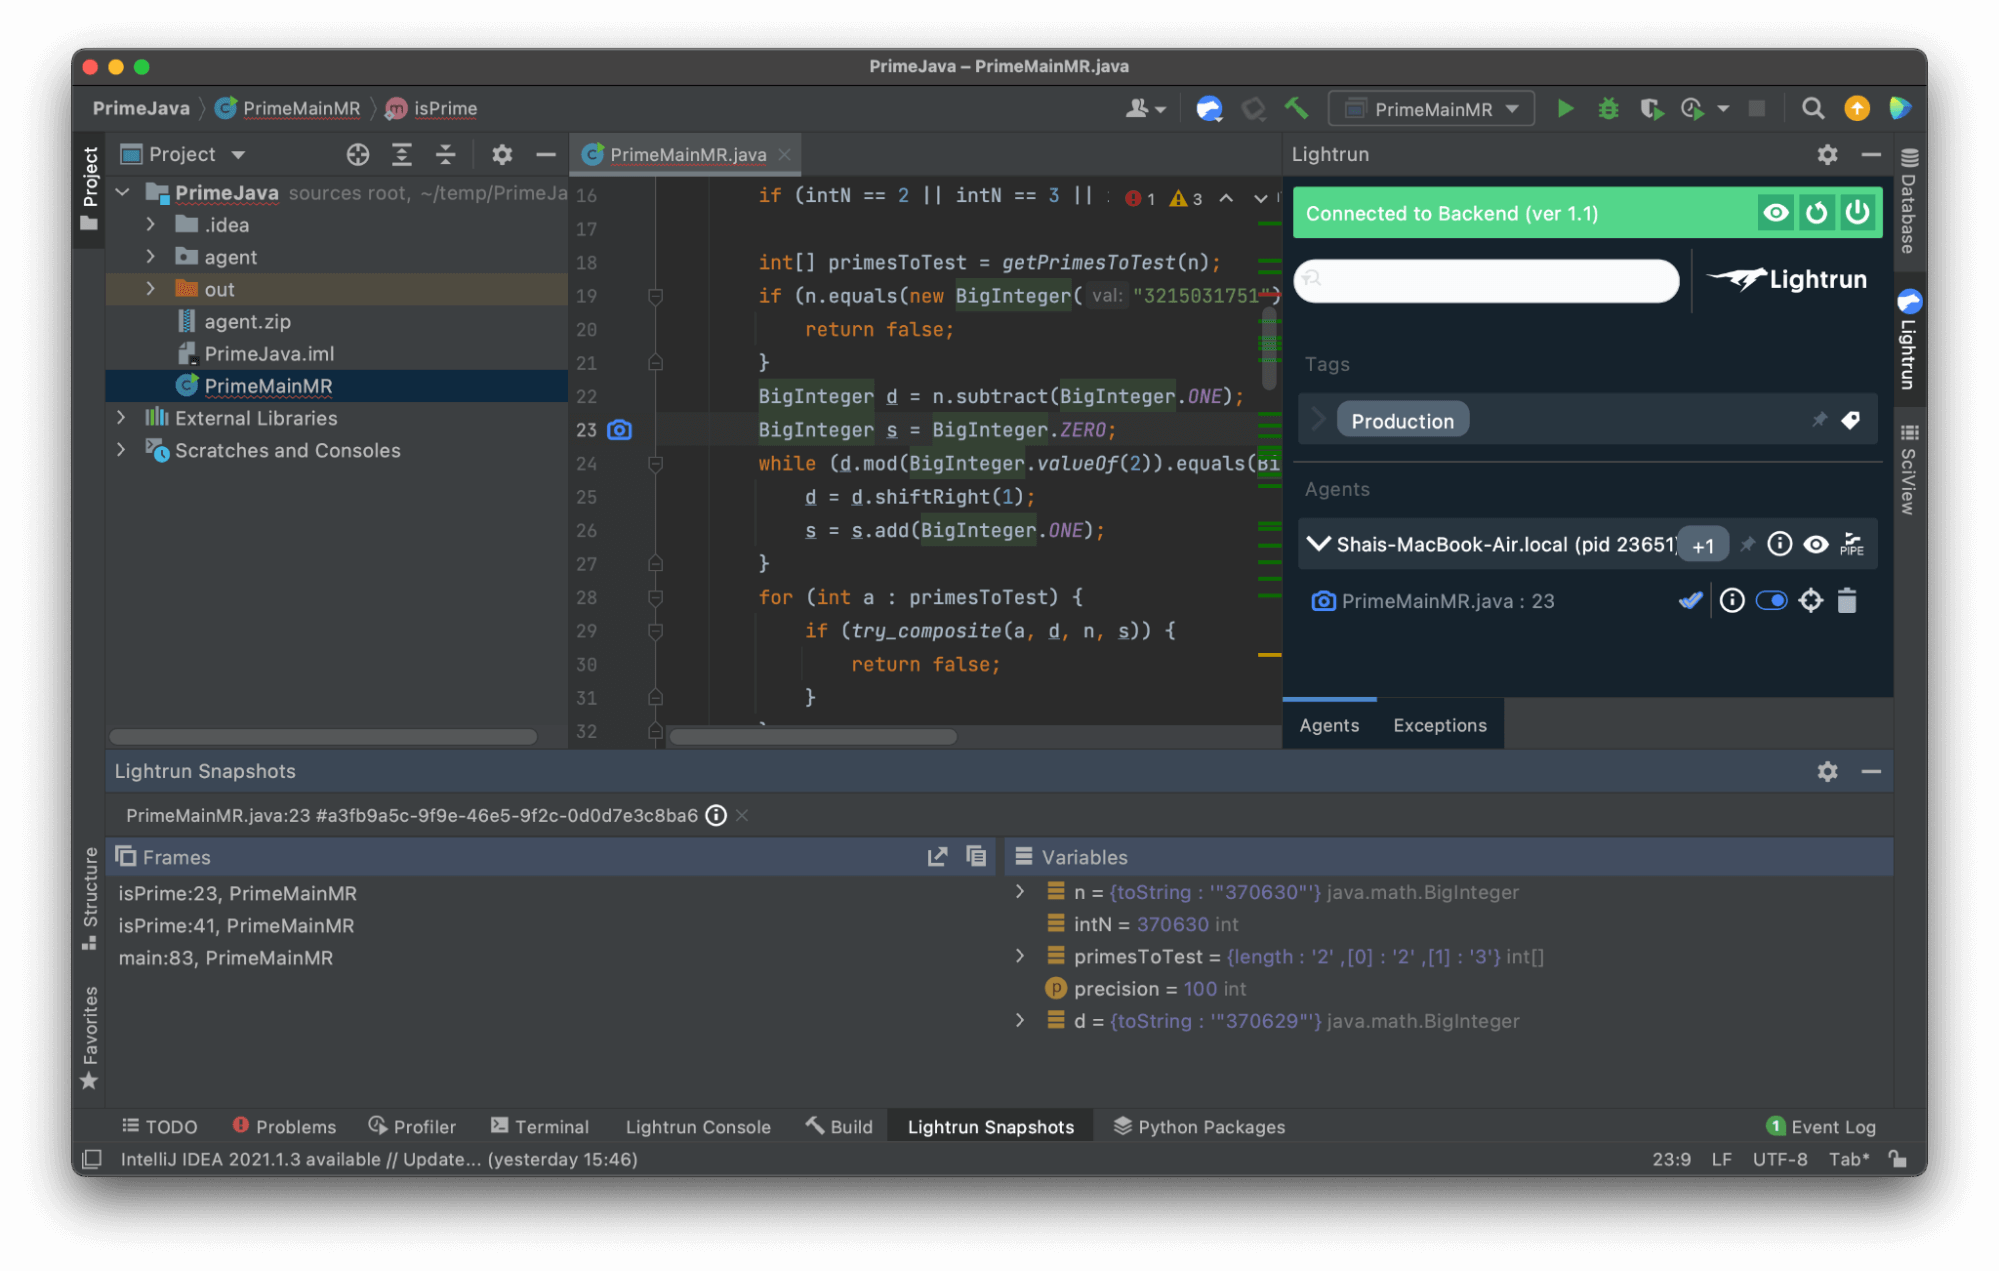
The snapshot is like a debugging breakpoint, but it doesn’t stop the execution of the application. As such it can’t break your live application flow.
You can see the stack trace on the left which you can navigate through. You can see variable values on the right matching the current stack frame and you can use those to understand what went on in a particular phase.
Notice that all Lightrun actions (snapshots, logs and metrics) support conditional execution. That means you can use an expression to limit them to a specific case. E.g. userName.equalsIgnoreCase("Shai") will limit logs/snapshots only to the user Shai.
There’s So Much More
I barely scratched the surface here. I didn’t touch metrics, tags or complex usages. Installation and setup are also pretty elaborate in some cases, so if you run into trouble don’t hesitate to contact our support team via the chat widget on the website.
Lightrun can give your application a level of observability that hasn’t been seen before.
See Also
See more posts in this series:
It’s Really not that Complicated.
You can actually understand what’s going on inside your live applications.