OpenTracing vs. OpenTelemetry
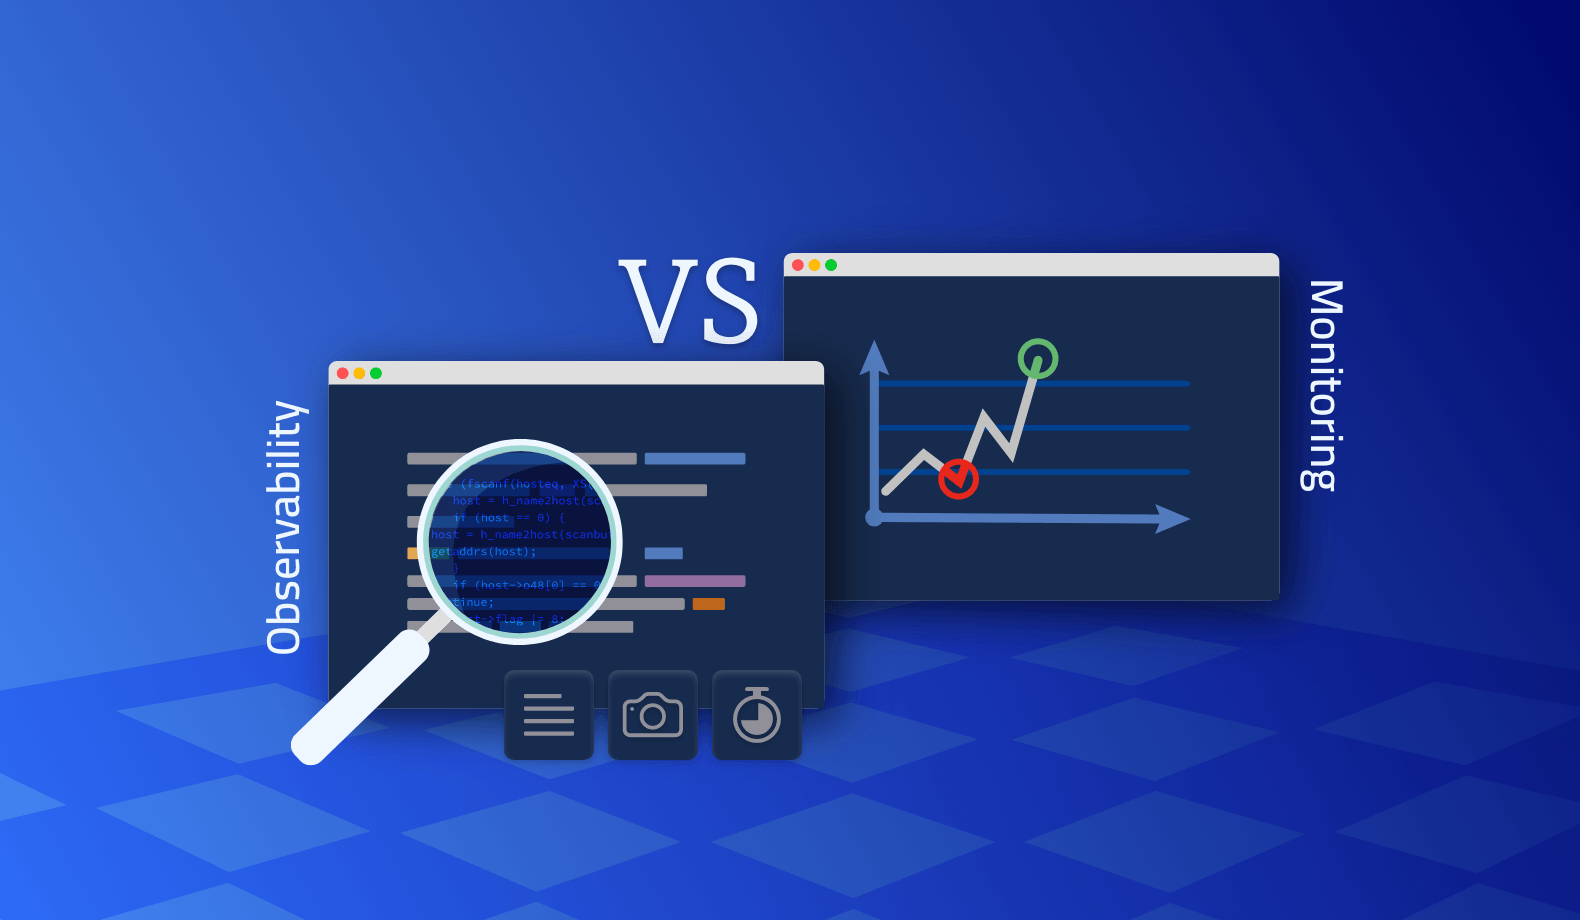
Monitoring and observability have increased with software applications moving from monolithic to distributed microservice architectures. While observability and application monitoring share a similar definition, they also have some differences.
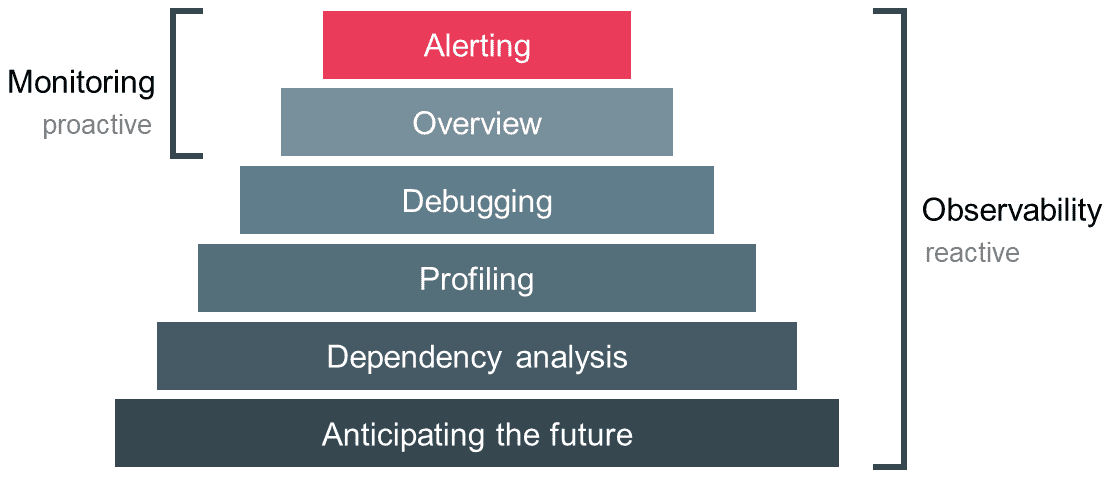
The purpose of both monitoring and observability is to find issues in an application. However, monitoring aims to capture already known issues and display them on a dashboard to understand their root cause and the time they occurred.
On the other hand, observability takes a much low-level approach where developers debug the code to understand the internal state of an application. Thus, observability is the latest evolution of application monitoring that helps detect unknown issues.
Three pillars facilitate observability. They are logs, metrics, and traces.
- Metrics indicate that there is an issue.
- Traces tell you where the issue is.
- Logs help you to find the root cause.
Observability offers several benefits, such as the following:
- Find issues that would otherwise be difficult to detect. Usually, troubleshooting production issues is a disaster.
- Reduce alert fatigue.
- Faster release of products.
- Increased automation.
- Increased productivity of developers.
According to Gartner, by 2024, 30% of enterprises will use observability to improve the performance of their digital businesses. It’s a rise from what was less than 10% in 2020.
What is OpenTracing?
Logs help understand what is happening in an application. Most applications create logs on the server on which they’re running. However, logs won’t be sufficient for distributed systems as it is challenging to find the location of an issue with logs. Distributed tracing comes in handy here, as it tracks a request from its inception to the end.
Although tracing provides visibility into distributed applications, instrumenting traces is a very tedious task. Each tracing tool available works in its way, and they are constantly evolving. Besides, different tools may be required for different situations, so developers shouldn’t have to be stuck with one tool throughout the whole software development process. This is where OpenTracing comes into play.
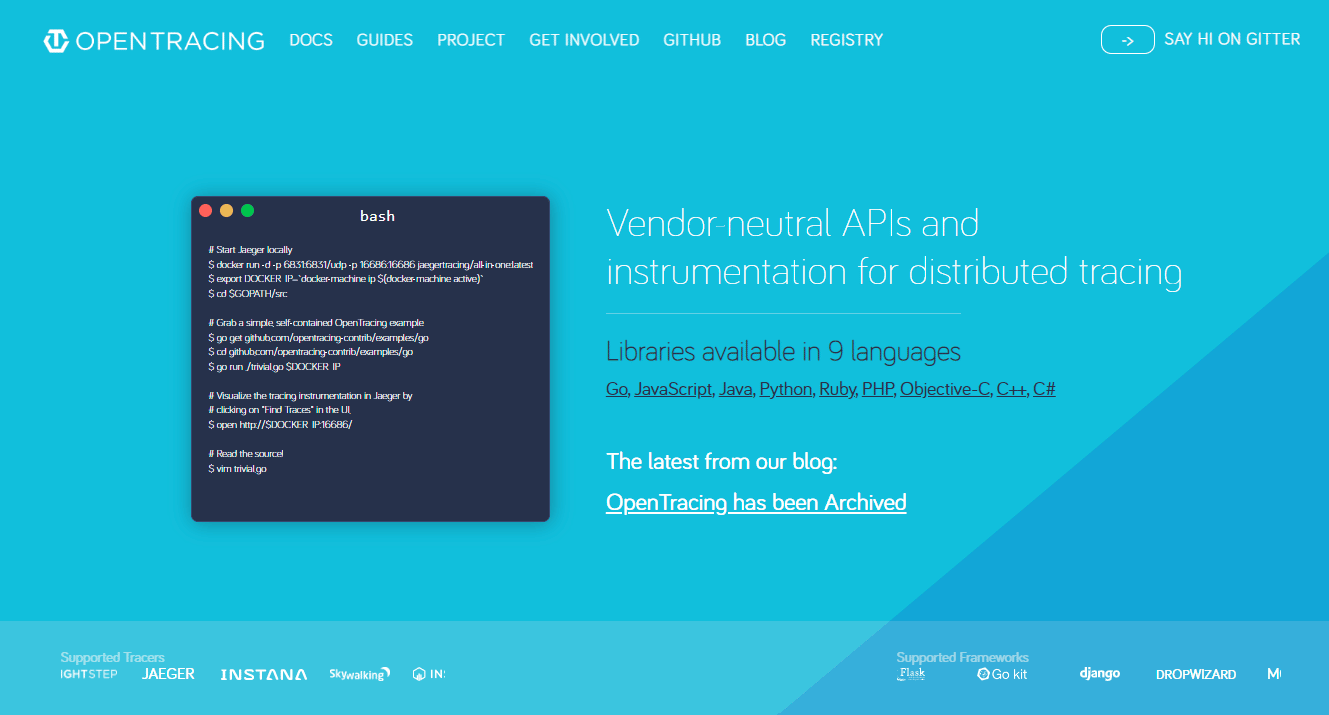
OpenTracing is an open-source vendor-agnostic API that allows developers to add tracing into their code base. It’s a standard framework for instrumentation and not a specific, installable program. By providing standard specifications to all tracing tools available, developers can choose the tools that suit their needs at different stages of development. The API works in nine languages, including Java, JavaScript, and Python.
OpenTracing Features
OpenTracing consists of four main components that are easy to understand. These are:
Tracer
A Tracer is the entry point of the tracing API. Tracers are used to create spans. They also let us extract and inject trace information from and to external sources.
Span
Spans are the primary building block or a unit of work in a trace. Once you make a web request that creates a new trace, it’s called a “root span.” If that request initiates another request in its workflow, the second request will be a child span. Span can support more complex workflows, even involving asynchronous messaging.
SpanContext
SpanContext is a serializable form of a Span that transfers Span information across process boundaries. It contains trace id, span id, and baggage items.
References
References build connections between spans. There are two types of references called ChildOf and FollowsFrom.
What is OpenTelemetry?
Telemetry data is a common term across different scientific fields. It is a collection of datasets gathered from a remote location to measure a system’s health. In DevOps, the system is the software application, while the data we collect are logs, traces, and metrics.
OpenTelemetry is an open-source framework with tools, APIs, and SDKs for collecting telemetry data. This data is then sent to the backend platform for analysis to understand the status of an application. OpenTelemetry is a Cloud Native Computing Foundation (CNCF) incubating project created by merging OpenTracing and OpenCensus in May 2019.
OpenTelemetry aims to create a standard format for collecting observability data. Before the invention of solutions like OpenTelemetry, collecting telemetry data across different applications was inconsistent. It was a considerable burden for developers. OpenTelemetry provides a standard for observable instrumentation with its vendor-agnostic APIs and libraries. It saves companies a lot of valuable time spent on creating mechanisms to collect telemetry data.
You can install and use OpenTelemetry for free. This guide will tell you more about this framework.
OpenTelemetry features
You have to know the critical components of OpenTelemetry to understand how it works. They are as follows:
API
APIs help to instrument your application to generate traces, metrics, and logs. These APIs are language-specific and written in various languages such as Java, .Net, and Python.
SDK
SDK is another language-specific component that works as a mediator between the API and the Exporter. It defines concepts like configuration, data processing, and exporting. The SDK also handles transaction sampling and request filtering well.
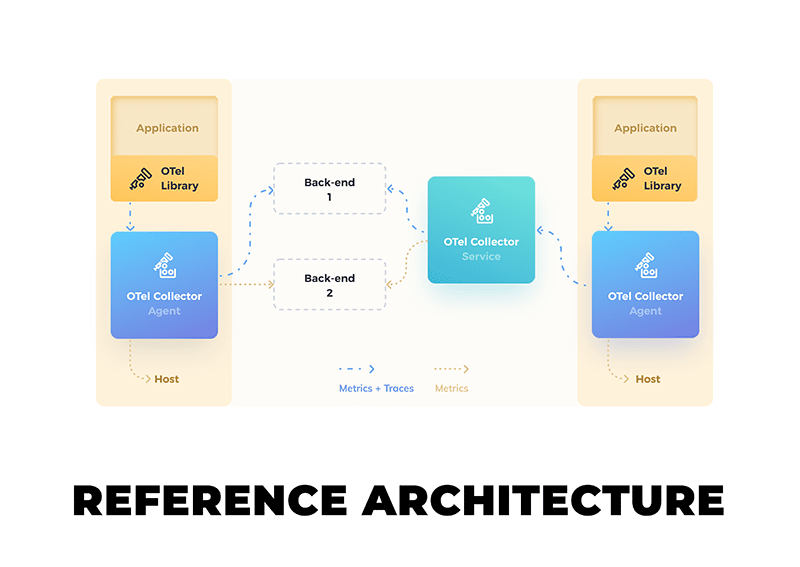
Collector
The collector gathers, processes, and exports telemetry data. It acts as a vendor-agnostic proxy. Though it isn’t an essential component, it is helpful because it can receive and send application telemetry data to the backend with great flexibility. For example, if necessary, you can handle multiple data formats from OTLP, Jaeger, and Prometheus and send that data to various backends.
In-process exporter
You can use the Exporter to configure the backend to which you want to send telemetry data. The Exporter separates the backend configuration from the instrumentation. Therefore, you can easily switch the backend without changing the instrumentation.
Differences between OpenTracing and OpenTelemetry
OpenTracing and OpenTelemetry are both open-source projects aimed at providing vendor-agnostic solutions. However, OpenTelemetry is the latest solution created by merging OpenTracing and OpenCensus. Thus, it is more robust than OpenTracing.
While OpenTracing collects only traces in distributed applications, OpenTelemetry gathers all types of telemetry data such as logs, metrics, and traces. Moreover, OpenTelemetry is a collection of APIs, SDK, and libraries that you can directly use. One of the critical advantages of OpenTelemetry is its ability to quickly change the backend used to process telemetry data.
Overall, there are many benefits of using OpenTelemetry over OpenTracing, so developers are migrating from one to the other.
Summary
Logs, traces, and metrics are essential to detect anomalies in your application. They help to avoid any adverse effects on the user experience. While logs can be less effective in distributed systems, traces can indicate the location of an issue. Solutions like OpenTracing and OpenTelemetry provide standards for collecting this telemetry data.
You can simplify the observability by using Lightrun. This tool allows you to insert logs and metrics in real-time even while the server is running. You can debug all types of applications, including monolithic applications, microservices, Kubernetes clusters, and Docker Swarm. Amongst many other benefits, Lightrun enables you to quickly resolve bugs, increase productivity, and enhance site reliability. Get started with Lightrun today!
It’s Really not that Complicated.
You can actually understand what’s going on inside your live applications.