Lightrun Announces GA Support for Visual Studio Code
Lightrun gives developers using VS Code granular, code-level visibility into live applications directly from the IDE, without having to push new code.
Lightrun is the world’s first IDE-native observability platform. A developer-first product, Lightrun enables engineering teams to connect to their live applications and continuously identify critical issues without hotfixes, redeployments, or restarts.
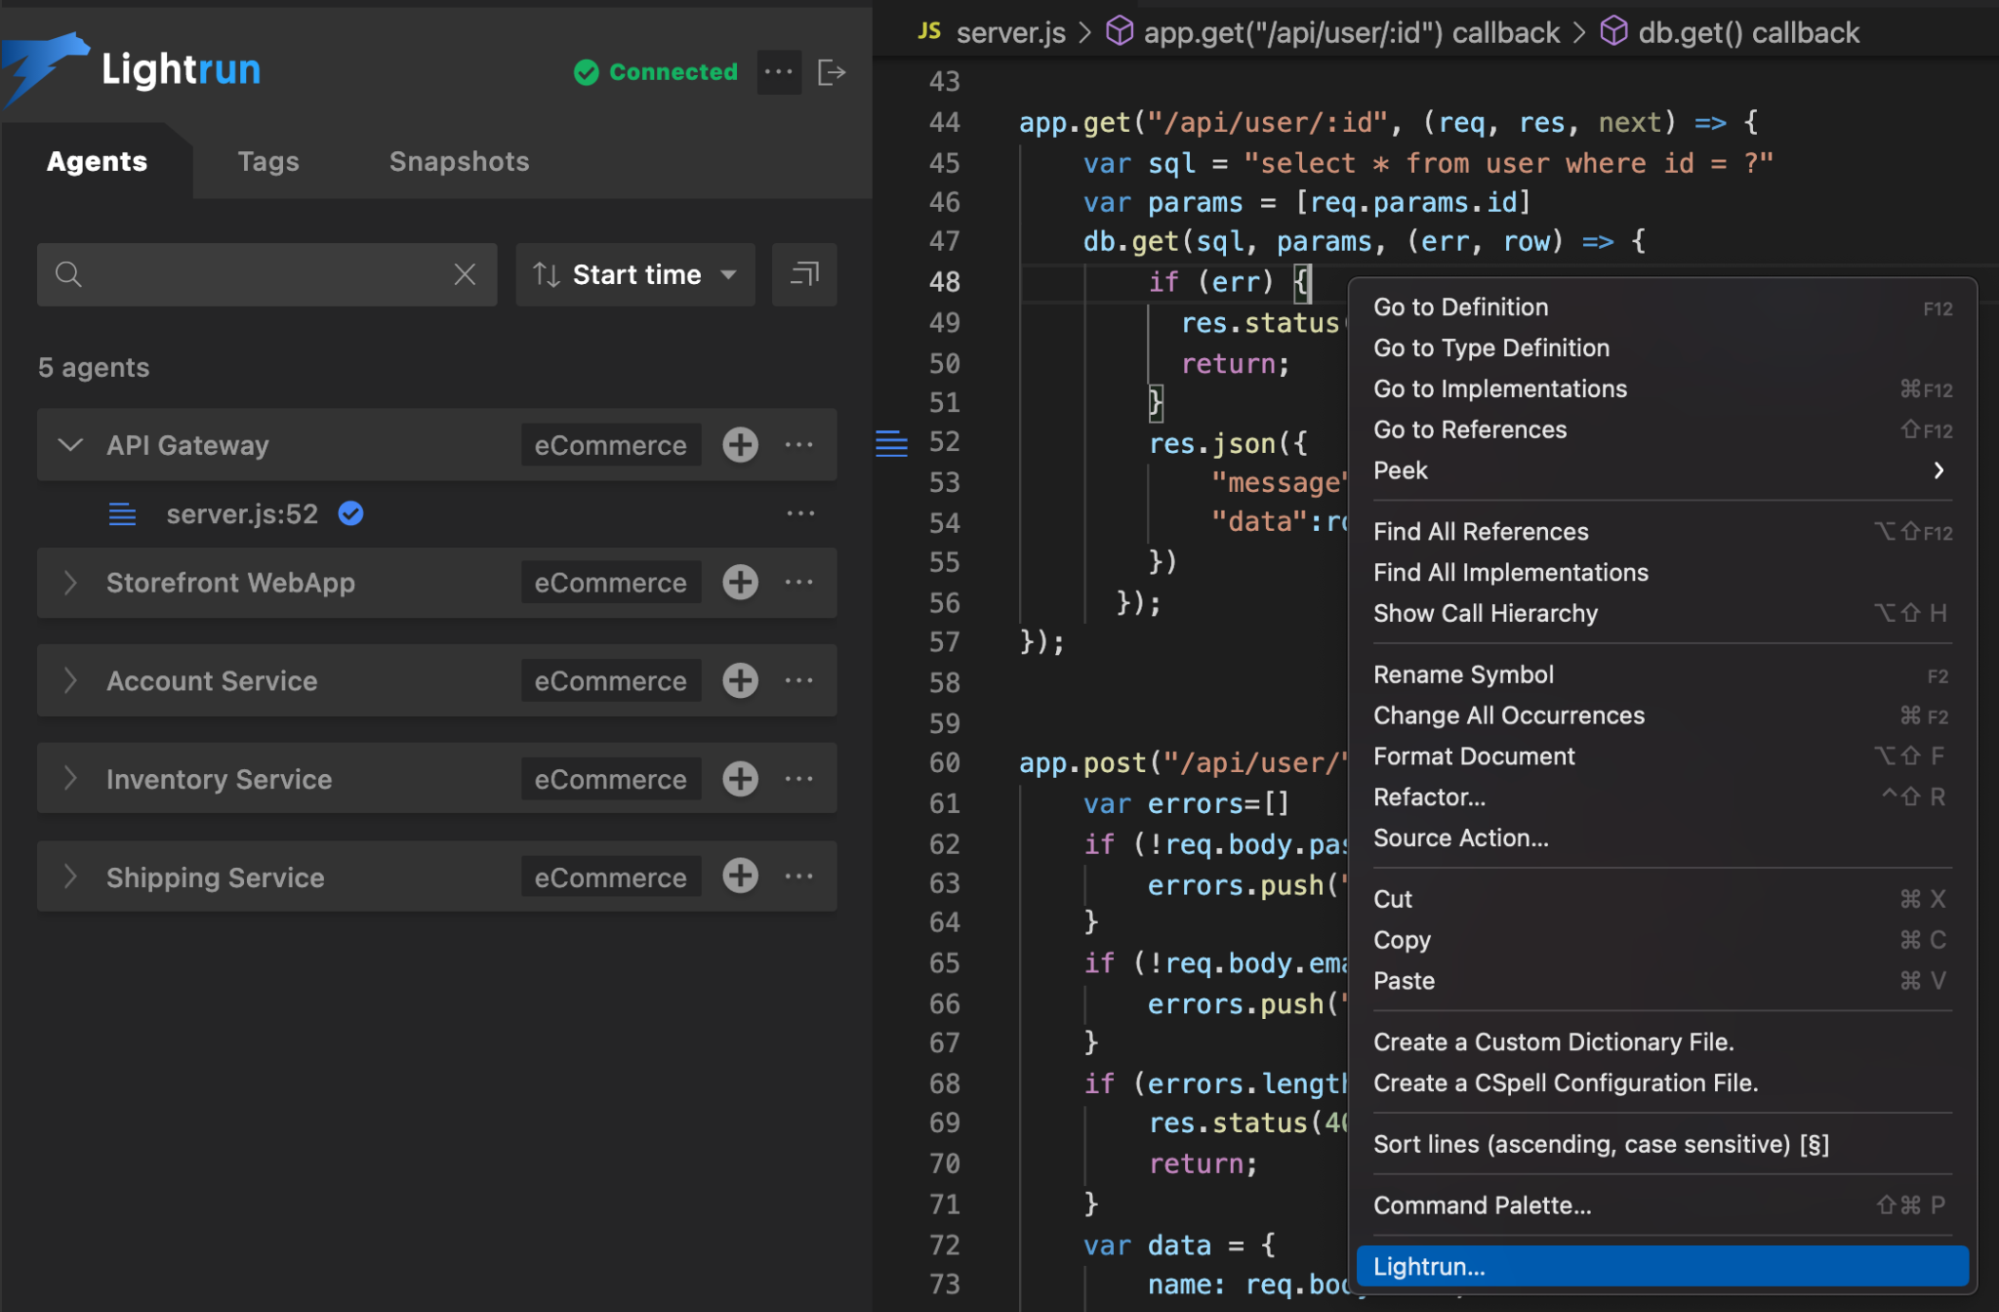
We are proud to announce the general availability of the Lightrun extension for Visual Studio Code, the popular IDE from Microsoft. Using this completely free newly released VS Code extension, developers can now add Lightrun Logs, Snapshots and Metrics to live applications without pushing new code, redeploying or even restarting them.
To understand why this is a significant improvement for current debugging workflows for VS Code users, it’s important to first understand the current ecosystem for troubleshooting running applications in VS Code.
VS Code ships with built-in capabilities for debugging, including stepping through source code, inspecting variables, viewing call stacks, and more. As with most other debuggers, Debugging in VS Code allows you to attach to a running application and start debugging it – stepping into code as you need, creating watch expressions and so forth.
The problem starts when you want to work your way through issues while the application is still running, without having to stop at every breakpoint, and without potentially causing side effects to the state of the application. This way, developers can access the real state of the application – including extracting very specific variable values and evaluating expression right in the actual context the application is running in.
With Lightrun for VS Code, developers can now observe more granular information at the application layer by adding logs, metrics, and traces in real-time – all while the service is running, without ever leaving VS Code and without causing side effects.
If you want to get a visual sense of what the plugin looks like before jumping in, you can watch this short video:
In addition, Lightrun is distributed by design. Attaching a normal debugger entails finding the correct place the application is actually running in (which might prove difficult in a distributed, multi-cloud or multi-cluster application), getting the correct debug port, and hooking into it. With Lightrun, the application comes to you – no attaching in real-time; all live applications are already instrumented and ready for real-time log, trace, or metric addition whenever you need them.
Another great aspect of the new VS Code plugin is collaboration – Lightrun was built from the ground up to enable team players to do their best work. If you’ve been around the VS Code ecosystem for a while, you might’ve noticed one particularly popular extension – Live Share. Live Share is a live collaboration tool that lets developers work on the same code simultaneously, simulating as a face-to-face pair programming session you might have with a buddy at work. With Lightrun, on-call teams can now add real-time observability to their application – as the incident is occurring and without having to reproduce locally – which can prove extremely helpful when investigating tough-to-crack, time-sensitive production issues.
Remember how we mentioned before that Lightrun is read-only? The key player ensuring this behavior is the Lightrun Sandbox™ – a proprietary mechanism that ensures there are no side effects or unexpected performance overhead to your application’s behavior, verifying integrity, stability, and security of the instrumentation. Lightrun meets the developers where they are – in the cloud, in microservices, and in serverless functions, while covering all environments – development, staging, and production.
It’s Really not that Complicated.
You can actually understand what’s going on inside your live applications.