
Interview with Tom Granot – Developer Observability, KoolKits and Reliability
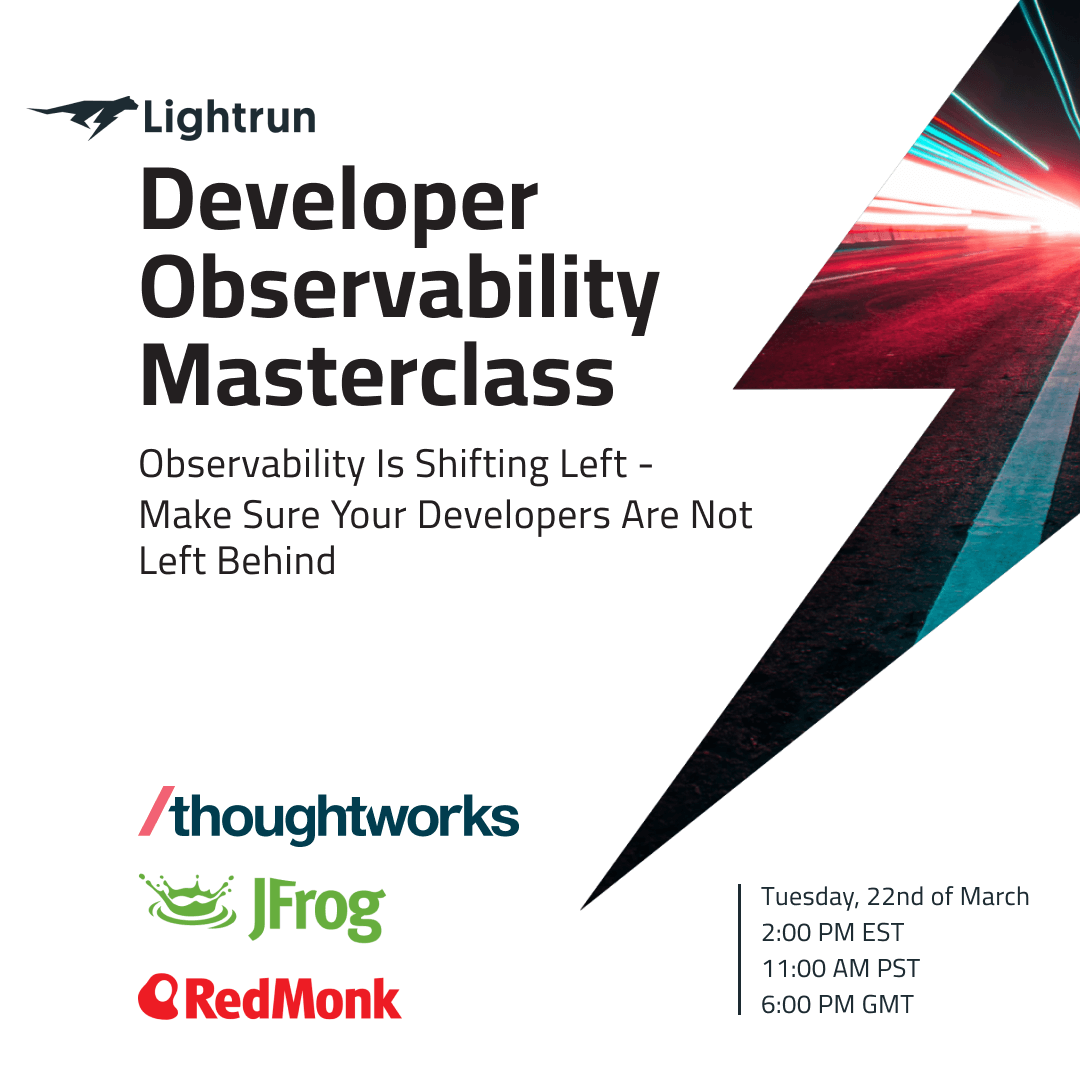
In preparation for the upcoming Developer Observability Masterclass we’re hosting at Lightrun with Thoughtworks, RedMonk and JFrog, I sat down for a brief interview with Tom Granot – the Director of Developer Relations at Lightrun.
Tom will MC the event as he did for the Developer Productivity Masterclass we ran back in December.
Shai: Tell us a bit about yourself and your background.
Tom: Before joining Lightrun, I worked as an SRE at Actyx. This drove home the importance of observability tools – I got a sense of the potential problems and, to some extent, the blindness that developers face in production.
At Lightrun, I run the Developer Relations group and the open source initiatives, such as KoolKits.
Shai: Observability isn’t new. Why even have this Masterclass?
Tom: This isn’t a Masterclass about observability – it’s about Developer Observability. To explain why the differentiation is required, note that over the past decade or so DevOps and SRE roles became commonplace in many software organizations.
This is great, as it means developers can focus on building their applications and there are DevOps engineers that deal with building and maintaining systems that get this code into the hands of customers. In addition, SREs are there to build systems to operate, maintain and observe the software as it is running in production – and they have their own set of tools to do their job well. The problem starts, of course, when something goes wrong in production that might relate to the actual application logic or performance and not the infrastructure that runs it.
Back in the day when production failed, we could just connect to the server and see what’s going on to understand why a specific path of our code is behaving in a weird way. Now, as application developers, we rarely have access to the production machine ourselves as there are dedicated teams that are supposed to do that work instead of us.
This removes us from “the metal”, and this gap between the developer and the actual code running in production results in a difficulty to understand exactly how our application is behaving in production, and how we should build the next set of features sot that they will behave well in the real world.
Observability tooling is there to fill that gap, but most of the tools are designed for DevOps and SREs. This makes sense as they usually handle the production workloads – but it leaves application developers out of the picture. Developer Observability revolves around tools and practices that were designed with application developers in mind. They provide the value proposition developers need, and “meet them” in their own environments.
This fits cleanly into the “shift left” paradigm, that is all about re-empowering developers. Bringing tools to R&D so we can be as productive as we were a decade ago, when the machine running our code was closer to us (both physically and metaphorically), without sacrificing all the amazing gains we made in this field.
Shai: Can you give examples?
Tom: Sure.
A tool designed for the DevOps crowd – like an APM – will present you with performance information about a web service. It won’t tell you exactly the failure happened – it will just tell you there was a failure.
This is fine for operators, but not so great for a developer.
The obvious comment when I mention this to people is that when you have a failure you might have logs, but in my experience might is key; you usually either have no logs or way too many logs that raise your ingestion bill. And even then, combing through logs to find the right container in the right pod in the right node in a large k8s cluster… that isn’t fun!
Developer observability tools work at the source code level: too fine-grained for OPS, but just right for R&D.
Shai: It sounds like you’re describing debugging. How is this different?
Tom: There’s a great deal of correlation between developer observability and debugging. We use both with a similar intent of tracking a bug or failure. The differentiating factor is the production environment. In it, we need stability, security and scale. We can’t address any of those with regular debuggers.
Shai: Why not?
Tom: Critical mass. Kubernetes and cloud-native revolutionized our industry – it’s now possible to build applications at a scale that only FAANG companies could dream of a few years back. Serverless and hosting made things even more complex and further diverged the production environment from local and staging.
With this much scale and diversity, you’re bringing a lot of complexity to the table. As complexity in production rose quickly over the past decade, we’re now facing a dire need for better comprehension of our production environments; in the past, observability tools were optional. As production complexity rises, they become essential.
Shai: Can you tell me how KoolKits fits into that?
Tom: At Lightrun we keep our finger on the pulse of developer-first innovation. When kubectl debug went into beta, we instantly started evaluating it and tried to understand how we can build on that. For the unfamiliar, Kubectl debug lets you run a new container in the same namespaces as a running pod, for debugging purposes.
This is amazingly useful when tracking some production issues. But one of the pain points in that approach has been the bare nature of the container images you get out of the box with kubectl debug. There are no tools, debuggers, vim etc – you have to bring your own tools.
That’s when Leonid, our CTO, came up with the idea of KoolKits – which is an opinionated set of pre-installed tools for kubectl debug. There’s a variant for each language/platform, e.g. Java (JVM), NodeJS, Python and even Go. We’re pretty excited about it and recently open-sourced it as well – see the project here.
Shai: Thank you so much for this interview, Tom. Do you have any closing thoughts you wish to share?
Tom: I hope everyone joins us for the Developer Observability Masterclass. There will be some amazing industry leaders to talk to and I can’t wait to pick their brains on this awesome new methodology. The Thoughtworks team are the people who brought us knowledge on refactoring, microservices, progressive delivery, etc. well before those were “trends” and common best practices, and James from Redmonk is an industry legend!
This also goes for Baruch Sadogursky, Dev & DevOps Advocate at JFrog who we were lucky to get.
I’m sure we all have a lot to learn from them. See you there!
It’s Really not that Complicated.
You can actually understand what’s going on inside your live applications.

