The SRE’s Quick Guide to Kubectl Logs
Logs are key to monitoring the performance of your applications. Kubernetes offers a command line tool for interacting with the control plane of a Kubernetes cluster called Kubectl. This tool allows debugging, monitoring, and, most importantly, logging capabilities.
There are many great tools for SREs. However, Kubernetes supports Site Reliability Engineering principles through its capacity to standardize the definition, architecture, and orchestration of containerized applications. Moreover, it infrastructures for scalable and reliable, distributed software services. This article will explain how to use the Kubernetes built-in debugging solution, Kubectl.
What is Kubernetes?
Kubernetes is an open-source platform to manage, scale and automate the deployment of containerized applications. It separates the containers that make up an application into logical units for easy administration.
There are several Kubernetes functionalities:
- Application hosting: You can choose which server will host the container and how it launches.
- Load balancing: Kubernetes calculates the best location to place containers and thus optimizes performance and availability.
- Storage management: To launch apps, Kubernetes mounts and adds your chosen storage system.
- Self-healing: Kubernetes will roll back for you if something goes wrong following a change to your application.
What is Kubectl?
Kubectl is a Kubernetes command-line tool. You use it to manage and run your Kubernetes cluster. Although there are a few GUI tools for Kubernetes, the most popular method of communicating with a Kubernetes cluster is through Kubectl. It’s crucial since it enables you to view fundamental use data and read logs from containers.
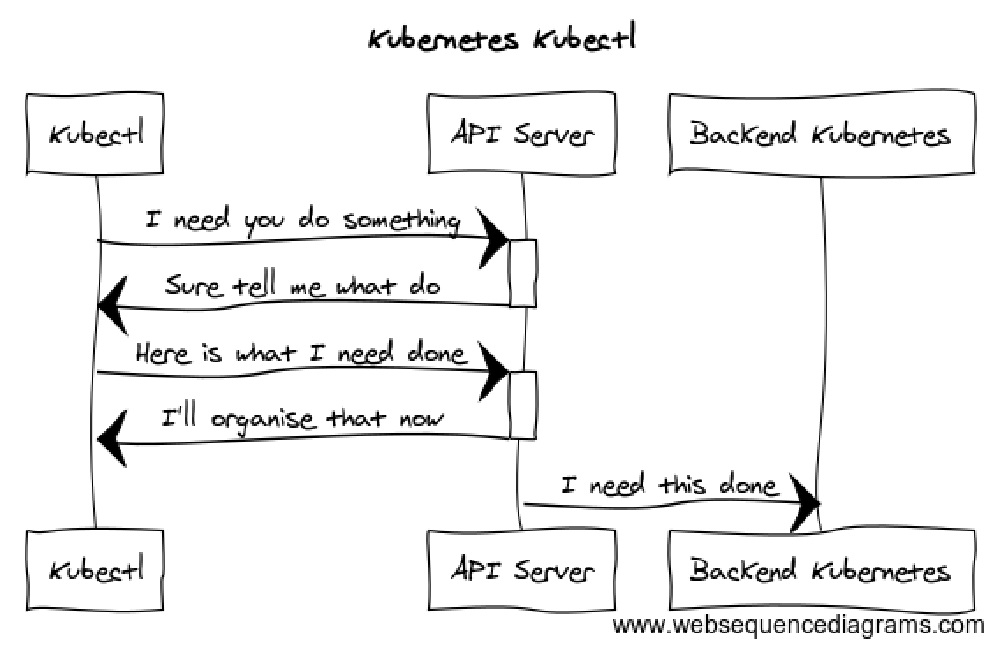
Kubernetes’ API gives full control over Kubernetes. Each Kubernetes activity is accessible as an API endpoint that is used to operate using an HTTP request. Thus, the primary function of Kubectl is to execute HTTP requests to the Kubernetes API.
The API reference contains the endpoints for all Kubernetes operations’ APIs. The API server’s URL must include before any of the endpoint paths given in the API reference to perform a real request to an endpoint. As a result, Kubectl sends an HTTP POST request to the API URL whenever you run the API. All commands that communicate with the Kubernetes cluster operate similarly to Kubectl. Kubectl merely sends HTTP queries to the relevant Kubernetes API endpoints in each scenario.
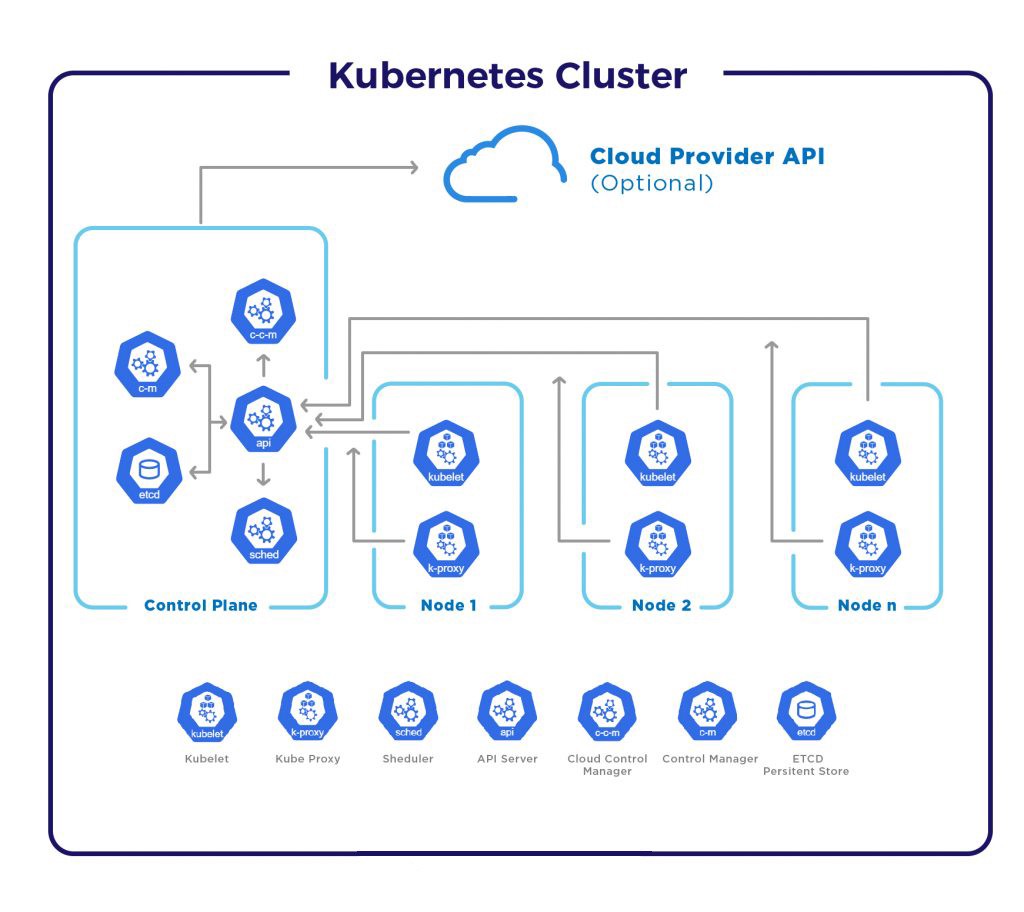
Kubernetes consists of several parts that operate as distinct processes on cluster nodes. Each part has a specialized function; some run on the worker nodes while others run on the master nodes. The smallest execution unit in Kubernetes is a pod. Pods may contain one or more apps.
Some of the core functions of Kubectl include:
- Getting logs from a container that was previously created.
- Kubectl running on the node handles requests by reading directly from the log file.
- Managing the cluster manager and executing commands against the Kubernetes cluster.
- A centralized state of resources exists internally to manage CRUD operations.
- Maintaining the health of your cluster and application while complying with industry standards for container orchestration.
- Maintaining logs on the node if a container restarts.
Logs in Kubernetes
Logs are helpful for many reasons, including observing and monitoring the performance of our application and keeping tabs on sales, new users, requests, and other developments. We also need them for problem-solving; we review the logs whenever our program fails or something goes wrong.
To review all the logs in Kubernetes, you can run kubectl logs [pod_name]
This log collecting strategy is less than ideal when using Kubernetes since you must gather logs for several pods (applications) across numerous cluster nodes.
Therefore, the default Kubernetes logging architecture advises recording the standard output (stdout) and standard error output (stderr) to a log file from each container on the node.
To view the logs for a specific container, you can run kubectl logs ${POD_NAME} ${CONTAINER_NAME}
Pods being deleted and then regenerated is very common in a Kubernetes environment. For instance, Kubernetes’ responsibility includes deleting a container when it crosses the resource limits. However, if your pod occasionally restarts, Kubectl logs will only display the logs from a container that is currently operating. To view the logs from a previously operating container, you can add -previous to the Kubectl logs command.
Adding -follow is an additional helpful choice, enabling you to stream the logs directly from the active container in real-time. Use this if you want to view what happens in the program while it is active or if you need to live-dub a problem. You may use the command kubectl logs [pod name] -follow to receive a live stream of logs rather than repeatedly running Kubectl logs.
Discovering details about pods
To check a pod’s status, you can run kubectl get pods
To get more information on a pod, you can run kubectl describe pods pod-name
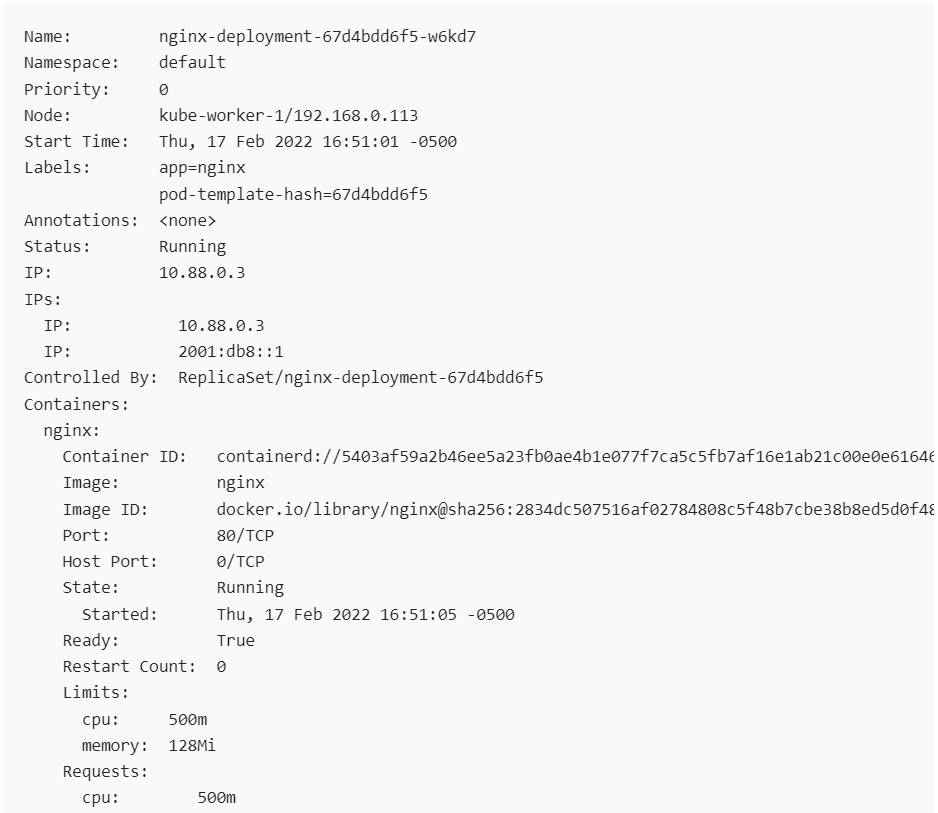
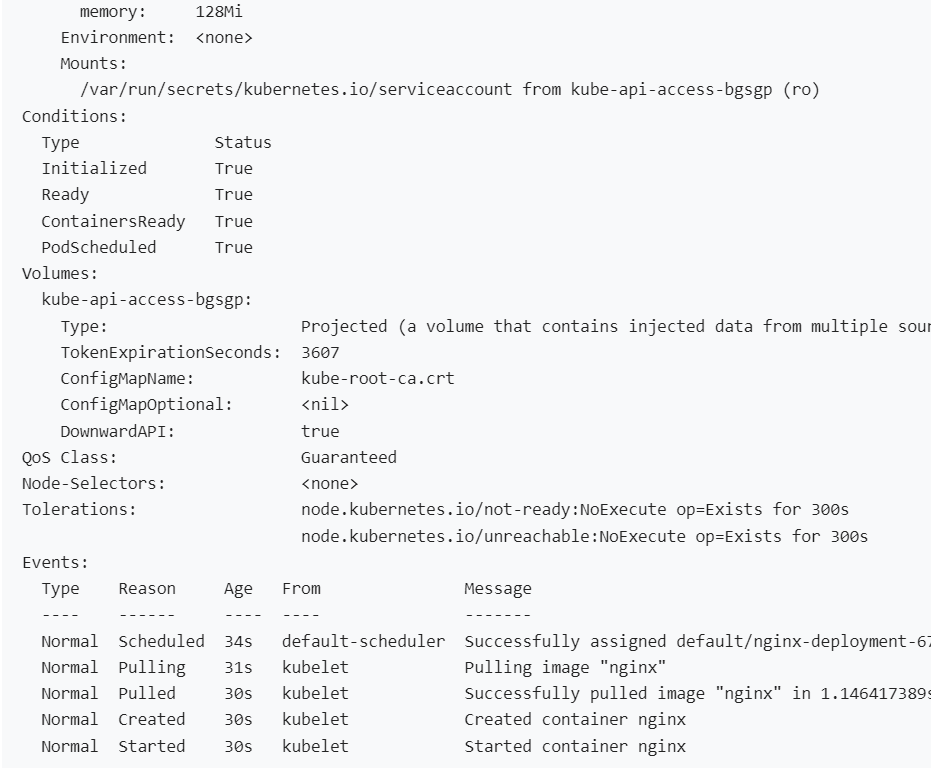
There are three container states: Waiting, Running, and Terminated. Depending on the status, additional information appears.
If the container passes its most recent readiness probe, Ready will let you know. If there is no readiness probe, the container is deemed ready.
You can use Restart Count to find how many times the container has been restarted.
The binary Ready condition, which denotes whether the pod can handle requests or not, is the sole condition currently connected with a pod.
The last thing you see is a log of recent pod-related events. The system compresses many identical occurrences by noting the first and last time an event occurred and the frequency of visits.
Debugging non-running pods
A Pod might not fit on any node.
To check the pod’s status, you can run kubectl get pods
To check why the pod is not running, you can run kubectl describe pod
To examine any affected container, you can run kubectl logs ${POD_NAME} ${CONTAINER_NAME}
To examine containers that were previously crashed, you can run kubectl logs –previous ${POD_NAME} ${CONTAINER_NAME}
Monitoring in Kubernetes
Even though you can access logs and fix bugs manually using the guidance above, this is time-consuming and may not be the ideal long-term solution. To monitor your Kubernetes application properly and have clear visibility over all the logs, metrics, and traces of your app, you need to invest in a continuous debugging and observability platform. Such platforms enable you to easily make changes, resolve bugs and collect data directly from your app in real-time without troubleshooting.
Traditionally, the development stage includes exceptions, logs, performance metrics, and traces. However, the proliferation of the cloud, microservices, and serverless architectures created a gap in observability between development and production environments. This gap makes it difficult to foresee or duplicate production-only difficulties.
Lightrun is a developer-centric observability platform. It allows you to watch and debug the functioning of your application code by securely adding logs, metrics, and traces in real-time and as needed. There is no need for redeployment, restarts, or hotfixes.
Improve your code-level observability
The kubectl logs, kubectl describe, and kubectl get commands help review, explore, and analyze the status of the logs. However, a robust observability platform enables you to get an easily accessible overview of your cluster, which will prove invaluable in the long term. Get started with Lightrun’s playground to experience our platform’s functionalities in a real, live app.
It’s Really not that Complicated.
You can actually understand what’s going on inside your live applications.