Power your AI agents with runtime history
Nov 12, 2026 / Updated: Nov 12, 2026

Introducing runtime history, powered by the new Lightrun Runtime Collector. Now AI agents like Claude Code, Cursor, Codex, and GitHub Copilot, can search how your code behaved in production as they run new tasks for your teams.
Key Takeaways
- Lightrun 1.97 adds runtime history to the Runtime Sensor at no extra cost, powered by the new Runtime Collector.
- AI agents search captured snapshot hits first through three new MCP tools, query any captured value without defining expressions in advance, and go live only when they need more, so there are fewer reproduction cycles.
- Runtime history is on by default with 30-day retention on SaaS and Single-Tenant; on-prem admins deploy the Runtime Collector through the Helm chart.
- Snapshots, dynamic logs, and metrics work exactly as before.
Since 2019, Lightrun has given developers, and then AI coding agents, on-demand insight into how their code behaves in production, at any line, with no restarts or redeploys. Today, AI agents do most of that work. But teams kept telling us the same thing: their snapshots were full of valuable runtime data, and their agents couldn’t use it in the next investigation.
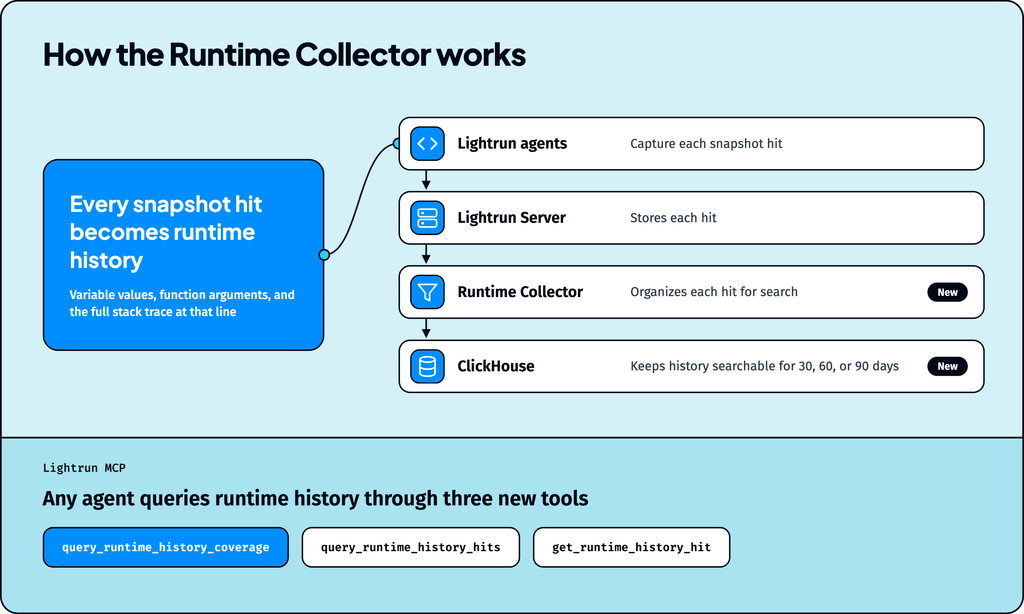
With the latest evolution of the Runtime Sensor, we’re fusing live and historic context. Each time a snapshot records a hit (the variable values, function arguments, and full stack trace at that line of code), the Runtime Collector stores it as runtime history: a searchable record of your code’s exact behavior, retained for 30, 60, or 90 days. Your agents get faster answers from evidence they already have.
Runtime history means investigations without the wait
Until now, every investigation followed the same pattern. You dropped dynamic telemetry into the code, waited for the issue to reproduce, and then reviewed what came back. If the issue was rare, the question changed halfway through, or you needed to ask it again, the loop started from scratch.
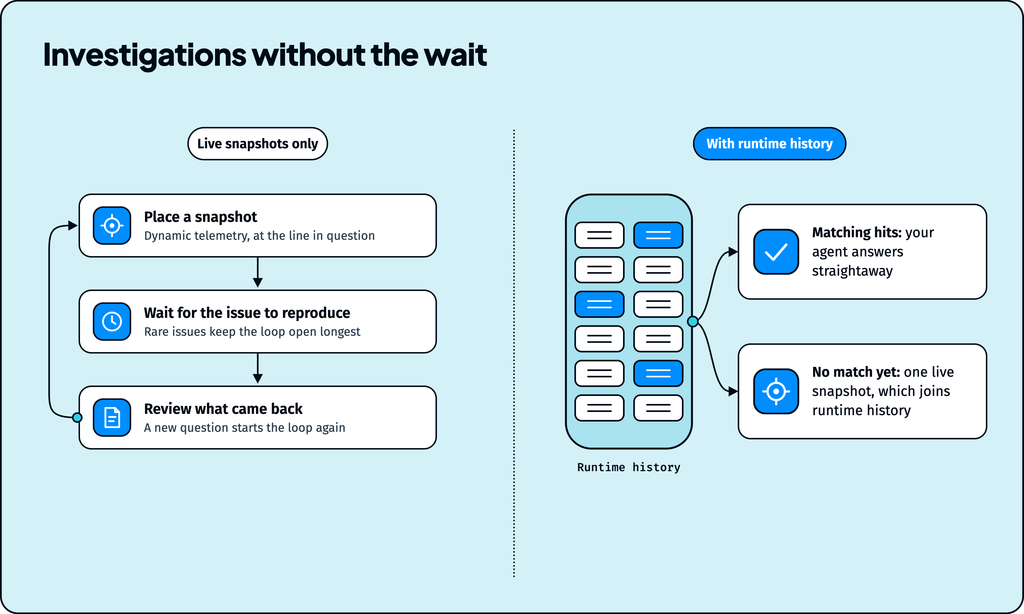
With runtime history, when your agent asks the question, the data is often already there. The snapshots your team captured weeks ago are ready to answer it, so your agent responds straightaway using real production evidence of actual behavior. Any value those snapshots captured is there to query.
You can ask about the values a function received, the path a request took, and the state behind a decision, anywhere your team has captured snapshots:
- “Why did this request fail for one user and succeed for another?”
- “What response times did checkout return for enterprise customers yesterday?”
- “Which user actions led to this error?”
When runtime history doesn’t hold an answer yet, your agent places a live snapshot in the same workflow, and that data joins runtime history for the next investigation. When multiple teams work on the same service, each builds on the others’ evidence: the snapshot one engineer placed to chase a pricing bug becomes evidence for the next agent that touches that code.
How do agents use runtime history?
Every investigation follows the same loop: ask runtime history, compare against the baseline, and only go live when more context is needed.
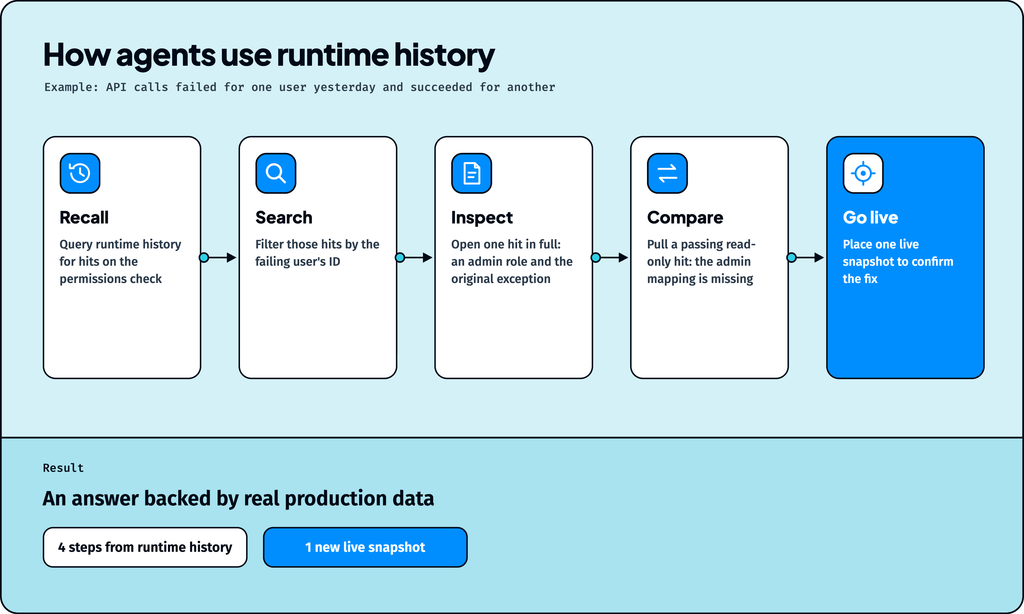
Here’s how it plays out when a developer asks their coding agent why API calls failed for one user yesterday but succeeded for another:
- Recall. The agent reads the service’s error log and sees yesterday’s API failures cluster around one user. It queries the existing runtime history: the permissions check behind those calls has hits from the same hour.
- Search. It filters those hits by captured value, the failing user’s ID, and finds the hits for the failed requests.
- Inspect. It opens one of those hits in full to check the user’s role. It sees he was an admin, a role the permission mapping doesn’t cover. The stack trace in that hit shows the original exception, which the API hid behind a generic error.
- Compare. It pulls a hit from a user whose calls succeeded: that user’s authority was read-only, which the mapping handles. The difference points to the missing admin mapping as the likely cause.
- Go live. With the cause in view, the agent places one targeted live snapshot to confirm its fix behaves as expected.
The result is an answer backed by real production data, with just one new snapshot placed to check the fix.
Because runtime history checks whether the code has changed since each hit was captured, agents work from evidence that matches the code you’re running today. An empty result simply means no stored hit matched the query, so the agent places a live snapshot to check.
When something breaks, the baseline is already there
When something fails in production, a recent change is often the culprit. Earlier hits on the same code give the agent a baseline of how it behaved before the change, and filters by repository, commit, source location, time range, or captured value let it compare old and new behavior precisely before confirming with a live snapshot.
Runtime-aware development: the same history helps agents build
The same history pays off when agents write code. Because runtime history keeps every value a snapshot captured, your agent can plan and change code with production evidence in hand:
- Writing new code: the agent checks the real objects flowing through the functions it will call, so new code fits the data your system actually handles.
- Changing existing code: it pulls the arguments a method has received and the call paths that led to it.
- Verifying a deployment: what it observes becomes the baseline for the next change.
How does the Runtime Collector work?
The Runtime Collector adds two new components to the Lightrun setup you already have:
- Lightrun agents and the Lightrun Server keep doing their jobs: agents capture snapshot hits, and the Server stores each one.
- The Runtime Collector, a new service, organizes each hit for search.
- A ClickHouse database keeps runtime history searchable for 30, 60, or 90 days.
- Three new MCP tools let any agent use that history:
- query_runtime_history_coverage finds where history exists,
- query_runtime_history_hits searches hits, and
- get_runtime_history_hit retrieves one hit.
Compatible agents discover them from their descriptions, with no prompt changes.
On Lightrun SaaS and Single-Tenant, all of this runs for you. On-prem admins deploy the Runtime Collector and ClickHouse through Helm chart 3.56.0 or later, using the Runtime Collector setup guide. Snapshots, dynamic logs, and metrics work exactly as they always have.
How long is runtime history kept, and who can see it?
Runtime history is on by default and keeps data for 30 days, up from the previous 10. Company Admins can choose 30, 60, or 90 days, or turn collection off for the whole company, which also removes the runtime history tools from your MCP tool list. Every change to retention, permissions, and collection settings is recorded as an audit event.
Queries follow the same access rules as the rest of Lightrun MCP: agents see history only from the agent pools their user or API key can access, and PII redaction applies before any captured value is returned.
Join the Lightrun Evolution: available today
This is the Lightrun Evolution: live runtime context plus runtime history gives your AI coding agents the full picture of your production.
Runtime history is included in the Runtime Sensor you already have. Once you’re on 1.97, reconnect your agent to the Lightrun MCP server and it picks up the new tools, your searchable history will start building.
Get started:
- Read the runtime history docs
- On-prem: deploy the Runtime Collector with the Helm chart guide