Debugging the Java Message Service (JMS) API using Lightrun
Apr 25, 2022
/ Updated: Oct 07, 2026
Lightrun Team
5 mins read
The Java Message Service API (JMS) was developed by Sun Microsystems in the days of Java EE. The JMS API provides us with simple messaging abstractions including Message Producer, Message Consumer, etc. Messaging APIs let us place a message on a “queue” and consume messages placed into said queue. This is immensely useful for high throughput systems – instead of wasting user time by performing a slow operation in real-time, an enterprise application can send a message. This non-blocking approach enables extremely high throughput, while maintaining reliability at scale.
The message carries a transactional context which provides some guarantees on deliverability and reliability. As a result, we can post a message in a method and then just return, which provides similar guarantees to the ones we have when writing to an ACID database.
We can think of messaging somewhat like a community mailing list. You send a message to an email address which represents a specific list. Everyone who subscribes to that list receives that message. In this case, the message topic represents the community mailing list address. You can post a message to it, and the Java Message Service handler can use a message listener to receive said event.
It’s important to note that there are two messaging models in JMS: the publish-and-subscribe model (which we discussed here) and also point-to-point messaging, which lets you send a message to a specific destination.
Let’s go over a quick demo.
A Simple Demo
In order to debug the Java Message Service calls, I’ve created a simple demo application, whose source code can be found here.
This JMS demo is a simple database log API – it’s a microservice which you can use to post a log entry, which is then written to the database asynchronously. RESTful applications can then use this database log API to add a database log entry and without the overhead of database access.
This code implements the main web service:
@RestController
@RequiredArgsConstructor
public class EventRequest {
   private final JmsTemplate jmsTemplate;
   private final EventService eventService;
   private final Moshi moshi = new Moshi.Builder().build();

   @PostMapping("/add")
   public void event(@RequestBody EventDTO event) {
       String json = moshi.adapter(EventDTO.class).toJson(event);
       jmsTemplate.send("event", session ->
               session.createTextMessage(json));
   }

   @GetMapping("/list")
   public List<EventDTO> listEvents() {
       return eventService.listEvents();
   }
}
Notice the event() method that posts a message to the event topic. I didn’t discuss message bodies before to keep things simple, but note that in this case I just pass a JSON string as the body. While JMS supports object serialization, using that capability has its own complexities and I want to keep the code simple.
To complement the main web service, we’d need to build a listener that handles the incoming message:
@Component
@RequiredArgsConstructor
public class EventListener {
   private final EventService eventService;

   private final Moshi moshi = new Moshi.Builder().build();

   @JmsListener(destination = "event")
   public void handleMessage(String eventDTOJSON) throws IOException {
       eventService.storeEvent(moshi.adapter(EventDTO.class).fromJson(eventDTOJSON));
   }
}
The listener is invoked with the JSON string that is sent to the listener, which we parse and send on to the service.
Debugging the Hidden Code
The great thing about abstractions like Spring and JMS is that you don’t need to write a lot of boilerplate code. Unfortunately, message-oriented middleware of this type hides a lot of fragile implementation details that can fail along the way.
This is especially painful in a production scenario where it’s hard to know whether the problem occurred because a message wasn’t sent properly. This is where Lightrun comes in.
You can place Lightrun actions (snapshots, logs etc.) directly into the platform APIs and implementations of messaging services. This lets us determine if message selectors are working as expected and whether the message listener is indeed triggered.
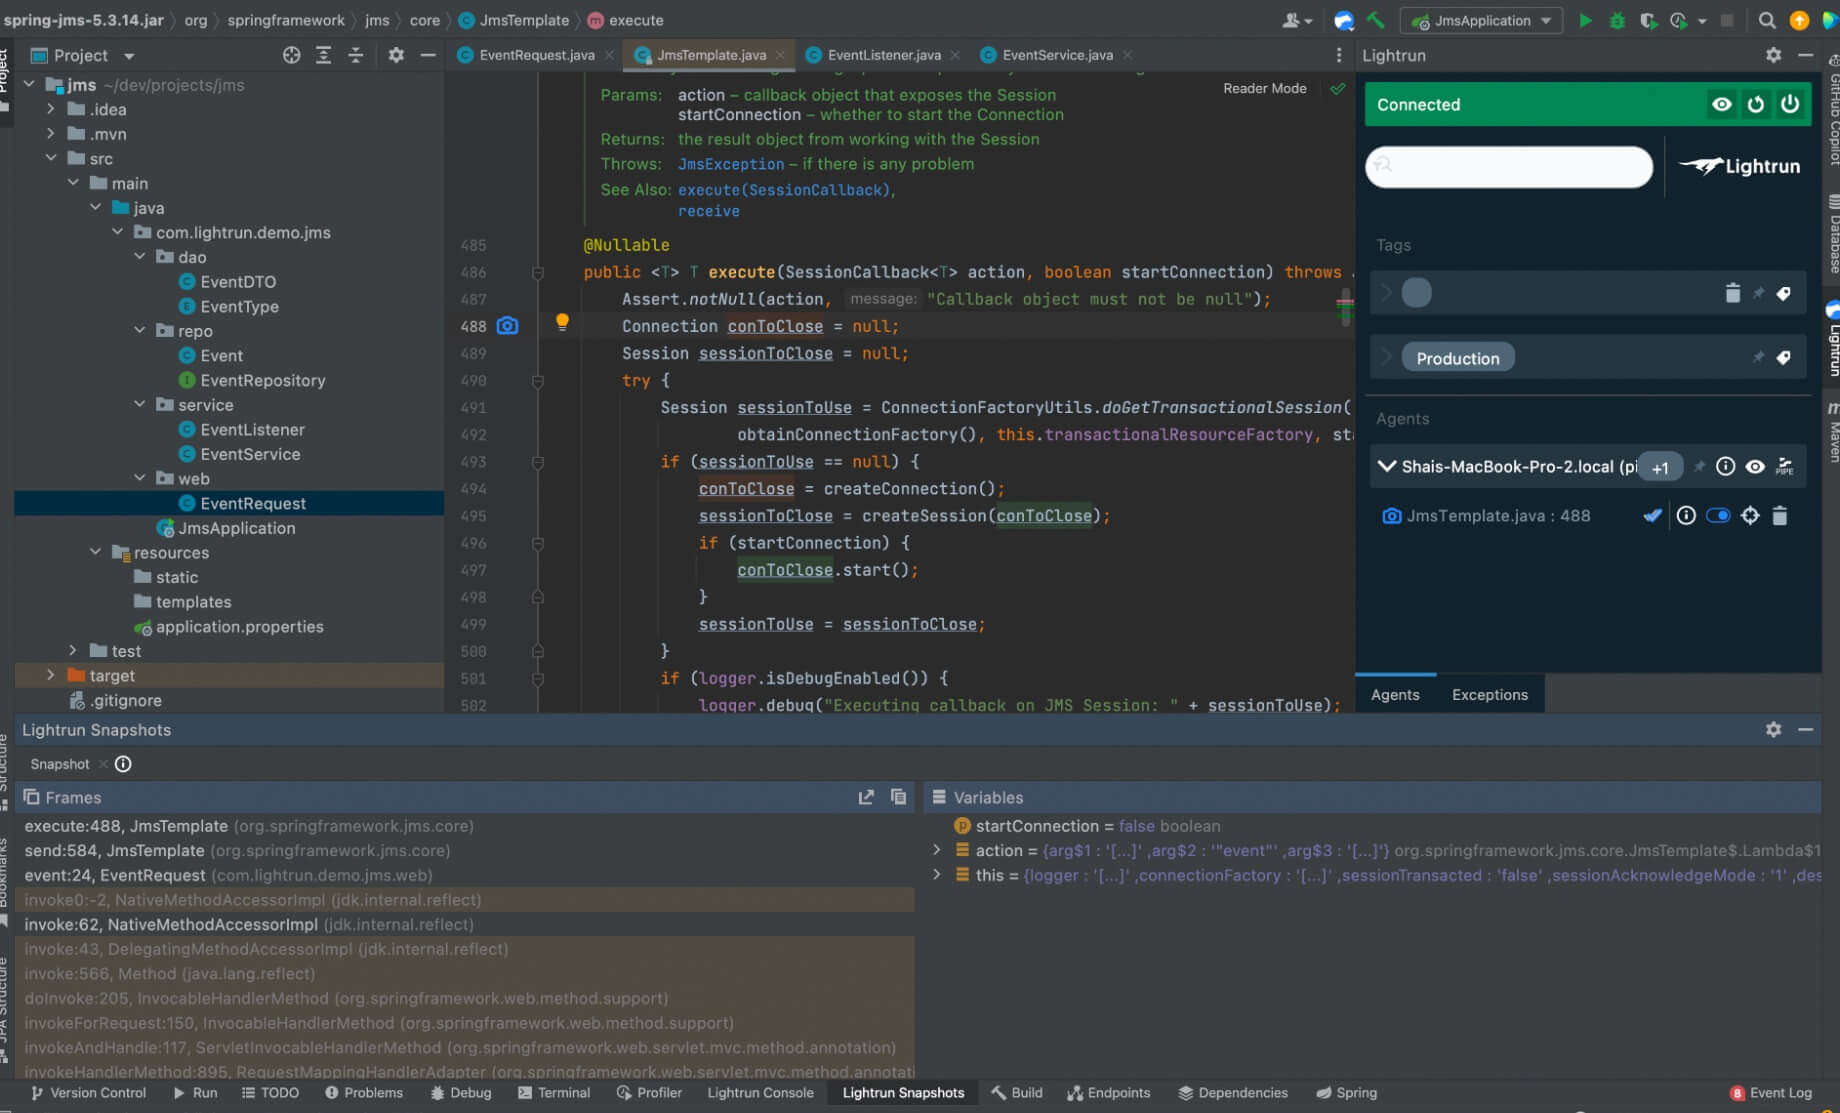
With Spring with JMS support as shown above, we can open the JmsTemplate and add a snapshot to the execute method:
As you can see, the action is invoked when sending to a topic. We can review the stack frame to see the topic that receives the message and use conditions to narrow down the right handler for messages.
We can place a matching snapshot in the source of message so we can track the flow. E.g. a snapshot in EventRequest can provide us with some insight. We can dig in the other direction too.
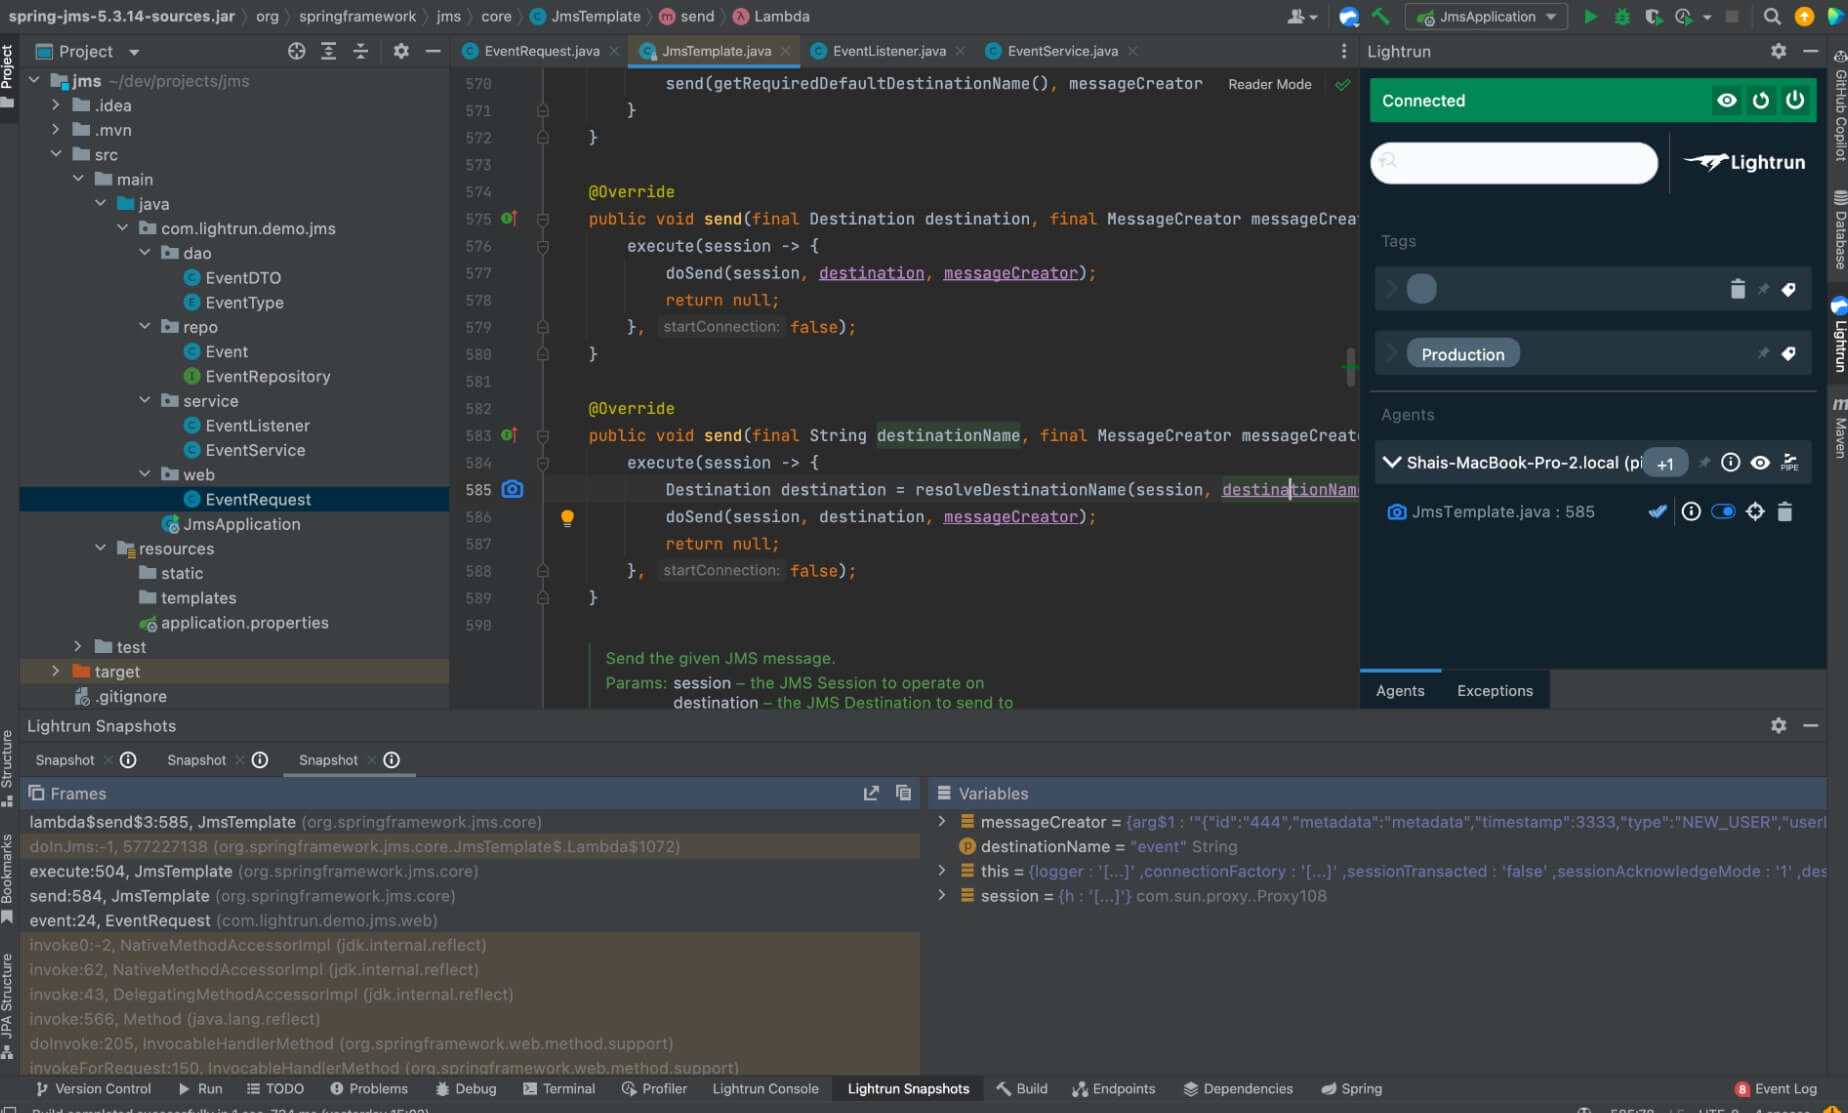
In the stack above, you can see that the execute method is invoked by the method send at line 584. The execute method wraps the caller so the operation will be asynchronous. We can go further down the stack by going to the closure and placing a snapshot there:
Notice that here we can place a condition on the specific topic and narrow things down.
Summary
We pick messaging systems to make our application reliable. However, enterprise messaging systems are very hard to debug in production, which works against that reliability. We can see logs in the target of messages, but what happens if we did not reach it?
With Lightrun, we can place actions in all the different layers of messaging-based applications. This helps us narrow down the problem regardless of the messaging standard or platform.
Black Friday, the traditional kickoff to the holiday shopping season, is set to make waves in 2024 with projected sales reaching an impressive $10.8 billion—a 9.9% increase from last year according to Statistics.blackfriday analysts. According to the same team, Cyber Monday sales in 2024 are expected to reach $13.2 billion—a 6.1% increase from 2023.
Both events in sum are expected to generate $24 billion in sales. A major contributor to this growth is the increasing number of consumers who prefer to shop online. As consumer behaviors evolve to favor online shopping, retailers are expected to invest more in their online infrastructure, user experience, and platform reliability to meet this projected demand.
More traffic means more potential revenue, but it also means more queries, more transactions, and more potential problems. As an online retailer, you need to be well-prepared from a technical standpoint to ensure that you don’t miss out on any potential sales.
Amazon Prime Day 2018: A Prime Example For How Things Can Go Wrong
Q4 is a critical time for businesses, and developers are often under immense pressure to ensure that their systems are up and running. The last thing you want is for your website to crash during the busiest shopping season of the year. Poor performance means lost revenue, and problems can quickly escalate into a PR nightmare.
You’ve likely heard about the infamous Amazon Prime Day crash in 2018, which reportedly cost the company an estimated $100 million in lost sales. Despite the charm of the “Dogs of Amazon” error pages, they couldn’t mitigate the damage. Cute error messages are no substitute for a robust, well-prepared platform.
Some unofficial post-mortems of the Prime Day crash suggest that the root cause was a failure in the auto-scaling system, which left Amazon scrambling to manually add server capacity. The internal system “Sable,” Amazon’s e-commerce storage and computation platform, struggled under the surge—which led to a failure across the platform. Some experts speculate that misconfigurations or software bugs in scaling systems magnified the issue, forcing Amazon to temporarily shut down international traffic to the site according to CNBC.
In all cases, the lesson is clear: impredictable issues can arise, and you need to be prepared.
If you google “How to prepare for Black Friday for developers,” you’ll find a plethora of articles that will tell you to “test your system,” “monitor it,” “add autoscalability to your infrastructure,” and “secure your code.” While these may be good pieces of advice, they touch only the surface of the problem as they are not shifting left enough to prevent the issues from happening in the first place.
In sports, for example, achieving peak performance isn’t the result of a single training session but rather a dedicated regimen of practice, evaluation, and adjustment over time. Similarly, preparing for Black Friday is not a one-time event, but rather a continuous process that requires iterative improvements based on feedback. The earlier this feedback is received, the better.
Shift-Left Everything: The Early Bird Catches the Worm
Performance should be a first-class citizen in your development process. That’s why it should not be an afterthought, but rather a core part of your development cycle. A software development lifecycle includes several stages, such as planning, coding, testing, and deployment. You should be thinking about performance from the early stages of development. The problem is that performance testing is often associated with the staging and production environments—which is too late in the development cycle.
By shifting performance testing to the left, you can identify and fix performance issues early in the development process. This approach allows you to catch performance bottlenecks before they become critical issues.
Performance problems can be triggered by a variety of factors, such as bad capacity planning, downsized infrastructure, inefficient code, slow database queries, extreme edge cases, or code that doesn’t scale well. All these issues can be identified early in the SDLC if you have the right tools and processes in place.
For example, with Lightrun, you can dynamically add a log to a specific function suspected of causing slow database queries, without halting or redeploying the application. This enables you to pinpoint the exact query, analyze its execution time, and resolve the issue during the development phase, long before it reaches staging or production.
Using Lightrun’s snapshot feature, you can also capture the state of your application at a specific point in time. Let’s say you have an issue that only occurs under certain conditions (e.g., a specific event or input). You can capture the state of your application after reproducing the issue using a snapshot that can be added directly from the Lightrun IDE plugin. This snapshot not only captures the trace of the application but also the state of the variables at that point in time. This allows you to deeply analyze the issue from the inside and fix it accordingly. You can also export the snapshot and share it with your team members for further analysis. All of this happens from the comfort of your IDE while you’re coding. The best part is that you capture logs and traces from any environment, including your development, testing, staging, and production environments without any code changes on the remote server.
Another crucial, often overlooked practice you should consider is observability.
Observability is the ability to understand what’s happening inside your system based on external outputs. An e-commerce platform is responsible for different types of operations, including user authentication, product search, transaction processing, and more. Observability allows you to monitor these operations and understand how they are performing from the user’s perspective. Using logs, metrics, and traces, developers can gain useful and actionable understanding of their applications’ and infrastructure’s behavior.
Nowadays, observability is a key practice, but its implementation is often not quite right in many organizations. First, not understanding what to “observe” can lead to a lot of noise and irrelevant data – a sheer volume of data makes it challenging to identify the root cause of a problem. Second, observability is often associated with the production environment, which is a late phase in the SDLC. The first problem creates a siloed approach to observability where developers are less likely to use the data to improve their code. The second problem leaves developers out of the loop when it comes to understanding how their code behaves in production.
Instead of this approach, observability should be a part of the development process from the beginning. But here’s the catch: if developers have to wait for a new deployment on the testing or staging environment to add a log or a metric, a new bottleneck is created. A solution to this, besides having a continuous deployment pipeline, is to use a tool that allows them to instrument their code on the fly without the need to redeploy their applications. This is also known as “dynamic instrumentation” and it’s a key feature of Lightrun.
According to a 2018 Stripe report, developers spend an average of 17.3 hours per week on maintenance and debugging issues. This amounts to $300 billion in lost developer productivity every year. By shifting left observability, performance testing, and debugging, you can reduce this number and save valuable time and resources.
Debugging in Production: No Longer a Meme
Shifting left observability, performance testing, and debugging is the secret sauce to a successful Black Friday. Small incremental changes with continuous feedback and early feedback are the ingredients to a successful recipe. However, incidents can still happen, and when they do, you need to be able to debug in production as close to the problem as possible.
Some years ago when someone mentioned “debugging in production“, it was often seen as a joke or the worst-case scenario. Today, it’s a regular practice for many organizations. The reason is simple: the production environment is the most complex and the most realistic environment. If a bug or a performance issue escapes your team despite all the early stages of testing, the early feedback, and the continuous improvement, you need to be able to debug it in production. Chances are that the issue is an edge case that only occurs in production.
Traditionally, debugging in production was a scary and unsafe process. The fastest way to do it was SSHing into the server and adding a print statement in the code. This is not only unsafe but also inefficient. It’s unsafe because you’re modifying the code in the production environment, which can lead to unexpected results. It’s inefficient because you need to redeploy the application to see the changes, which can take time and may disrupt the user experience.
Here’s when Lightrun once again comes to the rescue. A developer can add a line of log to the code in the live production environment without halting the application or redeploying it. Imagine the following scenario: you have a performance issue that only occurs in production. You can add a log to the suspected function or line of code, capture the logs, and analyze them in real-time to identify the root cause of the problem. Similarly, you can add a snapshot to capture the state of the application at a specific point in time and under specific conditions.
All you have to do is to install the Lightrun plugin in your IDE – available for IntelliJ, PyCharm, WebStorm, VS Code and select web IDEs – connect it to your production environment, and start debugging. It’s that simple.
Reduce the Mean Time to Resolution (MTTR)
It may be too late to prevent all performance issues from happening, but you can still reduce the time it takes to resolve them. The Mean Time to Resolution (MTTR) is a key KPI that measures the average time it takes to resolve an issue. The longer it takes to resolve an issue, the more revenue you lose.
To understand how to calculate the MTTR, let’s consider the following formula:
MTTR = (Total time to resolve issues) / (Total number of repairs
If you have a high MTTR, it means that you’re spending too much time resolving issues. Serious engineering teams aim to reduce the MTTR as much as possible. In general, there’s no good or bad value for the MTTR; this depends on the context of the organization, the criticality of the application, and the complexity of the issues. But as a rule of thumb, if your team is spending more than 3 hours per issue, you may want to consider improving your processes. This is especially true during Black Friday when every minute counts. According to ECDB, as an example, online shopping peak hours in some countries (e.g., Germany, UK) are between 8 pm and 10 pm. If your MTTR is 3 hours and your application crashes at 8 pm, your team will only start to resolve the issue at 11 pm. This means that you were down during all the peak hours.
Lightrun can help you reduce your MTTR. For example, Lightrun capabilities have enabled InsideTracker developers to diagnose and resolve application issues in real-time, saving valuable debugging time. Their MTTR improved by 50%, resulting in dozens of hours saved each month. Prior to using Lightrun, InsideTracker developers were unable to troubleshoot or access remote Kubernetes environments from their local machines in an easy, straightforward way. This led to long and inefficient debugging sessions that required hotfixes and redeployments taking hours.
What’s Next?
Lightrun provides a suite of powerful features that help developers quickly identify and resolve issues in production environments but before reaching production, Lightrun can also help you shift-left observability, testing, and debugging.
The tool offers a range of features that can help you improve your development process, including:
Live debugging: Developers can add logging statements and metrics to their code in real-time, without having to redeploy or restart their applications.
On-demand snapshots: Lightrun Snapshots provide virtual breakpoints but without stopping the execution of your application. You can add conditions, evaluate expressions and inspect any code.
Custom metrics: Right from the IDE, developers can create custom metrics to track specific aspects of the system’s behavior, such as response time or error rates. All tasks are completed without the need to redeploy any code.
Integration with existing developers and enterprise tools: Lightrun integrates with existing cloud-native tools, such as Prometheus, Grafana, VSCode, public cloud providers, and more, making it easy to integrate into existing workflows.
Lightrun empowers not only developers but also DevOps, SREs, Platform Engineers, and other stakeholders to improve their development process and as a result, catch issues early, reduce the MTTR, and improve the overall performance of their applications.
Ready for Black Friday 2024? If not, Lightrun is here to help:
Get a Lightrun demo and learn how to easily debug microservices, Kubernetes, Docker Swarm, ECS, Big Data, serverless, and more: https://lightrun.com/get-a-lightrun-demo/