10 Best Java Linters and Static Analysis Tools
Feb 25, 2026 / Updated: Oct 08, 2026

If you’re choosing Java static analysis tools for a Maven or Gradle build, you need more than one. Java linters check style, bug finders read bytecode for defect patterns, and security scanners trace tainted data. Here are the 10 most useful Java linters and static analysis tools in 2026, what each one catches, and the combinations that hold up in CI.
Key takeaways
- Most Java teams run three layers of static analysis: a formatter, a style checker and a bug finder, all enforced in the build.
- Checkstyle and google-java-format cover style; SpotBugs, Error Prone and PMD cover bug patterns; NullAway targets NullPointerExceptions at compile time.
- SonarQube for IDE (formerly SonarLint) and IntelliJ IDEA inspections give feedback as you type; Qodana runs the same JetBrains inspections in CI.
- ArchUnit and Semgrep extend static analysis to architecture rules and security patterns.
- Static analysis reads the code; runtime evidence from the running service shows how that code behaves with real data and traffic.
What is a Java linter?
A Java linter is a static analysis tool that checks source code against a set of rules before the code runs. It flags style violations, suspicious constructs and common bug patterns, so reviewers spend their time on design and logic.
Linters work on the text or syntax tree of your .java files. They answer questions like: Is this method too long? Is this switch missing a default? Does this class follow the team’s naming convention? Because they run in milliseconds, they fit naturally into the IDE, a pre-commit hook and every CI build.
In Java, the term “linter” is used loosely. Developers searching for a Java linter usually want any tool that catches problems early, from formatting through null safety to security.
Java linters vs static analysis vs SAST
Linting is one layer of static analysis, and SAST (static application security testing) is the security-focused layer. Each reads code at a different depth and catches a different class of problem.
| Layer | Reads | Catches | Example tools |
| Formatting | Source text | Indentation, import order, line length | google-java-format, Spotless |
| Linting | Source / syntax tree | AI agent writes field.set(request, “true”) without knowing highValue is a primitive boolean at runtime | Checkstyle, PMD |
| Bug-pattern analysis | Bytecode or compiler AST | Null dereferences, broken equals/hashCode, concurrency mistakes |
SpotBugs, Error Prone, NullAway |
| Architecture rules | Compiled classes | Forbidden package and layer dependencies | ArchUnit |
| SAST | Data flow across methods | Injection, unsafe deserialization, hard-coded secrets | Semgrep, CodeQL |
Each tool covers one or two of these rows, so a healthy Java build combines several.
Java static analysis tools compared
Checkstyle, SpotBugs and Error Prone form the most common open source core; the other seven add IDE feedback, null safety, formatting, architecture checks and security scanning.
Tool
Type
Analyzes
Catches
Example tools
Checkstyle
Linter
Source
Maven, Gradle, IDE plugins
Enforcing a coding standard
PMD
Linter + copy-paste detector
Source
Maven, Gradle, IDE plugins
Code smells and duplicated code
SpotBugs
Bug finder
Bytecode
Maven, Gradle, IDE plugins
Defect patterns in compiled classes
Error Prone
Compiler plugin
javac AST
javac via Maven or Gradle
Failing the build on bug patterns
NullAway
Compiler plugin
javac AST
Error Prone
Preventing NullPointerExceptions
SonarQube for IDE
IDE analyzer
Source
IntelliJ, VS Code, Eclipse, Visual Studio
Real-time feedback while coding
IntelliJ inspections / Qodana
IDE + CI analyzer
Source
IntelliJ IDEA, CI
JetBrains-based teams
google-java-format / Spotless
Formatter
Source text
Gradle, Maven, IDE
Ending formatting debates
ArchUnit
Architecture tests
Bytecode
JUnit
Enforcing layer boundaries
Semgrep
SAST
Source patterns + data flow
CLI, CI
Security rules and custom patterns
The 10 best Java linters and static analysis tools
The list runs from style enforcement through bug detection to security, so pick one tool per layer.
1. Checkstyle
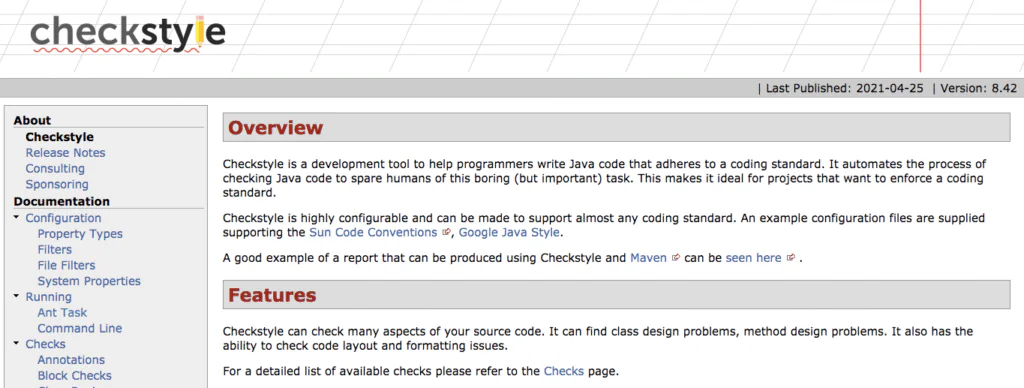
Checkstyle is the most widely used Java linter for enforcing a coding standard. It ships with two ready-made configurations, google_checks.xml (Google Java Style) and sun_checks.xml (Sun conventions), and every rule is configurable in XML.
It catches naming violations, missing Javadoc, oversized methods, magic numbers and import problems. Add it to a Maven build so violations fail the build:
<plugin>
  <groupId>org.apache.maven.plugins</groupId>
  <artifactId>maven-checkstyle-plugin</artifactId>
  <version>3.6.0</version>
  <configuration>
    <configLocation>google_checks.xml</configLocation>
    <violationSeverity>warning</violationSeverity>
    <failOnViolation>true</failOnViolation>
  </configuration>
  <executions>
    <execution>
      <phase>validate</phase>
      <goals><goal>check</goal></goals>
    </execution>
  </executions>
</plugin><plugin>
  <groupId>org.apache.maven.plugins</groupId>
  <artifactId>maven-checkstyle-plugin</artifactId>
  <version>3.6.0</version>
  <configuration>
    <configLocation>google_checks.xml</configLocation>
    <violationSeverity>warning</violationSeverity>
    <failOnViolation>true</failOnViolation>
  </configuration>
  <executions>
    <execution>
      <phase>validate</phase>
      <goals><goal>check</goal></goals>
    </execution>
  </executions>
</plugin>
<plugin>
  <groupId>org.apache.maven.plugins</groupId>
  <artifactId>maven-checkstyle-plugin</artifactId>
  <version>3.6.0</version>
  <configuration>
    <configLocation>google_checks.xml</configLocation>
    <violationSeverity>warning</violationSeverity>
    <failOnViolation>true</failOnViolation>
  </configuration>
  <executions>
    <execution>
      <phase>validate</phase>
      <goals><goal>check</goal></goals>
    </execution>
  </executions>
</plugin>
Best for: teams that want one enforced style across every repository.
2. PMD
PMD is a rule-based source analyzer that finds code smells: unused variables, empty catch blocks, overcomplicated expressions and needless object creation. PMD 7 rewrote much of the engine and supports Java alongside Apex, Kotlin, JavaScript and other languages.
It also bundles CPD (the copy-paste detector), which finds duplicated blocks across a codebase. Duplicates are often where a fix lands in one copy and misses the other.
Best for: cleaning up maintainability problems that Checkstyle’s style rules leave alone.
3. SpotBugs
SpotBugs is the successor to FindBugs. It analyzes compiled bytecode against more than 400 bug patterns, including null dereferences, infinite loops, misused concurrency primitives and resource leaks.
Because it reads bytecode, it sees what the compiler actually produced. A classic catch:
public final class InvoiceId {
    private final String value;

    @Override
    public boolean equals(Object o) {
        return o instanceof InvoiceId other && value.equals(other.value);
    }
    // SpotBugs HE_EQUALS_NO_HASHCODE: equals() without hashCode()
    // breaks HashMap and HashSet lookups for InvoiceId keys.
}
The Find Security Bugs plugin extends SpotBugs with security detectors.
Best for: catching real defects in compiled code, especially in older codebases.
4. Error Prone
Error Prone is Google’s compiler plugin that turns common Java mistakes into compile errors. It hooks into javac, so problems surface the moment someone builds, with a suggested fix attached.
Typical catches include comparing arrays with ==, ignoring the return value of an immutable method such as String.trim(), and format strings that do not match their arguments.
Best for: teams that want bug patterns blocked at compile time rather than flagged in a report.
5. NullAway
NullAway, built at Uber, is an Error Prone plugin that prevents NullPointerExceptions at compile time. It treats every reference as non-null unless it is annotated @Nullable, then checks that nullable values are guarded before use.
It runs as part of Error Prone in Gradle:
import net.ltgt.gradle.errorprone.CheckSeverity

plugins {
    id "java"
    id "net.ltgt.errorprone" version "4.1.0"
}

dependencies {
    errorprone "com.google.errorprone:error_prone_core:2.36.0"
    errorprone "com.uber.nullaway:nullaway:0.12.3"
}

tasks.withType(JavaCompile).configureEach {
    options.errorprone {
        check("NullAway", CheckSeverity.ERROR)
        option("NullAway:AnnotatedPackages", "com.acme.billing")
    }
}
Best for: services where NullPointerExceptions are the most common production error.
6. SonarQube for IDE (formerly SonarLint)
SonarQube for IDE is a free IDE extension that analyzes Java as you type and explains each issue in the editor. Sonar renamed SonarLint to SonarQube for IDE in late 2024; the product and its rules carried over.
It runs in IntelliJ IDEA, VS Code, Eclipse and Visual Studio. In connected mode, it syncs rules and quality profiles from SonarQube Server or SonarQube Cloud, so developers see the same issues locally that the CI gate will report.
Best for: shortening the loop between writing a bug and hearing about it.
7. IntelliJ IDEA inspections and Qodana
If you search for an IntelliJ Java linter, the answer is already installed: IntelliJ IDEA ships hundreds of Java inspections that highlight problems in the editor, from probable bugs to redundant code, with quick fixes attached.
Qodana, also from JetBrains, runs those same inspections in CI and publishes a report, so the rules a developer sees in the IDE become a build gate.
[SCREENSHOT: IntelliJ IDEA inspection highlighting a probable NullPointerException with its quick fix]
Best for: teams standardized on JetBrains IDEs.
8. google-java-format and Spotless
google-java-format reformats Java source to Google Java Style with no configuration options, which is the point: formatting stops being a review topic. Spotless, from DiffPlug, is the Gradle and Maven plugin that applies it (or palantir-java-format, Eclipse and others) and checks it in CI.
plugins {
    id "com.diffplug.spotless" version "7.0.2"
}

spotless {
    java {
        googleJavaFormat()
        removeUnusedImports()
    }
}
Run ./gradlew spotlessApply locally and ./gradlew spotlessCheck in CI.
Best for: teams that want formatting automated and out of pull request comments.
9. ArchUnit
ArchUnit checks architecture rules as ordinary JUnit tests. It reads compiled classes and fails the test when code crosses a boundary the team agreed on, such as a web controller calling a repository directly.
@AnalyzeClasses(packages = "com.acme.billing")
class LayeringRulesTest {

    @ArchTest
    static final ArchRule controllersUseServicesOnly =
        noClasses().that().resideInAPackage("..web..")
            .should().dependOnClassesThat().resideInAPackage("..persistence..");
}
Best for: keeping a growing codebase’s layers and modules intact.
10. Semgrep
Semgrep is a pattern-based static analysis engine with Java support and a large public rule registry, much of it security-focused. Rules look like the code they match, so writing a custom rule for an internal API takes minutes.
It covers the SAST layer: SQL injection, unsafe deserialization, weak crypto and hard-coded secrets. GitHub’s CodeQL is the main alternative for teams on GitHub Advanced Security.
Best for: adding security scanning and organization-specific rules to the same pipeline.
How to combine Java code quality tools in CI
Run the fast, deterministic checks first and the deeper analysis after, so developers get the cheapest feedback earliest. A typical Maven or Gradle pipeline looks like this:
- In the IDE: SonarQube for IDE or IntelliJ inspections flag issues as code is written.
- Pre-commit or first CI step: Spotless with google-java-format checks formatting in seconds.
- Compile: Error Prone and NullAway run inside
javacand fail the build on bug patterns and null risks. - Verify phase: Checkstyle enforces the style guide; SpotBugs and PMD analyze the compiled classes and source.
- Test phase: ArchUnit rules run with the unit tests.
- Security gate: Semgrep or CodeQL scans the pull request for injection and secrets.
Start each tool with a baseline of existing issues and fail only on new ones, so adoption does not stall on legacy debt. And keep the rule sets in a shared repository or parent POM, so every service enforces the same standard.
Once code passes every gate, the remaining questions are about behavior: what it does with production data, traffic and configuration. That is the job of runtime evidence from the live service.
Where static analysis ends: the runtime gap
Static analysis judges Java code by what it says; production behavior depends on what the code receives. Bugs that live in real payloads, traffic patterns and configuration pass every linter, because the defect is in the data path.
Here is a method that passes Checkstyle, PMD, SpotBugs, Error Prone and NullAway cleanly:
public BigDecimal discountFor(Customer customer, Order order) {
    // Clean under every static check.
    // In production, a partner feed sends tier codes with a trailing space ("GOLD "),
    // so the lookup misses and partner customers silently fall back to STANDARD pricing.
    Tier tier = tierCache.getOrDefault(customer.getTierCode(), Tier.STANDARD);
    return order.subtotal().multiply(tier.discountRate());
}| Question | Static analysis | Runtime evidence |
|---|---|---|
| Does the code follow the rules? | Answers it | Not needed |
What value did getTierCode() return for this customer? |
Outside its scope | Captured at the line |
| Which requests hit the fallback branch? | Outside its scope | Counted with a dynamic metric |
| Why did this method slow down under load? | Outside its scope | Snapshot taken when latency crosses a threshold |
The usual way to answer those questions is to add log lines, open a pull request, wait for review and deploy, then hope the failure happens again. Lightrun shortens that loop to one session. With the Lightrun Runtime Sensor, you add a dynamic log or snapshot at the exact line in the running JVM from IntelliJ, and see the real value of customer.getTierCode() in seconds, without a redeploy. For latency problems, snapshots can fire automatically when a method’s execution time crosses a threshold you set.
The same Runtime Context reaches AI coding agents through Lightrun’s MCP server, so tools like Cursor and Claude Code can check the Java they generate against live behavior before it ships.
Static analysis keeps the codebase clean, and Runtime Context shows how that code behaves in production; together they cover the path from commit to customer.
Learn how to power AI coding agents with runtime context
FAQ
Checkstyle is the most widely used Java linter for enforcing a coding standard, and most teams pair it with SpotBugs or Error Prone for bug patterns. Those tools validate code before it ships; teams running Java in production add the Lightrun Runtime Sensor to validate how that code behaves once it is live.
Java linters enforce a consistent coding style, flag code smells and catch common mistakes before code is merged. They cover the code as written. For how that code behaves with real data and traffic, engineers use Runtime Context: live evidence captured from the running service at the exact line in question.
Checkstyle checks source code against style and formatting rules, PMD finds code smells and duplicated code, and SpotBugs analyzes compiled bytecode for bug patterns such as null dereferences and broken equals/hashCode contracts. All three read code at rest. Lightrun reads the same code in motion, capturing variable values and execution paths from the running JVM.
Yes. IntelliJ IDEA includes hundreds of Java inspections that highlight problems as you type, and JetBrains Qodana runs the same inspections in CI. Lightrun’s IntelliJ plugin adds the runtime side to the same editor: dynamic logs, snapshots and metrics on a live Java service, placed from the IDE without a redeploy.
Add instrumentation to the running JVM instead of the codebase. With the Lightrun Runtime Sensor, engineers place dynamic logs, snapshots and metrics on any line of a live Java service from IntelliJ or VS Code, read real values in seconds, and remove them when done, while the service keeps running. Snapshots can also fire automatically when a method’s latency crosses a threshold you set.
Static analysis checks agent-generated code against rules; checking it against real behavior takes Runtime Context. Lightrun’s MCP server lets Cursor, Claude Code and other MCP-compatible agents request runtime evidence from the live service and verify a change before it ships.