What is Kubernetes Lens?
Nov 08, 2021 / Updated: Mar 10, 2026
As a DevOps Engineer, one day you’re performing magic in the terminal, settling clusters, and feeling like a god. On some other days, you feel like a total fraud and scam. Errors and bugs appear from everywhere, you don’t know where to start, and you don’t know where to look. Sadly, days like this come far too often. To be more specific, what often causes these bad days is none other than Kubernetes itself. While Kubernetes is the force and magic that manages your clusters, it can also be your bane.
Kubernetes is a portable, extensible open-source system for automation, deployment, scaling, and management of containerized applications and services. It is a cluster management tool that helps to abstract machines, storage, and networks away from their physical implementation. Almost everyone in the DevOps community uses Kubernetes.
However, one major problem with Kubernetes is that it comes with a vast amount of moving parts and certain complexities, such as handling clusters, scaling, storage orchestration, batch execution, and more. This all hinders mainstream developer adoption.
Another problem with Kubernetes is the use of command-line CLIs that consume and retrieve multiple files, and the use of tools like kubectl that might be good for some, but which can be overwhelming for others who may prefer GUIs.
In this article, you will learn what Kubernetes Lens is, what it does, and why it is useful.
About Kubernetes Lens – The Kubernetes IDE
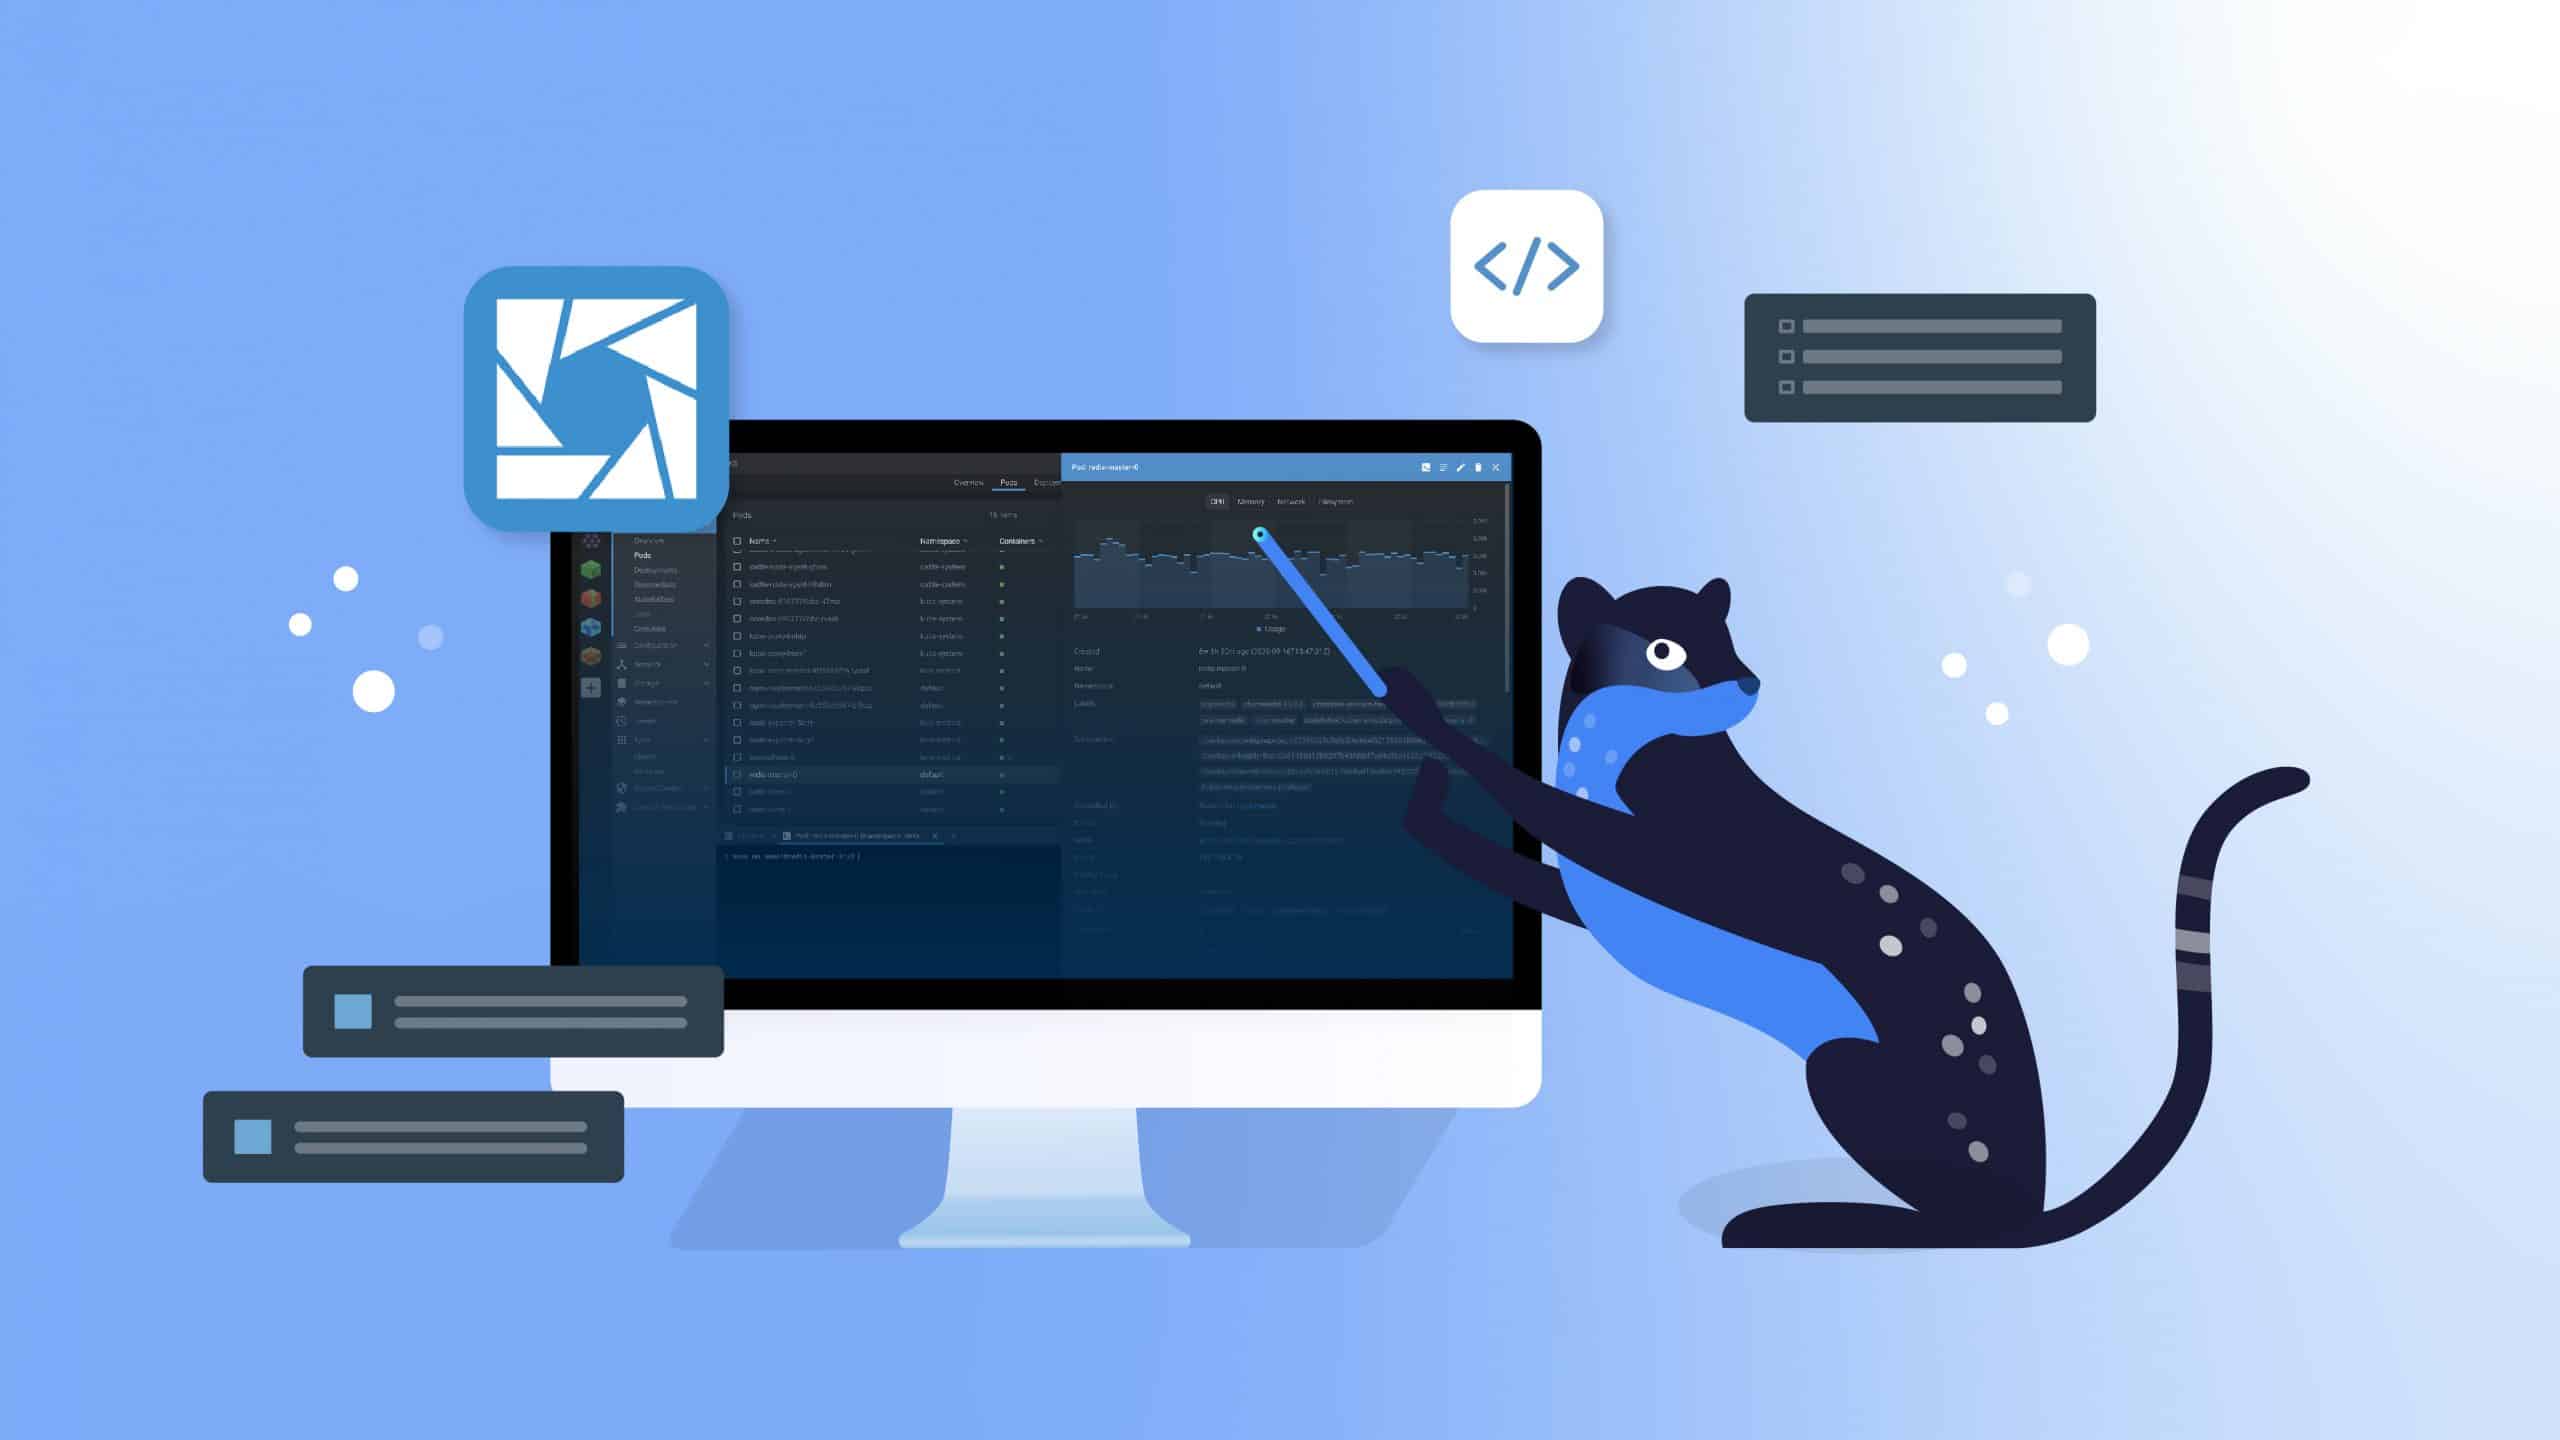
Kubernetes Lens is an effective, open-source IDE for Kubernetes. Lens simplifies working with Kubernetes by helping you manage and monitor clusters in real time. It was developed by Kontena, Inc. and then acquired by Mirantis in 2020, who then open-sourced it and made it available to download for free.
Lens is a standalone application and can be installed on macOS, Windows, and some Linux flavors. With Kubernetes Lens, you can talk to any Kubernetes cluster, anywhere.
Kubernetes Lens is aimed at developers, SREs, and software engineers in general. It is most likely the only platform you will need to manage the cluster system of your Kubernetes. It is backed by a number of Kubernetes and cloud-native ecosystem pioneers such as Apple, Rakuten, Zendesk, Adobe, Google, and others.
Why Kubernetes Lens?
There are a variety of features that make Kubernetes Lens a highly attractive tool. Here is an overview of a few of them.
Cluster Management
Managing clusters in Kubernetes can be difficult, but with Kubernetes Lens, you can work on multiple clusters while maintaining context with each of them. Lens makes it possible to configure, change, and redirect clusters with one click, organizing and revealing the entire working system in the cluster while providing metrics. With this information, you can easily and very quickly edit changes and apply them confidently.
Adding a Kubernetes cluster to Lens is easy. All you need to do is point the local/online kubeconfig file to Lens and it automatically discovers and connects with it.
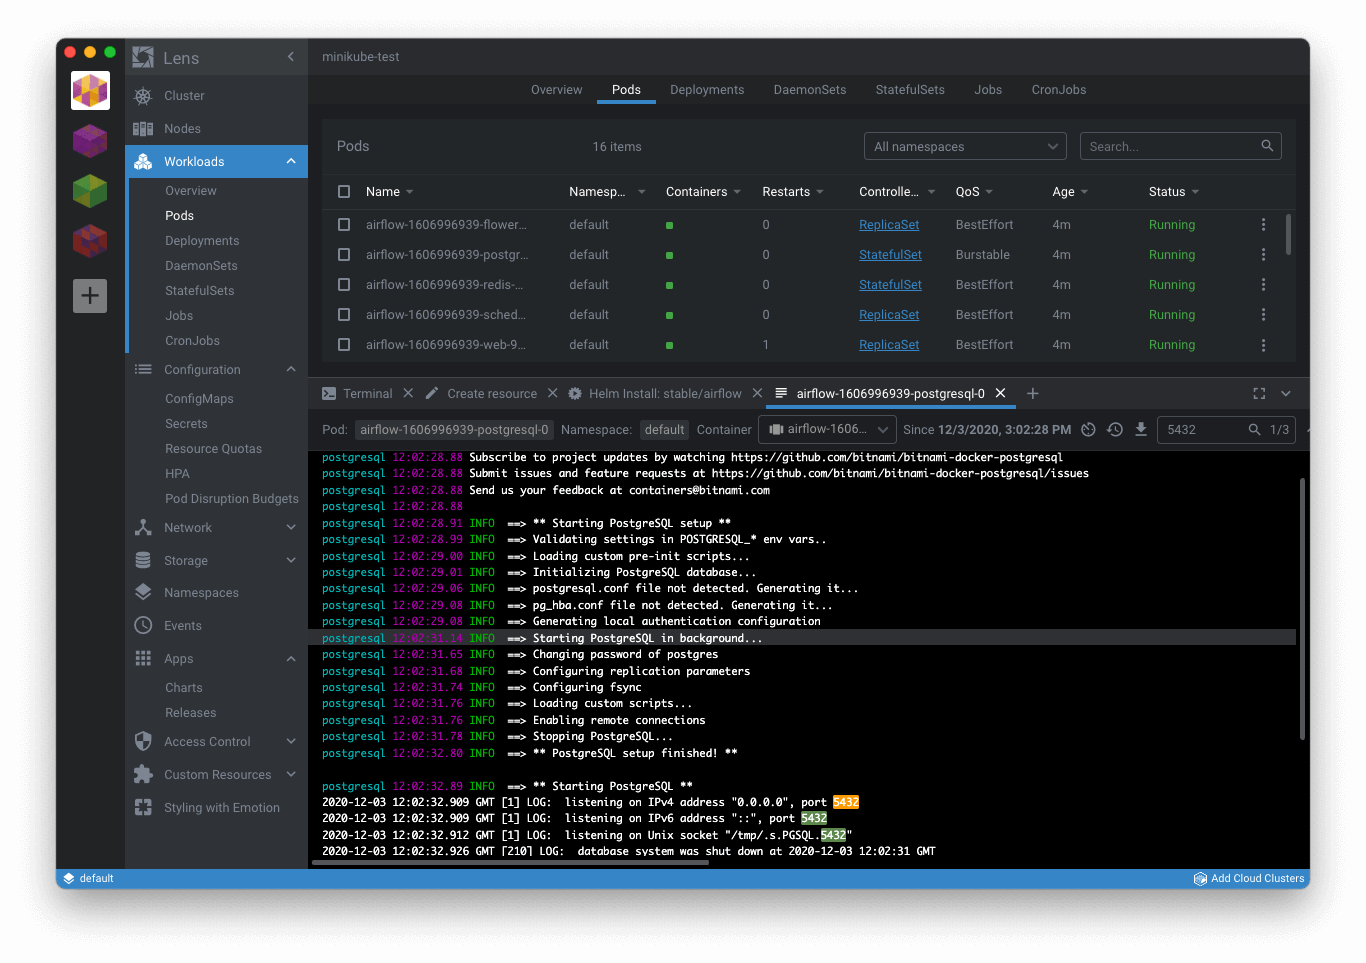
With Lens, you can inspect all the resources running inside your cluster, ranging from simple Pods and Deployments to the custom types added by your applications.
Built-In Visualization and Metrics
Kubernetes Lens comes with a built-in Prometheus setup that has a multi-user feature that gives role-based access control (RBAC) for each user. That means that, in a cluster, users can only access visualizations they have permission to access.
In Lens, when you configure a Prometheus instance, it is able to display metrics and visualizations about the cluster. To add Prometheus to Lens if it is not already installed, follow these steps:
- Right-click on the cluster icon in the upper left corner of the UI.
- Click Settings.
- Under Features, find and select the Metrics stack.
- Then click Install to install Prometheus stack (This may take a couple of seconds or minutes.)

After the installation, Lens autodetects Prometheus for that cluster and then begins to display cluster metrics and visualizations. You can also preview the Kubernetes manifests for Prometheus before you apply them.
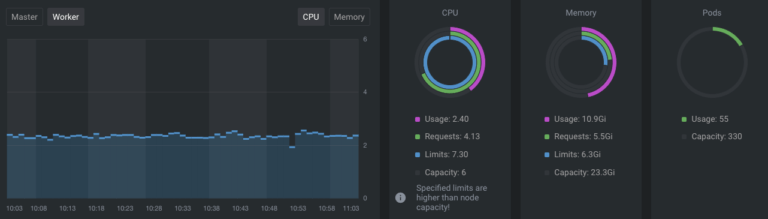
With Prometheus, you get access to real-time graphs, resource utilization charts, and usage metrics such as CPU, memory, network, requests, etc., which are integrated into the Lens dashboard. These graphs and metrics are shown in the context of the particular cluster that is viewed at that moment, in real time.
Kubernetes Lens also integrates with Helm, making it easy to install and manage Helm charts and releases in Kubernetes.
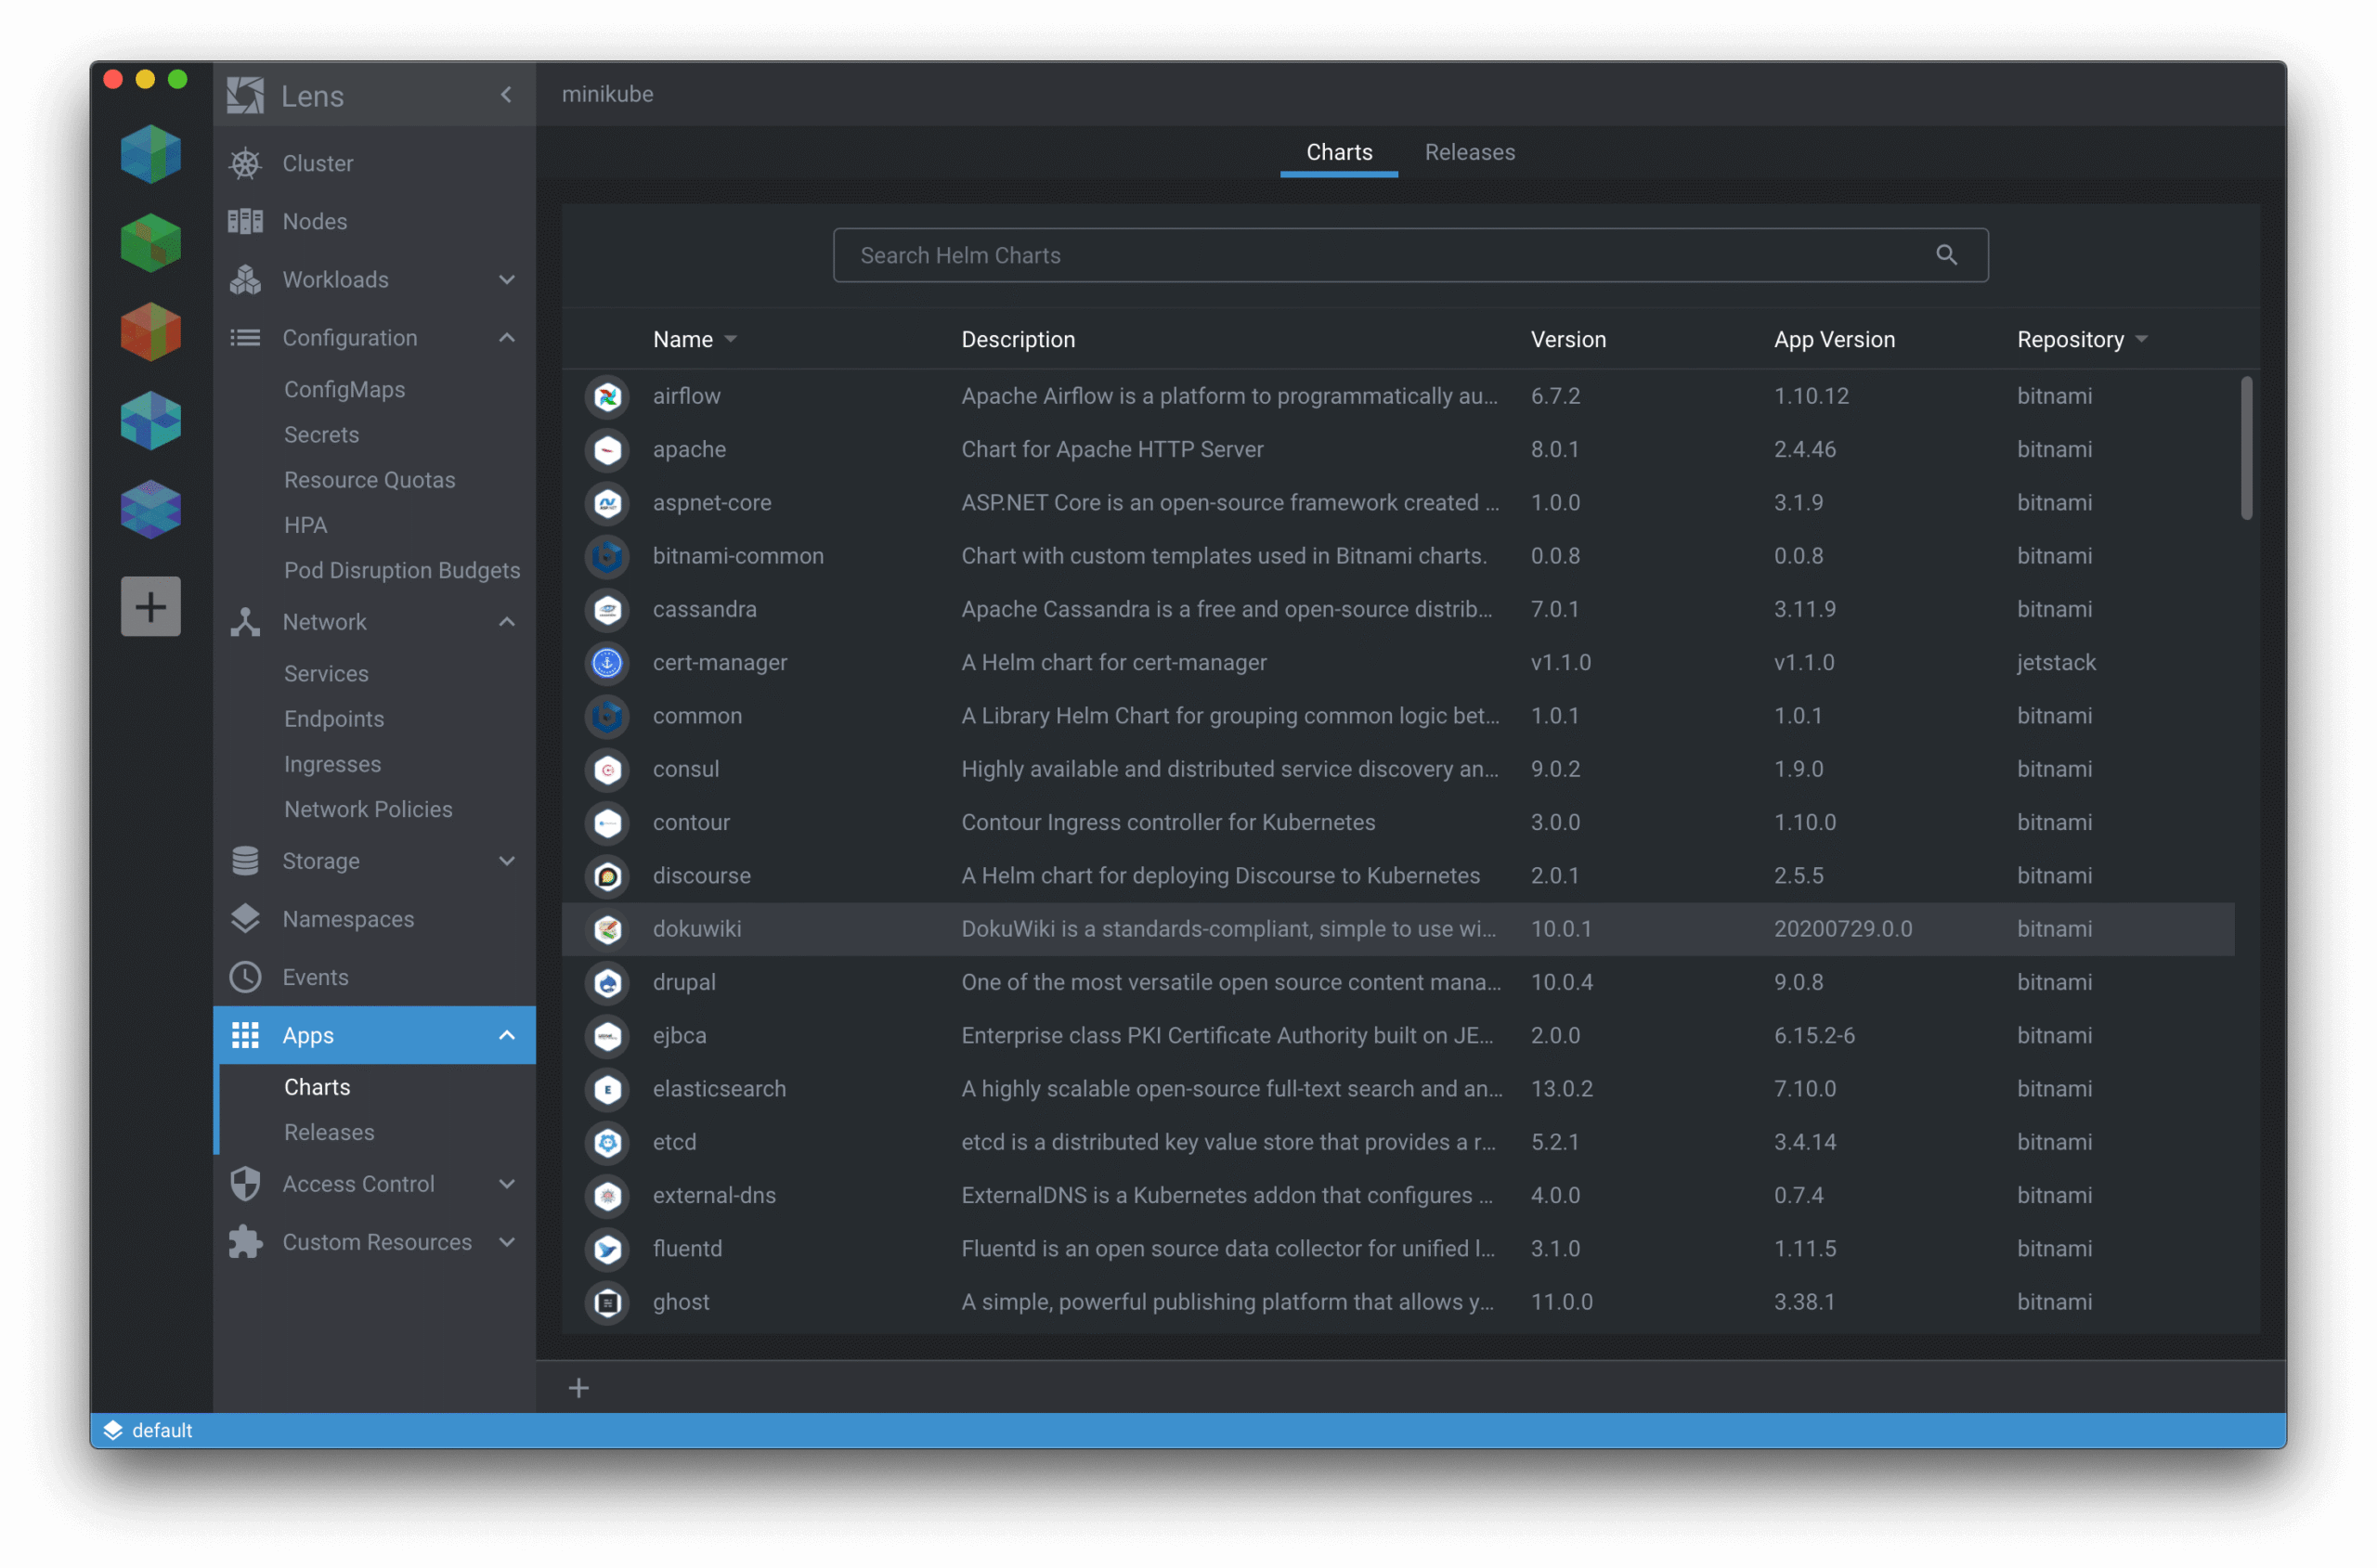
Kubernetes Lens allows you to use available Helm repositories from the Artifact Hub and automatically adds a bitnami repository by default if no other repositories are already configured. If you need to add any other repositories, those can be added manually via the command line. Do note that configured Helm repositories are added globally to the user’s computer, so other processes can see those as well. All charts from configured Helm repositories will be listed in the Apps section.
Lens Extensions
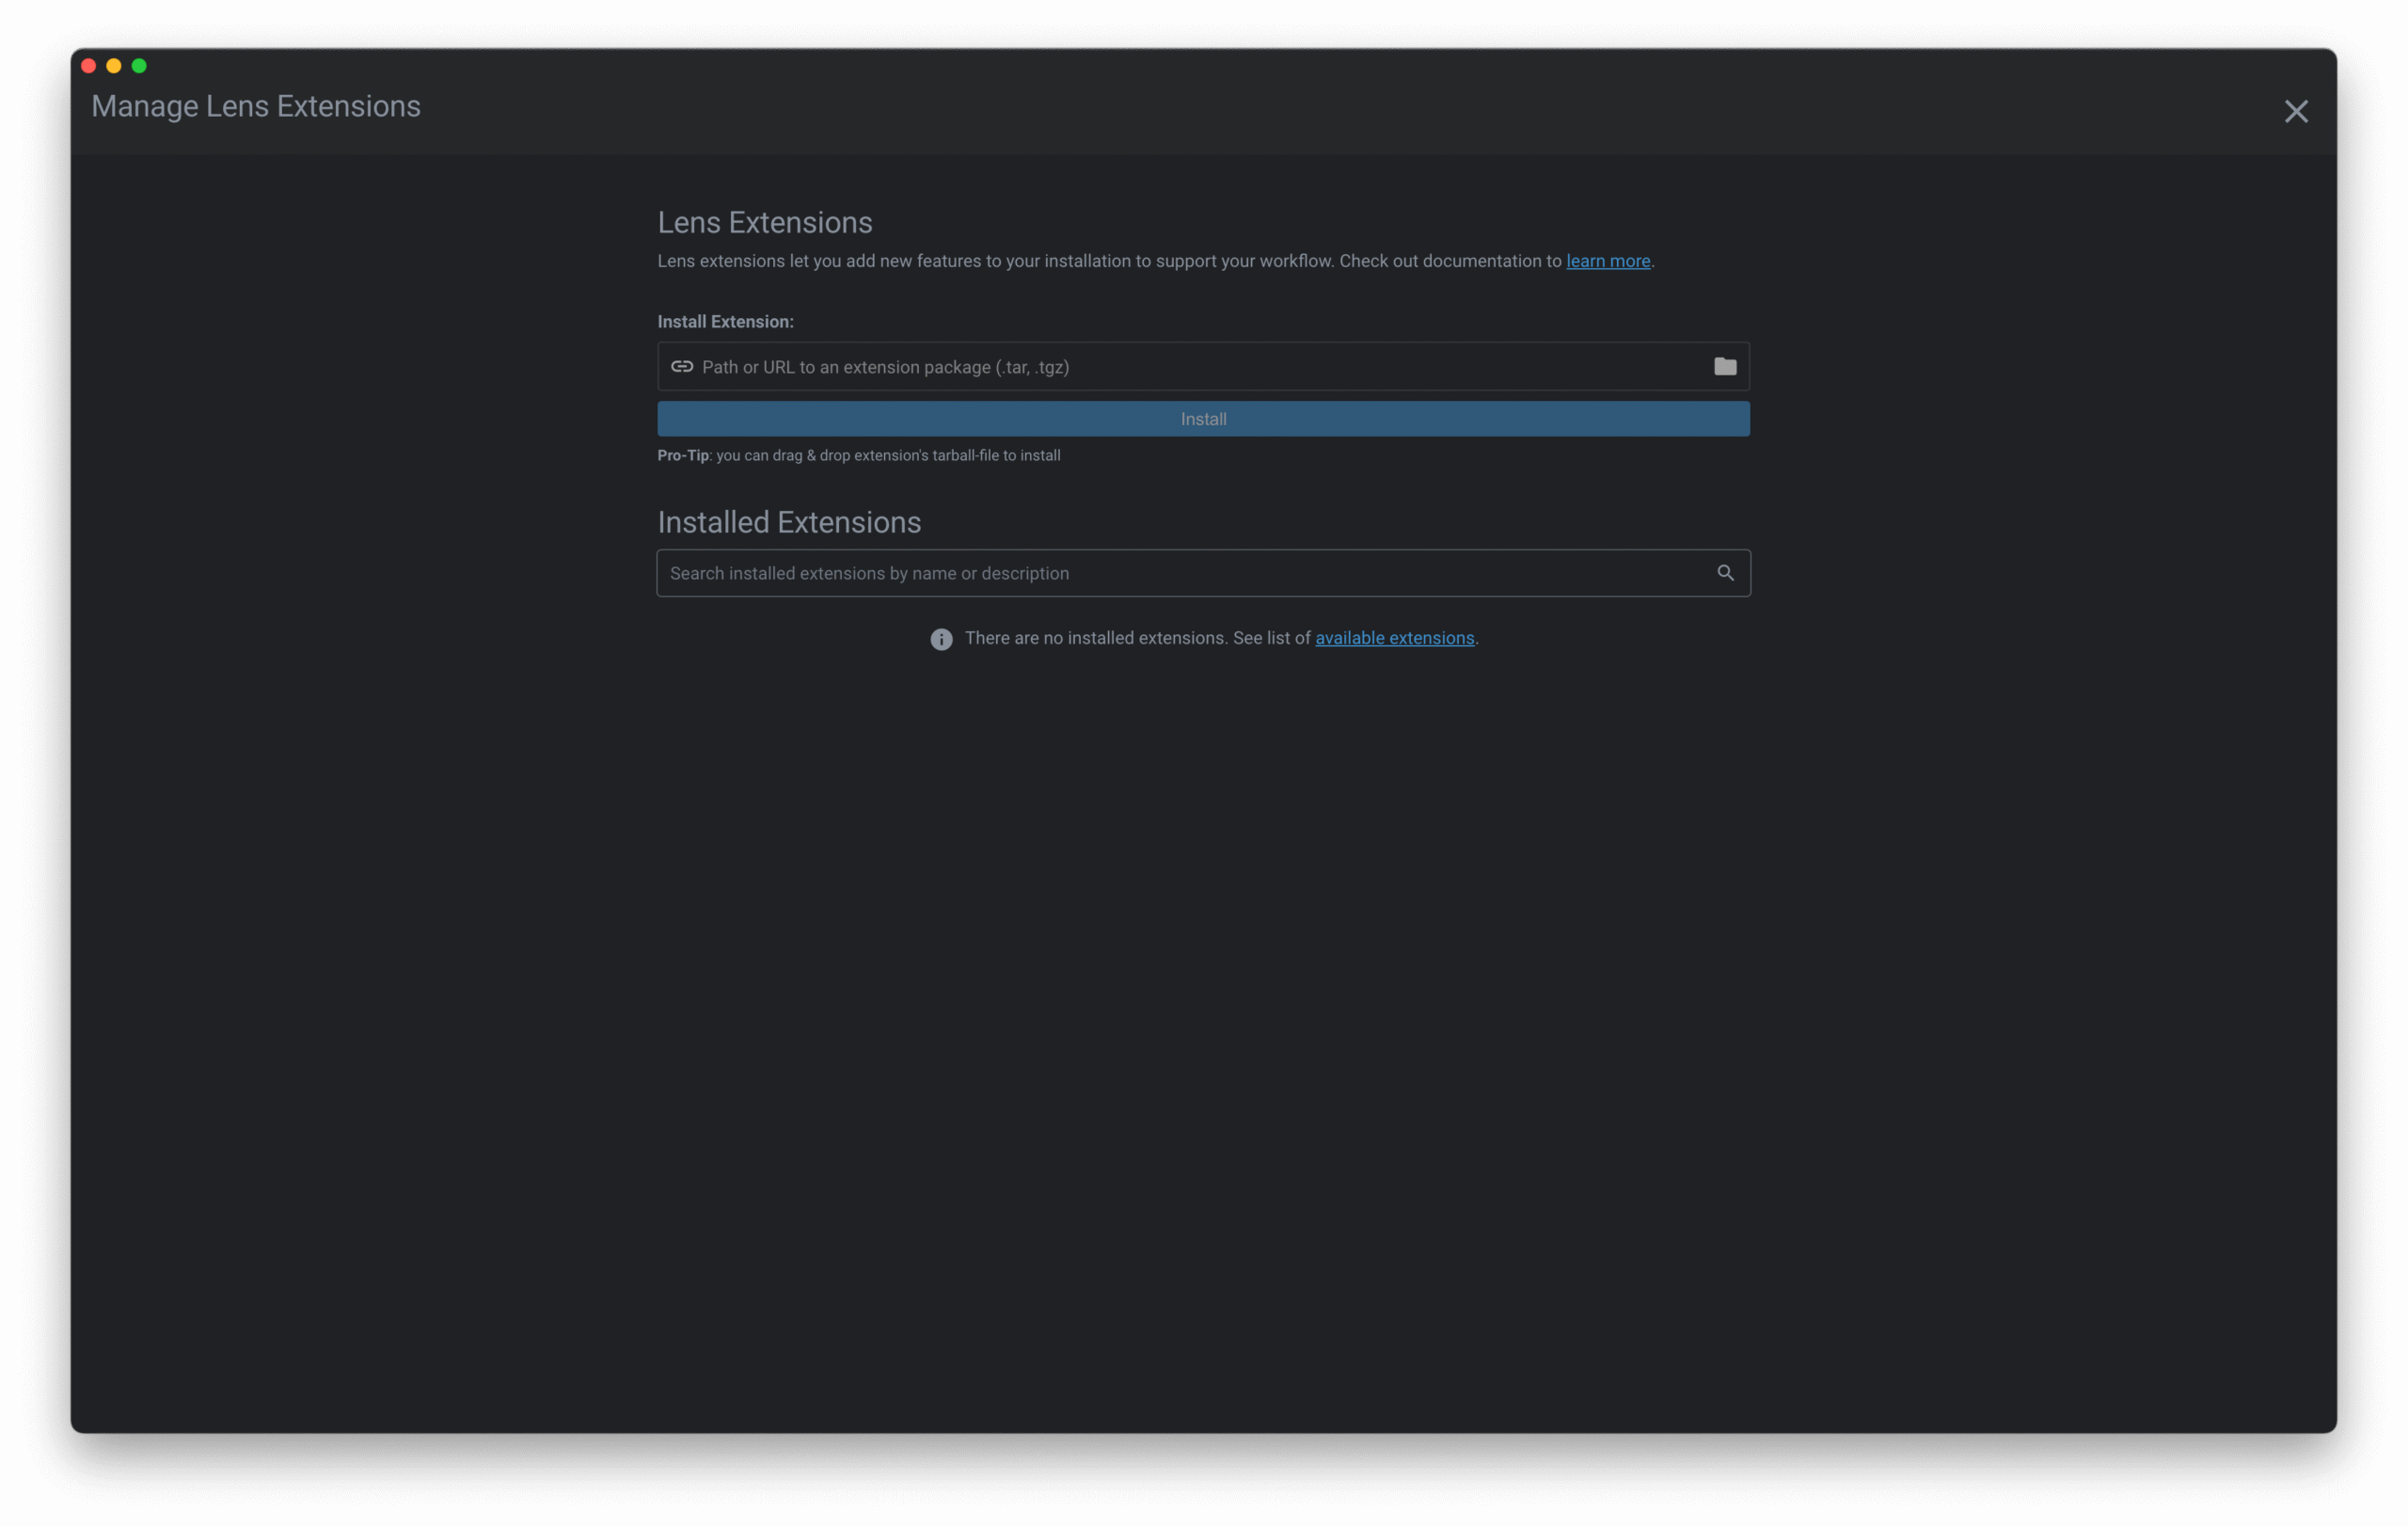
Kubernetes Lens Extensions allow you to add new and custom features and visualizations to accelerate development workflows for all the technologies and services that integrate with Kubernetes. To use Lens Extensions, go to File (or Lens on macOS) and then click Extensions in the application menu. You can install extensions in three ways on Lens:
- Installing the extension as a
.tgzfile, then dragging and dropping it in the extension management page will install it for you. - If the extension is hosted on the web, you can paste the URL and click Install, and Lens will download and install it.
- You can also move the extension into your ~/.k8slens/extensions (or C:Users.k8slensextensions) folder and Lens will automatically detect it and install the extension.
Kubernetes Lens also allows you to script your own extensions with the Lens APIs. They support adding new object details, creating custom pages, adding status bar items, and other UI modifications. Extensions can be published to npm to generate a tarball link that the Kubernetes Lens install screen can reference.
GUI over CLI
Lens provides a way to manage Kubernetes through GUI because managing multiple clusters across various platforms and substrates means deciphering the other complexities of multiple access contexts, modes, and methods for organizing clusters, components, nodes, and infrastructure. Solving all these from the command line is difficult, slow, and fallible. This is due especially to the constant increase in the number of clusters and applications, not to mention their configurations and requirements.
With the Kubernetes Lens GUI, you can do several things:
- You can add clusters manually, by browsing through their kubeconfigs and can immediately identify kubeconfig files on your local machine.
- With Lens, you can put these clusters into workgroups in whatever way you interact with them.
- Lens provides visuals on the state of objects such as including Pods, Deployments, namespaces, network, storage, and even custom resources in your cluster. This makes it easy to identify and debug any issue with the cluster.
For the CLI lovers, Lens doesn’t leave you high and dry. You can also invoke its built-in terminal and execute your favorite kubectl command line.
Lens Terminal
The built-in terminal uses a version of kubectl that is API-compatible with your cluster. The terminal can:
- Automatically detect your cluster version and then assign or download the correct version in the background.
- Maintain the correct kubectl version and context as you switch from one cluster to another.
Integrations
Lens gives you access and allows you to work with a wide variety of Kubernetes clusters on any cloud, all from a single, unified IDE. The clusters may be local (e.g., minikube or Docker Desktop) or external (e.g., Docker Enterprise, EKS, AKS, GKE, Rancher, or OpenShift). Clusters may be added simply by importing the kubeconfig with cluster details.
Lens Spaces
Kubernetes Lens promotes teamwork and collaboration via this feature called Spaces. It is a collaborative space for cloud-native development teams and projects. With a Lens space you can:
- Easily organize & access your team clusters from anywhere: GKE, EKS, AKS, on premises, or a local dev cluster.
- Easily access and share all clusters in a space securely.
Cluster Connect
In Kubernetes, sharing access to the different clusters is difficult. When working as an administrator with different providers that require you to use the same tools, or when trying to get access to kubectl files, make those files work with your kubectl. Then connect the kubectl file to the same network with the target cluster API. However, you will need to use a VPN to be in the same network as the provider, and in some cases, you will also need to use different IAM providers. These are security risks because users might bypass security best practices.
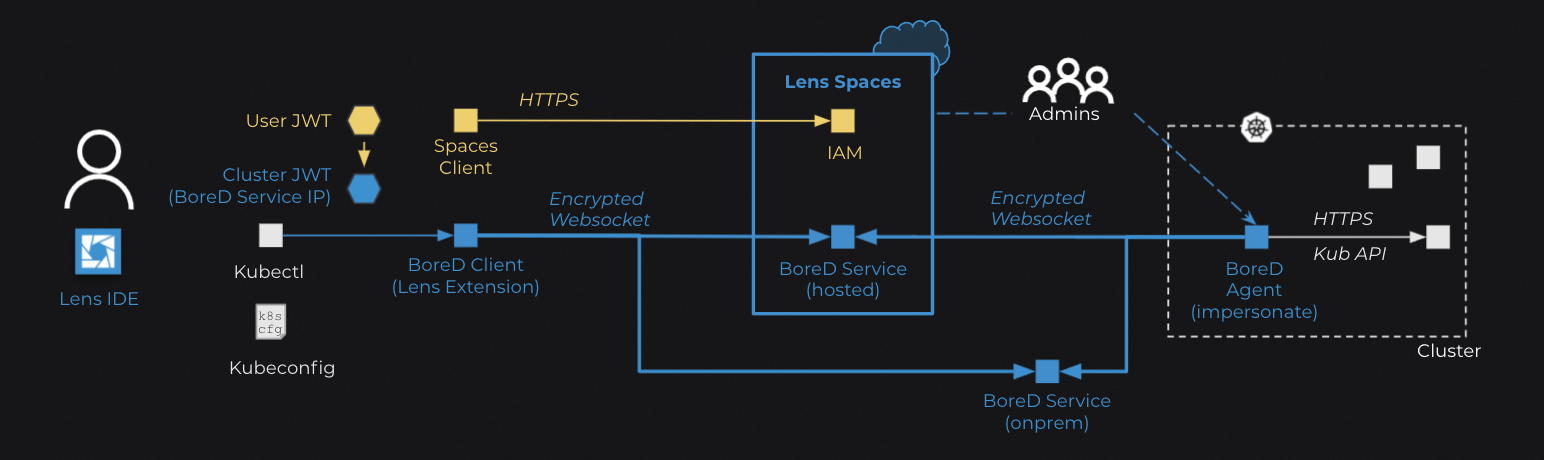
Lens uses Cluster Connect to share access to the cluster without compromising the security of the cluster.
With Kubernetes Lens Spaces, you can send and receive invitation access to other clusters. All invitations are aggregated and then exposed to you using the Lens Kubernetes proxy. To access the clusters, you download the Cluster Connect agent in the desired cluster. The agent then allows you to connect to clusters from Lens Spaces using end-to-end encryption to secure connections between you and the clusters, eliminating the need for a VPN and the need for an inbound port to be enabled on the firewall. This also means you can access and work with their Kubernetes clusters easily from anywhere.
Cluster Connect is based on the BoreD OSS software. Check out the documentation to learn more about Cluster Connect.
Multiple Workspaces Management
Lens organizes clusters into logical groups called workspaces. This helps DevOps and SREs who have to manage multiple (even hundreds of) clusters. Usually, a single workspace contains a list of clusters and their full configuration.
Kubernetes Lens is one of the most effective Kubernetes UIs you’ll ever use. It supports CRD Helm 3 and it has a friendly GUI. Lens will, of course, also handle the cluster settings for you.
Recap of Key Features for Beginners
Kubernetes Lens provides situational awareness for everything that runs in Kubernetes, lowering the barrier to entry for developers just getting started. It is an ideal solution for many reasons, including:
- It provides the confidence that your clusters are properly set up and configured.
- There is increased visibility, real-time statistics, log streams, and direct troubleshooting facilities.
- The ability to organize clusters quickly and easily totally improves productivity and business speed.
- EKS, AKS, GKE, Minikube, Rancher, K0s, etc.—any Kubernetes you might be using—all work with Lens. You only need to import the kubeconfigs for the appropriate clusters.
- Kubernetes Lens is built on an open source with an active community, supported by Kubernetes and cloud-native ecosystem pioneers.
Debugging Kubernetes in Production
Kubernetes Lens consists of numerous great features, as this article has shown you. It is an independent app much unlike the built-in Kubernetes dashboard. If you use Kubernetes and appreciate the variety of its GUI, then you should definitely check out Kubernetes Lens.
For developers looking to get visibility into their code regardless of environment or deployment type, from monolith to microservices, consider Lightrun.
For advanced users of the Kubernetes stack, Lens can’t provide the type of observability and debugging capabilities that Lightrun can for production applications in real-time. With Lightrun, developers can:
- Troubleshoot Kubernetes easily by dynamically adding logs lines
- Add as many logs as you need until you identify the problem
- Multi-instance support (microservices, big data workers) using a tagging mechanism
- Explore the call stack and local variables in any location in the code in the same version they occurred in
- Traverse the stack just like a regular breakpoint
- Add snapshots in the IDE you’re already using, easily
- Need more snapshots? Add as many as you need. You’re not breaking the system
Naturally, Lightrun offers a very robust yet easy to use way of monitoring the K8S stack, which you can try out yourself.
Lightrun is a secure, developer-native observability platform that enables you to add logs, snapshots, and metrics directly into your source code or application, in any environment. It really is the next level of Kubernetes Lens, allowing you to troubleshoot Kubernetes directly from any IDE.
With Lightrun, you can debug monolith microservices, Kubernetes, Docker Swarm, Big Data, and serverless in real time. Be sure to check out Lightrun for all of your cluster management needs.