AI Agent Observability: A Complete Guide
Oct 08, 2026 / Updated: Oct 08, 2026

Every guide to AI agent observability defines it the same way: traces, tool calls, tokens, evaluations. Read enough of them and you can predict the next section before you scroll to it. What none of them show is what happens when you actually point that instrumentation at a live agent and ask it a specific question, because most of the tools behind those guides were never built to answer one.
Key Takeaways
- AI agent observability tracks an agent’s reasoning chain: prompts, tool calls, token usage, and decision paths, mapped to the traditional metrics-logs-traces model.
- 97% of engineering leaders report significant visibility issues into their AI agents’ live execution state, and only 1% report full visibility into what happened during a specific run (Lightrun’s 2026 State of AI-Powered Engineering Report).
- Agent observability instruments reasoning and action. It rarely instruments what the perception and memory layers actually passed between each other on a specific run, which is where silent, non-crashing failures live.
- An agent can trace clean and still be wrong. Every LLM call can return a valid response, every tool call can succeed, and the agent can still act on data that was silently incomplete before it ever reached the reasoning step.
- Runtime context closes that gap by capturing the exact execution-level state inside the running service, on demand, through the Lightrun Runtime Sensor’s MCP integration with Cursor, Claude Code, GitHub Copilot, and Gemini, without a redeploy or restart.
What Is AI Agent Observability?
AI agent observability is the practice of tracing what an AI agent did during a specific run: which prompts it sent, which tools it called, what those tools returned, how many tokens it used, and what it produced as a final output. It extends the traditional metrics-logs-traces model with signals unique to agentic systems, so a team can reconstruct a single confusing run or spot patterns in cost, latency, and behavior across thousands of them.
Where traditional application observability answers “did this request succeed and how long did it take,” AI agent observability answers a layer up: “what did the agent decide, in what order, and why.” That distinction matters because an agent’s failures are rarely a crash. They’re a wrong decision made confidently, with every underlying system call reporting healthy.
Agents are shipping into production fast enough that this gap has real teeth: a May 2026 NBER study of more than 500,000 GitHub developers found autonomous coding agents raised commit activity by 240%, while actual releases only rose 30%. Additionally, Google’s 2025 DORA report found AI adoption already associated with a nearly 10% increase in software delivery instability.
The Core Components of AI Agent Observability
Most AI agent observability platforms are built around four signal types:
- Traces: A connected record of a single agent run: the user input, the planning step, every LLM call, every tool invocation, intermediate results, and the final answer, with timing attached to each step.
- Metrics: Token usage, cost per run, latency per step, and success or failure rates, aggregated across runs so teams can spot regressions or cost spikes.
- Evaluations: Automated or human-reviewed scoring of output quality, correctness, and safety, often run against a labeled dataset or a rubric.
- Logging: Structured records of tool inputs and outputs, model responses, and any decision the agent recorded, such as which route or tool it selected and why.
Together, these four signals let a team answer “what happened during this run” with a good degree of confidence. For a single-agent chatbot or a well-scoped tool-use loop, that’s often enough. It gets harder to trust as agents take on more autonomous, multi-step, higher-stakes work, because every one of those four signals only describes what the agent’s own instrumentation was told to record.
Agent Observability vs. Traditional Observability
Traditional application observability was built to answer infrastructure questions: is the service up, how long did the request take, did the call succeed. AI agent observability extends that same model with agent-specific vocabulary, but the underlying assumption doesn’t change: something has to be pre-instrumented before it can be observed.
| Traditional Observability | AI Agent Observability | |
|---|---|---|
| What it tracks | Requests, errors, latency | Prompts, tool calls, tokens, reasoning steps |
| Unit of investigation | A single request or transaction | A single agent run, end to end |
| Failure signal | An error code or exception | A failed tool call, a low eval score, a cost spike |
| What it assumes | The request either succeeded or threw | The agent’s own recorded steps are complete |
The last row is the one worth sitting with. Traditional observability assumes a request either completed or threw an exception, and that assumption mostly holds. AI agent observability assumes the trace it captured is a complete record of what happened during the run. That assumption holds less often than it looks like it does, because a trace only shows what the agent’s instrumentation was told to record about itself.
It says nothing about what the surrounding application code did with the data before or after the model was involved. This is the same structural gap covered in more depth in why AI observability isn’t enough for coding agents: the recipient of the signal changes, but the pre-instrumented, retrospective nature of the signal itself doesn’t.
What Observability Cannot See
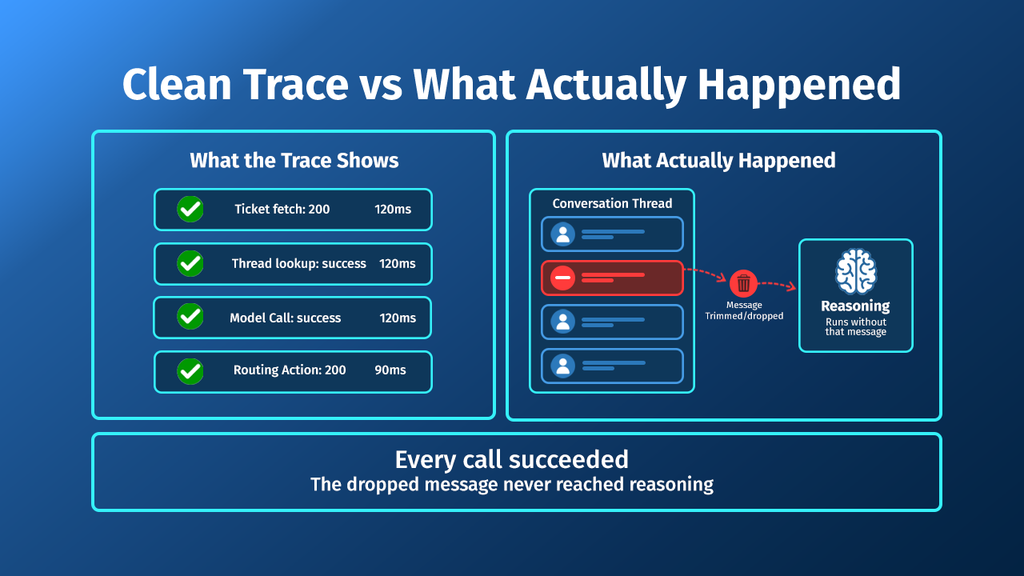
A trace can show every LLM call succeeding, every tool call returning a 200, and every token accounted for, and still miss the actual point of failure, because that failure happened one layer beneath the trace.
Take a support-triage agent running inside a customer platform. On each incoming ticket, it:
- Reads the incoming ticket and pulls the customer’s account tier (perception)
- Retains the recent conversation thread in its working context (memory)
- Decides whether to auto-resolve or escalate the ticket (reasoning)
- Routes the ticket or drafts a reply (action)
Every one of those four steps produces a clean trace. The ticket-fetch API call succeeds. The thread-history lookup succeeds. The model call returns a well-formed routing decision. The routing action fires and returns a 200. An agent observability platform watching this run would report a fully healthy trace from end to end.
The actual failure lives in a buildTriageContext() function that trims a long conversation thread to fit the model’s context window before reasoning ever runs. When a thread runs long, the trimming logic drops the oldest messages first, which on this run happens to include the line where the customer first said the issue was billing-critical, and reasoning never sees it. It scores the ticket as routine and routes it to a standard queue with a perfectly coherent explanation attached.
Nothing in the observability stack catches this, because nothing errored: the ticket-fetch API returned a 200, the model call returned a confident, well-formatted routing decision, and the routing action succeeded.
This is the same failure pattern that shows up across other agent types. A fraud-review agent that trims a customer’s transaction history to fit a context window can approve a charge that a fuller history would have flagged, with the payments lookup, the model call, and the approval write all succeeding along the way. In every case, the trace is clean. The gap is what got dropped between the perception and memory layers, before reasoning ever had a chance to work with it.
Proving It: A Live Runtime Investigation
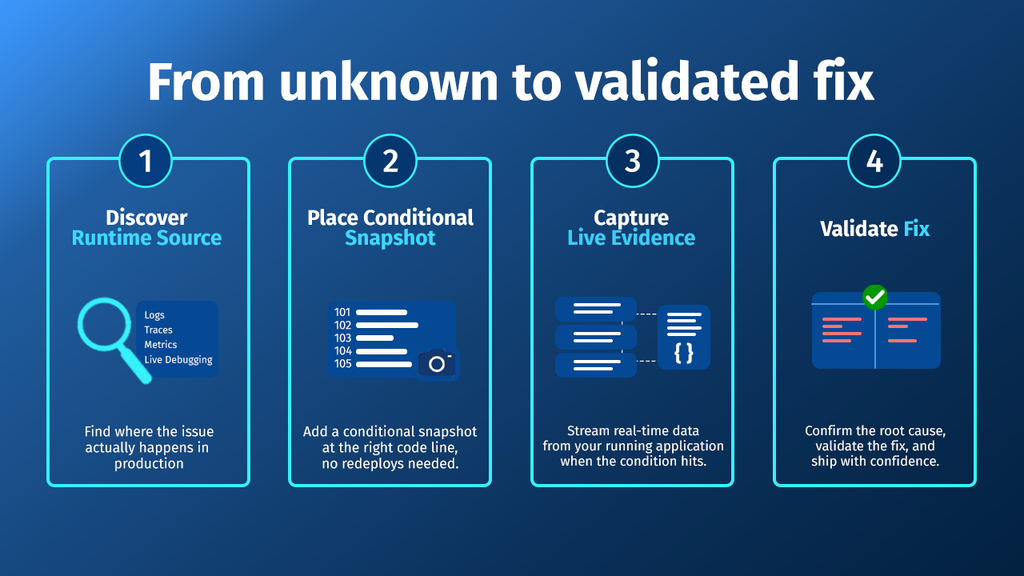
Confirming a failure like this after the fact usually means one of two things: adding a log line at the trimming function and redeploying to wait for the same conditions to recur, or accepting the agent’s explanation at face value because every trace looks healthy. The Lightrun Runtime Sensor, connected through Lightrun MCP, gives an AI coding assistant a third option: ask the running service directly.
Here’s what that looks like against the support-triage agent above, using the Lightrun Runtime Sensor from inside an AI coding assistant such as Cursor or Claude Code.
Step 1: Discover the runtime source
The engineer asks the AI assistant to connect to the triage service’s live runtime. The Lightrun Runtime Sensor identifies the connected agent and confirms a live runtime source is available to inspect, no manual setup beyond the initial MCP connection required.
Step 2: Place a conditional snapshot at the trimming point
Rather than guessing where the failure lives from a static read of the code, the engineer asks the assistant to capture the message-list state immediately before and after buildTriageContext() runs on a live request, scoped to the specific ticket ID under investigation. The Lightrun Runtime Sensor sets this up as a read-only snapshot inside its sandboxed environment, with no impact on the running service.
Engineers using the Lightrun Runtime Sensor can place this kind of conditional snapshot directly from the chat window, without writing a log statement or opening a separate tool. In the screenshot below, the AI assistant has located buildTriageContext() in the running service and set a snapshot condition scoped to the ticket ID under investigation, ready to fire on the next matching request.
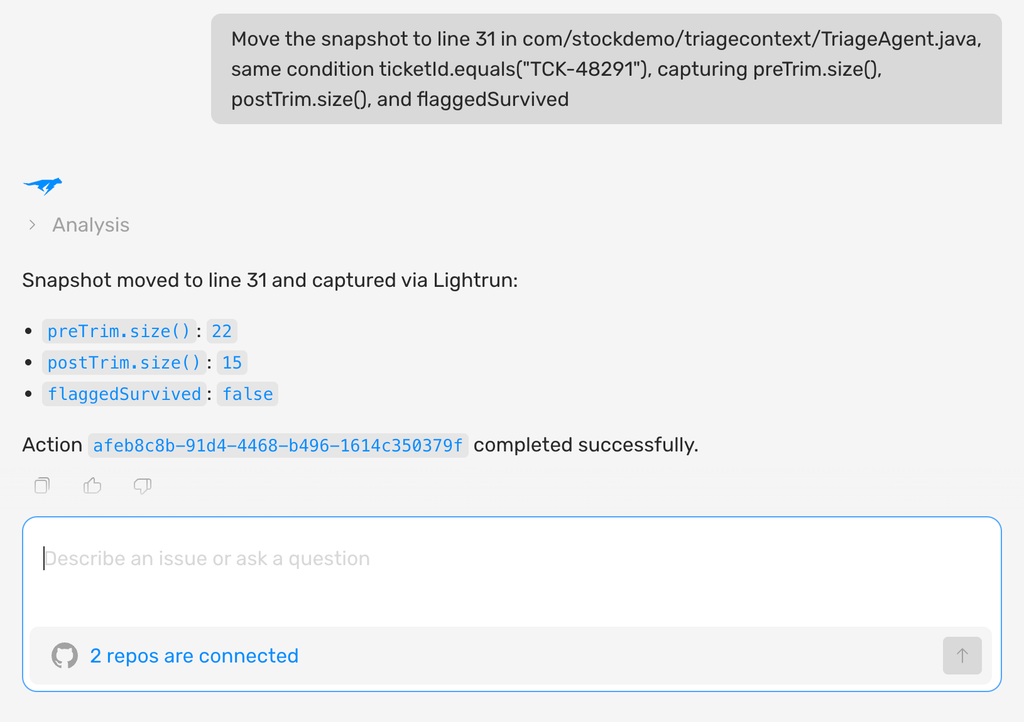
As you can see in the screenshot above:
- The snapshot condition is scoped to one specific ticket, not a blanket capture across all traffic
- The sandbox confirms the instrumentation is read-only before it goes live, so there’s no risk to the running service while it waits
Step 3: Capture the evidence on the next real request
The snapshot returns the exact values on the next qualifying request: the pre-trim thread contains 22 messages including the line flagging the issue as billing-critical; the post-trim payload passed to reasoning contains 15 messages, and that line is not among them. This is not inferred from the source code. It’s the actual state of the running service at the moment the trim executed.
This is where the investigation actually resolves. Rather than a hunch about what the trimming logic might be doing, the engineer has a literal before-and-after state of the object reasoning received. The screenshot below shows the exact counts the Lightrun Runtime Sensor captured on that run.
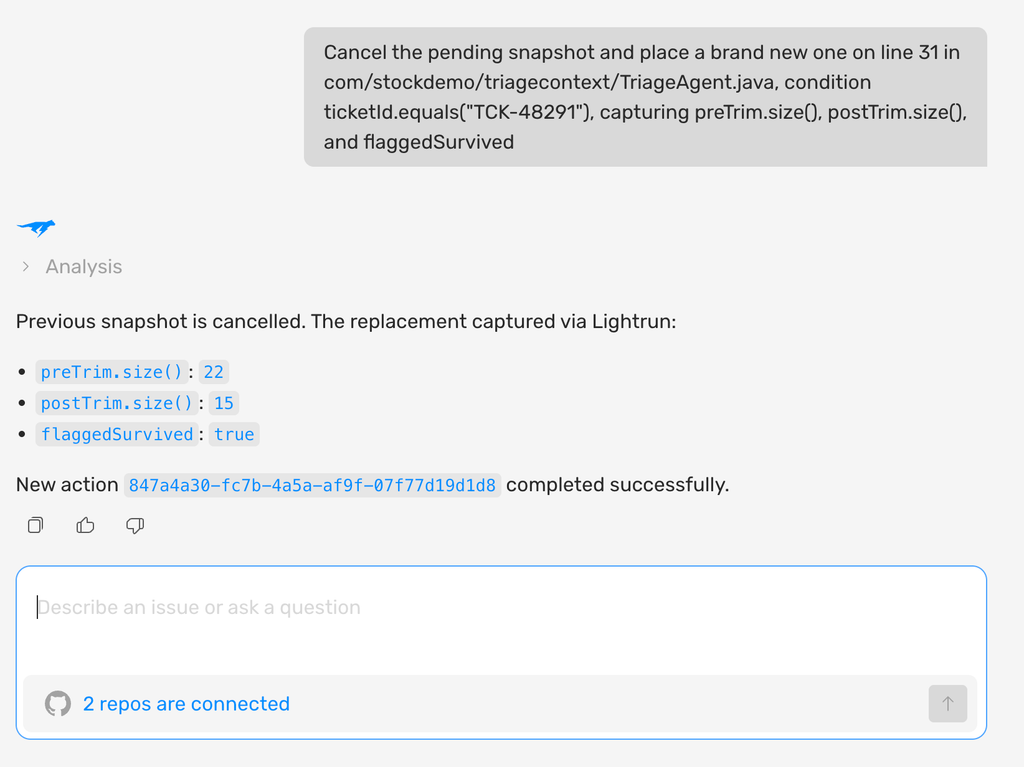
As you can see in the screenshot above:
- preTrim.size() and postTrim.size() show the trim cut seven messages from the thread before reasoning ran.
- flaggedSurvived: false confirms the billing-critical message was among the seven, proven directly from the running service.
- With the dropped message identified, the engineer knows exactly which condition the trimming logic needs: keep flagged messages regardless of age.
Step 4: Validate the fix, live
With the root cause confirmed, the fix changes the trimming order to preserve any message containing a flagged keyword or severity marker regardless of age. Before shipping it, the engineer asks the assistant to run the same live check again against the corrected code path on real production traffic, confirming the flagged line now survives the trim, with no redeployment or restart required to run the check.
No log statement was added to the codebase to catch this. No staging environment had to reproduce the exact conversation thread that triggered it. The evidence came from the one place it actually existed: the live service, at the exact line, under real conditions.
Where Agent Observability Stops and Runtime Context Picks Up
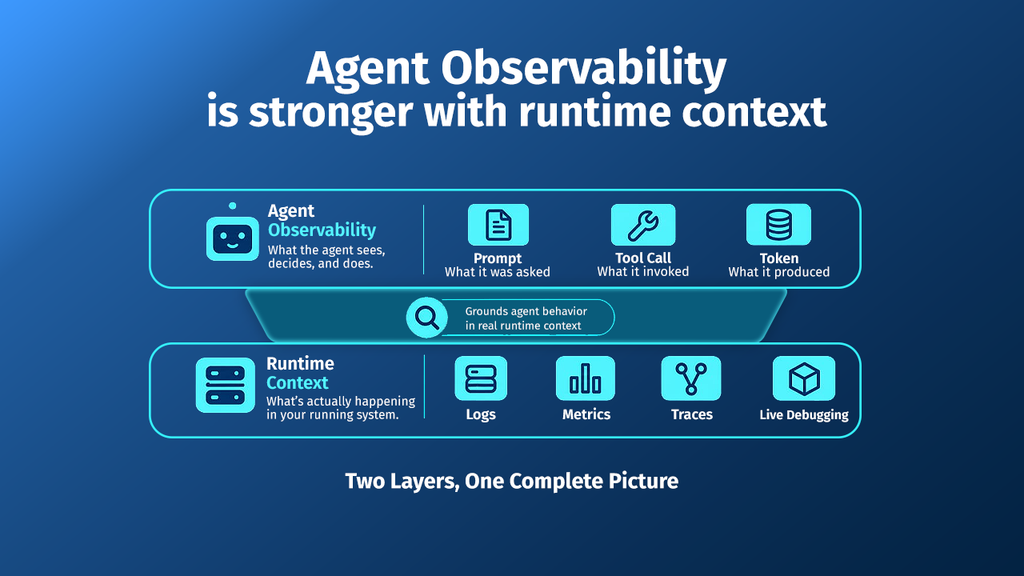
Runtime context is not a competing layer to agent observability, it’s the layer underneath it. Agent observability was built to answer what the agent did: which prompt it sent, which tool it called, what came back, how many tokens it used. Runtime context answers a different question that agent observability was never built to ask: what did the surrounding application code actually do with that data, one line later or one function up the stack. The two work together, not against each other, and a mature setup runs both.
| Capability | What Agent Observability Covers | What Runtime Context Adds |
|---|---|---|
| Data source | Pre-instrumented traces, tokens, tool calls | Generated at the exact line, on demand, alongside those traces |
| What it confirms | That the agent’s own recorded steps completed | What the surrounding application code actually did with the data |
| Silent failures | Not visible if every step reports success | Fills that specific blind spot without a pre-existing alert |
| Redeploy required | No, but new signals require new instrumentation | No, captured from the live running service |
| Agent compatibility | Structured trace/log format | Native via MCP; the agent asks a question, gets an answer |
A trace confirms that a call happened and what it returned. It doesn’t confirm what the surrounding application code did with that return value one line later, or one function up the stack, and it was never meant to. Runtime context fills that specific gap: it doesn’t replace traces, tokens, or tool-call logs, it answers the question none of them were built to ask, by capturing the exact execution-level state inside the running service on demand. For a deeper look at how this plays out across a full agent architecture rather than a single run, see why AI agent architecture needs a runtime context layer.
Where This Gap Shows Up Across the Business
The support-triage and fraud-review examples above are not edge cases. The same pattern, a clean trace sitting on top of a silent data loss, shows up anywhere an agent’s context gets trimmed, summarized, or filtered before reasoning runs, and the business cost of missing it scales with how much is riding on the decision.
- Customer support and account management. A ticket gets misrouted or an escalation gets missed not because the agent reasoned poorly, but because the context it reasoned over was already incomplete. The measurable cost shows up as SLA breaches, repeat contacts, and churn from customers who feel unheard, none of which trace back to an error in any dashboard.
- Financial services and fraud review. An agent approves a transaction that a complete transaction history would have flagged, because the history it saw was trimmed to fit a context window. The cost is direct: approved fraud, regulatory exposure, and after-the-fact audits that start from a trace showing every step succeeded.
- Sales and revenue operations. A lead-qualification or pipeline agent drops a signal, a competitor mention, a budget constraint, a renewal date buried deep in a long thread, before it reaches the scoring step. The deal gets mis-prioritized, and the only visible symptom is a forecast that quietly stops matching reality.
- Healthcare and compliance-adjacent workflows. An intake or triage agent summarizes a long patient or case history and drops a detail that changes the recommended next step. Every call in the trace succeeds, and the only way to confirm what actually happened is to see what the summarization step received and what it passed forward.
- Engineering and DevOps automation. A code-review or incident-response agent trims log context or file history before making a recommendation, and ships a fix that addresses the visible symptom rather than the root cause. The team ships fast on a confident, well-traced recommendation that was working from an incomplete picture.
In each case, the business impact is not caused by the agent making a bad decision with the information it had. It’s caused by nobody being able to confirm what information it actually had, until they can ask the running service directly.
Best Practices for Closing the Observability Gap
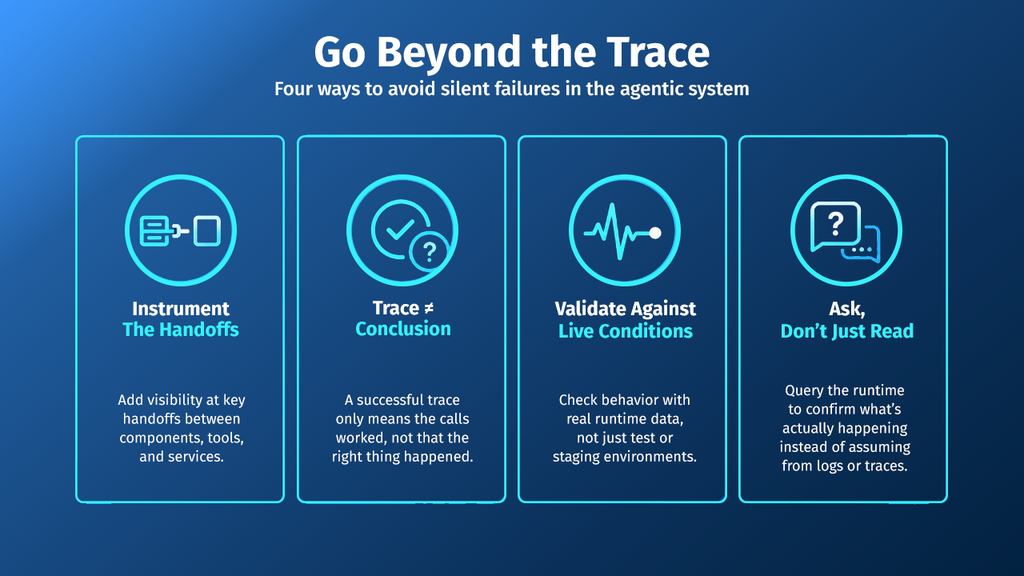
Fixing this doesn’t require ripping out existing observability tooling. It means adding a specific set of habits around the handoffs that traces were never built to watch. The four practices below are what that looks like in a real engineering workflow.
- Instrument the handoffs, not just the calls. A trace that captures the model call but not what fed it will always miss context-window trimming, silent field drops, and truncation logic. Instrument the boundary between perception/memory and reasoning specifically.
- Treat a clean trace as a starting point, not a conclusion. A fully successful trace confirms the agent’s own steps ran. It doesn’t confirm the data behind them was complete.
- Validate fixes against live conditions, not just tests. A test suite reproduces the inputs someone thought to write. Runtime context reproduces the inputs that actually occurred.
- Give agents a way to ask, not just a place to read. On-demand interrogation through MCP lets an agent or engineer request the exact evidence a specific investigation needs, rather than hoping it was already captured. This is the same principle behind runtime context between agents in multi-agent systems, where the handoff itself is often the point of failure.
Conclusion
AI agent observability answers a real and necessary question: what did the agent decide, in what order, and why. Every team running agents in production needs that answer, and the tooling built around traces, tool calls, tokens, and evaluations answers it well. What it can’t answer is the question one layer beneath it, and that’s the layer where the costliest failures tend to live.
A clean trace confirms that the agent’s own steps ran. It doesn’t confirm that the data behind them was complete, which is exactly why the failures that matter most rarely throw an error. A dropped field, a trimmed message, a truncated payload, all of it passes through reasoning as if nothing happened, because at that layer, nothing did. Closing that gap means instrumenting the handoffs themselves, the boundary between perception, memory, and reasoning, and giving an agent or an engineer a way to ask a live question and get a live answer, instead of waiting for a redeploy or making a guess.
Agent observability tells you what the agent did. Runtime context tells you whether it had the right information to do it in the first place, and production reliability depends on both. This is the same standard the Lightrun Runtime Sensor is built to.
FAQs
What is AI agent observability?
AI agent observability is the practice of tracing what an AI agent did during a specific run, including which prompts it sent, which tools it called, what those tools returned, and what it produced as a final output. It extends traditional metrics, logs, and traces with signals specific to agentic systems, such as token usage, tool-call sequences, and reasoning paths.
How is AI agent observability different from traditional observability?
Traditional observability tracks whether a request succeeded and how long it took. AI agent observability tracks a full agent run end to end, including reasoning steps and tool calls, but both assume that what was pre-instrumented is a complete record of what happened. Neither one, on its own, confirms what the application code did with the data before or after the model was involved.
Why do agent observability tools miss silent failures?
Agent observability tools trace what the agent’s own instrumentation was told to record: prompts, tool calls, tokens, outputs. A failure that happens one layer beneath that, such as a memory-layer function silently trimming or dropping data before reasoning runs, produces a fully successful trace, because nothing in the recorded steps actually failed.
How is runtime context different from AI agent observability?
Agent observability shows how an agent reasoned: which prompt it received, which tool it picked, what came back. It stops at the boundary of the agent’s own recorded steps. Runtime context reaches past that boundary into the application code around the agent, capturing what a specific function actually received, retained, or returned during a live run, so a silent drop or truncation can be confirmed at the source instead of inferred from a trace that never touched it.
What does the Lightrun Runtime Sensor’s MCP integration require?
Using the Lightrun Runtime Sensor over MCP requires the Lightrun Agent running inside the application (Java, Python, Node.js, or .NET), the Lightrun MCP server configured for the AI assistant in use, and a connected runtime source available to the user. It’s compatible with any tool that supports the Model Context Protocol, including Cursor, Claude Code, GitHub Copilot, and Gemini.