SDLC Phases and the Reliability Gap AI Can’t Close
Jul 21, 2026 / Updated: Jul 22, 2026


Decisions in each SDLC phase from planning to design, development, testing, deployment, and maintenance are made without sight of live production behavior. AI coding agents are widening that visibility gap faster, working faster than human engineers ever could. This piece maps exactly how this gap presents at each phase, and the harm that this brings.
Key Takeaways
- AI-generated code is not as production-ready as it appears in staging 43% of AI-suggested code changes still require manual debugging in production after passing QA.
- Verifying a fix in production is never a one-shot process. The same report found that no organization surveyed could confirm an AI-generated fix in a single redeploy cycle, with the average number of cycles per fix at 3.
- The biggest bottleneck in incident resolution is not tooling or process 60% of engineering leaders point to a lack of visibility into live production behavior as their primary blocker when resolving incidents.
- AI coding agents are writing code with almost no view of how production actually runs. 97% of engineering leaders report significant visibility gaps for their AI agents into the live execution state, and not a single organization surveyed reported full visibility.
- Every SDLC phase carries a reliability gap that staging environments and traditional observability tools cannot close. Live runtime context addresses each one, from how features get designed to how incidents get resolved.
What Are the SDLC Phases?
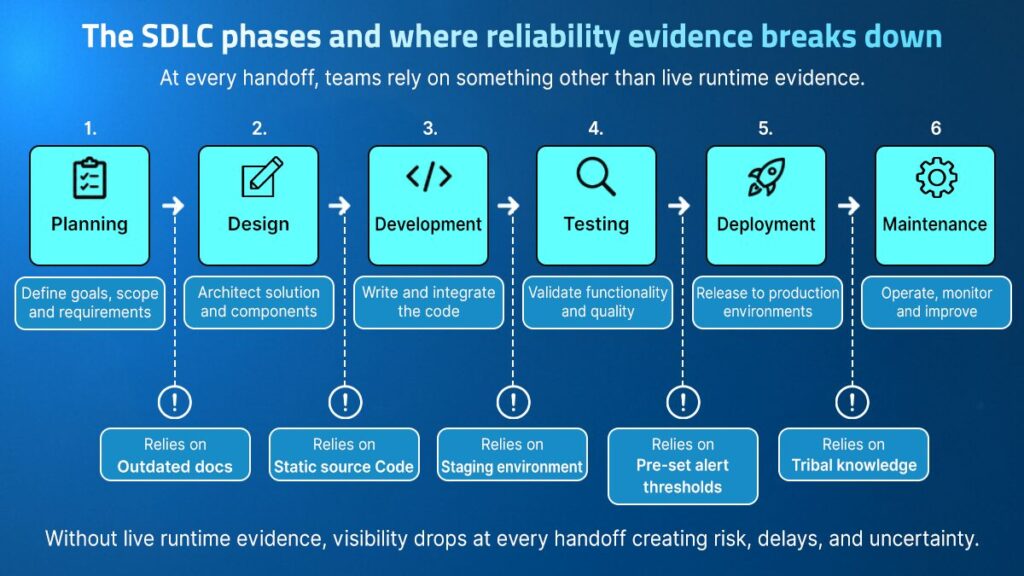
The software development lifecycle is the structured process that engineering teams use to take software from an idea to a running production system and keep it reliable once it’s there. Most teams know the framework well enough to describe it without thinking. What gets examined less carefully is what each phase actually relies on to make decisions.
The lifecycle runs through six phases, each with a defined job that feeds into the next:
- Planning: define requirements, scope, and success criteria. A team planning a fraud detection upgrade documents the requirement as “flag all trades above $10,000.” The assumption that highValue is reliably set on every TradeRequest gets baked into the roadmap without anyone checking whether that is actually true in production.
- Design: establish system architecture, service contracts, and data flows. The spec documents highValue as a boolean field on TradeRequest. The architecture is built around that contract, without querying the live system to confirm the production class hierarchy matches.
- Development: write, integrate, and review code against the agreed design. An AI coding agent generates a reflection-based setter for highValue. The implementation looks correct relative to the spec. The agent has no way to know that highValue is a primitive boolean in production, not a Boolean object.
- Testing: validate that the software behaves as expected before it ships. The AI-generated test suite confirms the setter runs without a visible exception but never asserts isHighValue() on a trade above $10,000. The coverage gap matches the implementation gap exactly: both were written without knowledge of the production runtime type.
- Deployment: ship changes to production and confirm the release is stable. The change unfolds cleanly. Health checks pass. Monitoring watches for error rate spikes and latency degradation. Neither appears, because the bug generates no exceptions.
- Maintenance: monitor running systems, investigate failures, fix bugs, and iterate based on real production behavior. Forty-seven minutes post-deployment, the fraud team flags unusual trade volume, thought error rates are flat and latency is normal. This is where most unplanned engineering time actually goes.
One assumption made at planning that highValue was reliably set propagated unchanged through every phase and reached production. That is the SDLC reliability gap, and it runs through every team operating without live execution evidence at each phase.
The SDLC was designed for an era of monthly releases, stable service dependencies, and human-written code. That era is gone. Today, teams deploy multiple times a day, AI agents generate code faster than any team can fully review, and service graphs shift constantly beneath every new feature. Understanding what has actually changed requires looking at what running the SDLC with AI agents at every phase means in practice.
What Is AI-Powered SDLC (ADLC)?
The traditional SDLC was slow enough that human judgment filled the gaps:
- A developer who had worked on a service for two years knew its edge cases
- A QA engineer who ran the same test suite weekly knew what staging missed
- A senior engineer on call at 2am knew which part of the codebase to look at first
The SDLC relied on that accumulated human context at every phase, and it mostly worked because teams had time to build it.
AI agents do not accumulate context. Consider what happens when an AI coding agent works on a fraud detection update. Within minutes it writes a reflection-based setter for highValue, generates a test suite that passes in staging, and opens a PR with a clean CI result. Nothing in that process surfaces the fact that:
- highValue is a primitive boolean in production, not a Boolean object
- The reflection call throws internally and gets silently caught
- Fraud validation will pass every trade above $10,000 unchecked
The agent did everything right by every metric the SDLC has for measuring correctness. The production failure was invisible to every step of the process.
This is what ADLC actually introduces. Decisions get made faster, more code ships per sprint, and the gap between what the system looks like in code and what it does in production compounds with every release. The reliability infrastructure the traditional SDLC built around human judgment does not exist for AI agents. They have no memory, no production context, and no way to query the live system.
The ADLC problem is not a tooling gap a faster CI pipeline closes. It is a structural gap between how AI agents make decisions and what they would need to make those decisions reliably. Closing it requires a runtime layer that gives agents live production evidence at the moment they are writing code, validating releases, and diagnosing failures, a layer that did not exist when the SDLC was designed.
Why AI-Accelerated Development Widens The Evidence Gap
Software teams are shipping faster than at any point in the history of the industry. AI coding agents generate features in hours that used to take days, CI pipelines deploy multiple times a day, and sprint cycles keep compressing. But Google Cloud’s DORA 2025 report found that delivery instability increased by 10% as AI adoption grew, speed went up, but reliability did not follow.
Every phase of the SDLC is moving faster, but the evidence teams use to make decisions at each phase has not changed. The same staging environments, the same pre-instrumented dashboards, the same manual reproduction cycles, just more code flowing through them, faster.
Staging Environments That No Longer Reflect Production
Staging was designed for a world where production traffic was predictable and service dependencies were stable. Modern systems run across dozens of microservices, pull from third-party APIs with their own failure modes, and receive AI-generated code changes at a pace that outstrips any team’s ability to fully validate them before the next release ships.
The divergence between staging and production is not just about traffic volume. Staging typically runs against:
- Synthetic data subsets that do not reflect real user-generated edge cases
- Mocked third-party integrations that return controlled responses
- Schema versions that lag behind what upstream teams have already deployed
A test suite passes cleanly against the staging schema, and the same code hits a field type in production that staging never had because an upstream team changed it three months ago and nobody updated the staging environment.
AI Agents That Code Without Execution Evidence
AI coding agents like Cursor, Claude Code, GitHub Copilot, Kiro, and Windsurf are genuinely excellent at reading a codebase, inferring patterns, and generating syntactically correct implementations. What they cannot do is query how the live system actually behaves right now in production.
- They do not know which type a field is carrying across all active service instances.
- They do not know which edge case surfaces under real load but never appears locally.
- They do not know which integration fails silently when a downstream service returns a malformed response.
- They do not know whether the service contract they are coding against has already drifted from what production is actually delivering.
When a coding agent generates an implementation, it is pattern-matching against the code as written, not validating against the system as running. The code is correct according to the docs. The docs no longer match what the system does.
Some teams are now closing this gap by giving AI coding agents access to observability MCPs Datadog, Grafana, and similar tools with MCP interfaces. These help, but they carry the same structural limitation as the dashboards they expose:
- The agent can query existing metrics and read pre-defined dashboards
- It cannot choose what to investigate beyond what was already instrumented
- It cannot instrument a new code path on demand
- It cannot capture a variable state that was never configured for collection
The evidence available to the agent is still bounded by decisions made at deployment time before the incident happened, and before the agent started writing the code that caused it.
The Reliability Gap Inside Each SDLC Phase
1. Design: Specifying Features Against a System That No Longer Matches the Docs
A team designing a highValue flag setter for TradeExecutionService checks the documented model, sees that highValue exists on TradeRequest, and designs a reflection-based implementation. What the documentation does not show is that highValue is declared as a primitive boolean not a Boolean object which means a reflection call assigning a String “true” will throw internally and leave the flag unchanged.
Design decisions get made against a model that diverged from what production actually enforces. By the time the feature reaches development, the assumption baked into the spec is already wrong before anyone writes a single line of code.
2. Development: AI Agents Writing Code Without Knowing What Production Is Doing
The agent reads the codebase, sees that highValue needs to be set on the TradeRequest object, and writes a reflection-based setter that assigns the String “true”. It is a perfectly reasonable implementation given what the codebase shows. The problem is what the codebase does not show:
- That highValue is defined as a primitive boolean on TradeRequest, not a Boolean object.
- That field.set(request, “true”) on a primitive boolean throws IllegalArgumentException at runtime.
- That the agent, having no access to the live type, generates tests that never assert isHighValue() on a trade above $10,000 the same blind spot in the implementation becomes a blind spot in the test coverage.
The code ships and the tests pass, not because staging diverges from production, but because neither the implementation nor the test suite was written with knowledge of what the production type actually is. That is the gap Lightrun MCP closes at the moment the agent writes the code.
3. Testing and QA: Why AI-Generated Tests Miss What Matters in Production
AI-generated code production failures are not a testing quality problem. 43% of AI-suggested code changes still require manual debugging in production after passing QA and staging and in this case, it is not an environmental problem either. It is a knowledge problem.
The test suite passes because the agent that wrote the implementation also wrote the tests, and both were working from the same incomplete picture. Neither knew that highValue was a primitive boolean in production, so neither tested the one assertion that would have caught the failure: isHighValue() returning true on a trade above $10,000.
The coverage gap is not a staging environment problem. It is a knowledge problem. Lightrun MCP surfaces the production runtime type at the moment the agent writes the code, so both the implementation and the tests get written against what production actually does.
4. Deployment: Releasing Into a Monitoring Blind Spot
Post-deployment validation relies on alert thresholds configured before the deployment happened. Traditional monitoring watches for:
- Error rate spikes above a defined threshold
- Latency degradation beyond a p99 ceiling
- Throughput drops below a minimum baseline
What it cannot watch for is a silent logic error that passes fraudulent transactions without generating exceptions. The system is working exactly as coded: no errors, normal latency, healthy throughput, it’s just coded to the wrong behavior. The window between a broken release going live and a user-visible impact is where the most expensive damage accumulates, and monitoring has no architectural way to observe it.
5. Maintenance: Root Cause Analysis Without the Evidence That Matters
The on-call engineer gets paged, opens the dashboards, and sees healthy error rates and normal latency. The issue is not in the metrics, it is in the execution logic and the execution logic was never instrumented to capture the evidence that would confirm it.
What follows is the investigation pattern that 54% of high-severity incidents still rely on: tribal knowledge. The senior engineer who remembers a similar reflection type issue from 18 months ago gets pulled from their current sprint. They build a hypothesis, add logging, open a PR, get it reviewed, deploy to staging, wait for the failure to be reproducible, and discover that staging still does not replicate the production state that caused it. The cycle resets, and the war room runs longer while everyone else waits.
Why Datadog, Grafana, and Prometheus Cannot Close These Gaps
Datadog, Grafana, and Prometheus are excellent at what they were built for: aggregating metrics, correlating logs, and alerting on thresholds. But every insight they surface comes from telemetry that was defined before the incident happened. If the failure mode was not anticipated during instrumentation setup, the data simply does not exist.
These tools are only as useful as what was instrumented before the incident. Everything outside that boundary is invisible.
The constraint shows up at two specific moments in the SDLC:
- At build time there is no interface for AI coding agents to query live production behavior through an APM platform. Datadog has no MCP server that lets a Cursor session ask “what is the runtime type of this field in production right now.”
- At the failure point confirming root cause means adding the missing instrumentation, opening a PR, getting it reviewed, deploying it, and waiting for the failure to recur. By that point the production state has already changed and the window to observe it directly has closed.
This is not a configuration problem that better tooling can solve, rather this is a structural flaw in the design of current observability solutions.
The industry’s own data confirms the gap is structural, not a maturity problem teams will simply grow out of. The World Quality Report 2025-26, based on a survey of more than 2,000 senior executives, found that 94% of organizations already review production data to inform testing, but nearly half cannot turn those insights into actual quality improvements. The visibility exists. Acting on it, at the moment a decision is being made, is what pre-instrumented tooling was never built to support.
The data reflects this clearly: 44% of cases where AI SREs or APM tools investigated production issues failed because the necessary execution-level data was never captured, and 77% of engineering leaders have low or no confidence that their current observability stack supports reliable automated root cause identification. Better dashboards do not close that gap. A different architecture does.
How Runtime Context Works Across the SDLC
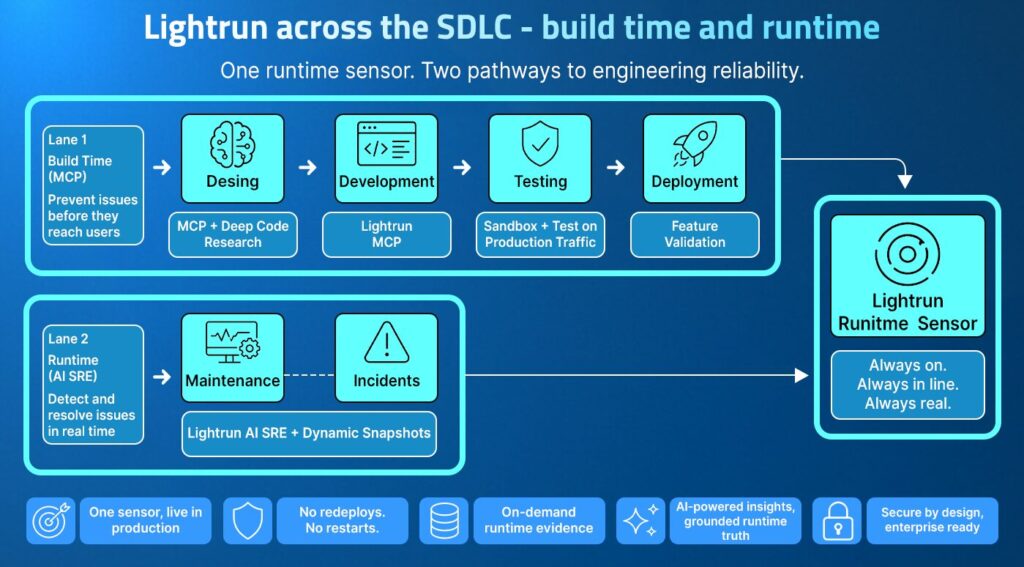
Design: Query Production Before Writing a Line of Code
Lightrun MCP and Deep Code Research let AI agents query live production behavior before the feature spec is written. Before a single design decision is made, the agent can ask:
- Which fields are arriving with unexpected types across active service instances
- Which API endpoints are generating silent errors that are not surfacing in logs
- Which service paths fail under load conditions that documentation does not describe
- What the actual runtime behavior of a downstream dependency looks like right now
The design decision gets made against what the system actually does, not what the last person to update the wiki thought it did.
Development: Ground Every AI Agent Suggestion in Production Reality
Lightrun MCP connects Cursor, Claude Code, GitHub Copilot, Kiro, Windsurf, and other AI coding agents to live runtime data as they write code. When an agent is about to write a setter for highValue, it can ask: “What is the live runtime type of highValue on TradeRequest across all active production instances?” The MCP surfaces the actual production declaration primitive boolean at TradeRequest.java:13 before the agent writes a reflection-based setter that assigns a String “true” to it.
Every type contract, edge case behavior, and integration failure mode that only surfaces in production becomes visible to the agent at the moment it is relevant, not three redeploy cycles later. For more on how runtime context for AI coding agents integrates into existing development workflows, see how Lightrun MCP connects directly to the tools engineers already use.
Testing: Validate Against Real Production Conditions
Lightrun Sandbox and Test on Production Traffic let teams validate against actual live behavior without risk to production. Engineers set up conditional snapshots against the live environment snapshots that fire only when specific conditions are met. For example:
- A trade value exceeding the $10,000 threshold with highValue in an unexpected state
- A specific user tier hitting a code path that staging never exercises
- An upstream response arriving with a field type that diverges from the contract
These snapshots run against real production traffic in a read-only sandboxed environment with zero impact on the running application. The failure modes that staging cannot surface become visible before the release goes out.
Deployment: Confirm Behavior on First Live Request
Lightrun Feature Validation instruments deployments immediately after they go live. Rather than waiting for alert thresholds to fire, AI agents verify runtime behavior on the first actual live requests capturing execution paths, variable states, and service interactions for the new code under real production conditions.
If the new release introduces a type handling change that produces unexpected behavior, the first real-world request surfaces it not the PagerDuty alert 47 minutes later. The monitoring blind spot between deployment and the first alert becomes observable in real time.
Maintenance: Instrument at the Failure Point, Without Redeploying
Lightrun AI SRE instruments running applications at the exact failure point on demand, adding dynamic snapshots, logs, and traces to the live system without stopping it or triggering a redeployment. When an incident fires, within seconds it is capturing:
- The exact variable state at the lines where behavior diverges from expected
- The execution path that led to the failure
- The runtime type of every field involved in the failing logic
For teams dealing with recurring site reliability engineering challenges, Lightrun AI SRE integrates directly into existing incident channels and toolchains without requiring changes to application code.
Lightrun in Action: One Bug Traced Across All Five SDLC Phases
A fintech engineering team ships an update to TradeExecutionService as part of a broader refactor. The change adds a reflection-based setter for the highValue flag on trade requests. Tests pass in staging, the deployment is smooth, and every health check stays green. Forty-seven minutes later, the fraud operations team flags unusual trade volume in US-EAST-1.
Error rates are flat, latency is normal, and every dashboard shows a healthy system. The monitoring is working exactly as designed. It just was not designed to see this.
What is actually happening: TradeExecutionService is setting highValue via reflection using a String “true”. But highValue is a primitive boolean on TradeRequest the reflection call throws internally at line 55, gets silently caught, logs nothing, and leaves isHighValue() returning false for every trade at the fraud validation call on line 62.
Every trade above $10,000 passes unchecked because the system is working exactly as coded.
The same bug had five chances to be caught before it reached production.
| SDLC Phase | Without Lightrun | With Lightrun |
| Design | Team designs the highValue setter without checking the live field type of highValue on TradeRequest in production | MCP query surfaces the live type of highValue primitive boolean confirmed before the spec is written, reflection approach flagged immediately |
| Development | AI agent writes field.set(request, “true”) without knowing highValue is a primitive boolean at runtime | Lightrun MCP surfaces the primitive boolean type of highValue before the agent writes the setter the reflection mismatch is caught before the PR is opened |
| Testing | AI-generated tests never assert isHighValue() on a trade above $10,000 the coverage gap mirrors the implementation gap exactly | Lightrun Sandbox fires conditional snapshots against real production traffic the silent reflection failure surfaces before release |
| Deployment | No exceptions thrown, no alert fires for 47 minutes | Feature Validation captures isHighValue() returning false on the first live $72,000 trade anomaly flagged immediately |
| Maintenance | War room. No exceptions in logs. Senior engineer pulled from active sprint to investigate silent fraud validation pass. | Lightrun AI SRE traces the failure to TradeExecutionService.java:53 field.set(request, “true”) silently failing on a primitive boolean, isHighValue() stays false at line 62 |
Before writing the highValue setter in Claude Code, the engineer uses Lightrun MCP to check how highValue is declared across active production instances. The screenshot below shows exactly what a live MCP type query returns here querying totalCost to demonstrate the capability captured live from the running production instance, no redeployment, no code change.
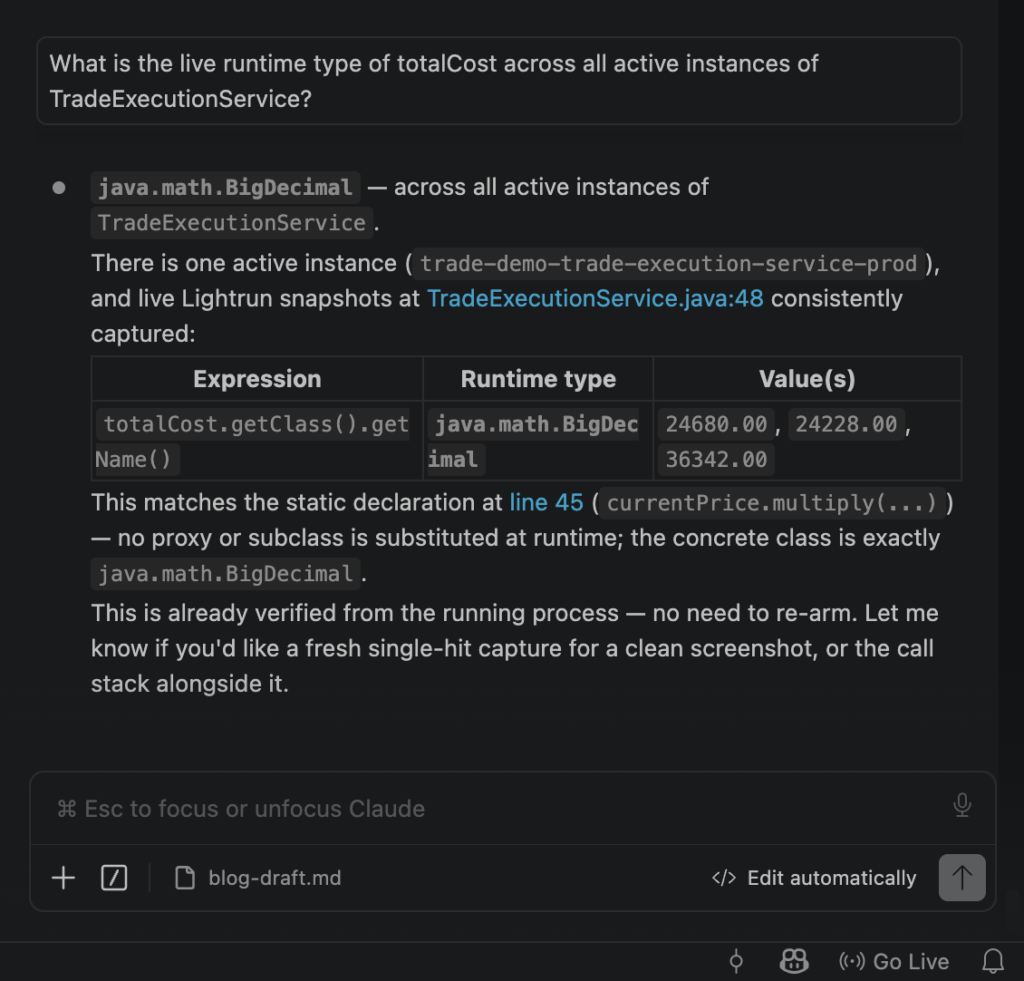
The MCP returns the live runtime type directly from trade-demo-trade-execution-service-prod no redeployment, no code change, captured live from the running process.
Had the engineer queried highValue the same way before writing the reflection setter, they would have seen a primitive boolean at TradeRequest.java:13 and known immediately that field.set(request, “true”) would throw internally. The agent either proceeds with confidence or corrects the implementation on the spot. Either way, the bug never reaches production.
Forty-seven minutes after the release ships in a team without Lightrun MCP active during development, the fraud team flags the anomaly. The on-call engineer opens Lightrun AI SRE. No new instrumentation. No redeployment. No PR. The screenshot below shows what the investigation surfaces within seconds.
The AI SRE identifies the most likely cause with precision: TradeExecutionService sets highValue via reflection using a String “true” at TradeExecutionService.java:53. highValue is defined as a primitive boolean on TradeRequest at line 13 the reflection call throws internally, is caught silently at line 55, logs nothing visible, and leaves request.isHighValue() returning false at the fraud validation call on line 62. Every trade passes unchecked, regardless of amount.
Lightrun AI SRE placed live probes at the fraud validation call site on trade-demo-trade-execution-service-prod and surfaced the full code path without a redeployment, without a PR, and without a war room. Root cause confirmed , fix proposal generated and no senior engineer pulled from their sprint.
How Lightrun Addresses the Reliability Gap at Each SDLC Phase
| SDLC Phase | Reliability Gap | Lightrun Capability | Outcome |
| Design | Features designed against outdated docs | MCP + Deep Code Research | Designed against live production behavior |
| Development | AI agents code without runtime evidence | Lightrun MCP (Cursor, Claude Code, Copilot, Kiro) | Every suggestion validated against production |
| Testing | AI-generated tests miss production-critical paths same knowledge gap as the implementation | Sandbox + Test on Production Traffic | Coverage gaps caught against real production behavior before release |
| Deployment | Post-deploy validation relies on pre-set alerts | Feature Validation | Anomalies caught on first live request |
| Maintenance | RCA requires redeploys and war rooms | Lightrun AI SRE + Dynamic snapshots | Root cause confirmed in minutes, no redeployment |
Conclusion
Every phase in this piece decides based on what the docs say, not what production is doing, and that gap travels unchanged from planning to maintenance. Code can match the spec, pass the tests, and ship clean, and still fail, because none of those checkpoints test against the live system.
AI coding agents make this worse, not because they write worse code, but because they generate that same class of untested assumption at a volume and speed no human team could match, with no memory of past incidents and no way to query the system they’re writing for.
Closing the gap isn’t a matter of a better dashboard or a faster pipeline. Both only report on what someone instrumented before the incident happened. Lightrun runs one Runtime Sensor across the lifecycle. At design and development, it reaches AI coding agents through MCP, surfacing live production evidence before code ships. At testing and deployment, that same evidence validates against real traffic and catches anomalies on the first live request. At maintenance, Lightrun AI SRE instruments the failure point directly, with no redeploy required at any stage. That’s what turns reliability into something the SDLC produces by default, rather than something teams scramble to rebuild after every release.
FAQ
The software development lifecycle runs through six phases: planning, design, development, testing, deployment, and maintenance each with a defined job that feeds into the next. The reliability of the final system depends on whether each phase makes decisions grounded in how the system actually behaves in production.
Most testing happens in staging environments that do not replicate production conditions, different data shapes, mocked integrations, and schema versions that lag behind what upstream teams have already deployed. The failure modes that cause production incidents simply do not surface during QA, and according to the Lightrun State of AI-Powered Engineering 2026 report, 43% of AI-suggested code changes still require manual debugging in production even after passing QA and staging.
AI coding agents accelerate every phase of the SDLC but operate on static source code with no access to live production behavior, meaning they cannot verify whether a type contract is honored, whether an edge case surfaces under real load, or whether a suggested change introduces a failure mode that only appears in production. Google Cloud’s DORA 2025 report found that delivery instability increased by 10% as AI adoption grew, reflecting the gap between shipping speed and production evidence.
Live runtime context is execution evidence captured from a running production system on demand without stopping the system or triggering a redeployment including actual variable values, execution paths, runtime types, and service interaction states at a specific moment in production. It gives AI agents and engineers the evidence needed to make decisions based on how the system actually behaves rather than how it was designed to behave.
Lightrun operates through two interfaces: the Runtime Sensor via MCP connects AI coding agents to live production context at build time across design, development, testing, and deployment, while Lightrun AI SRE instruments running systems at the failure point during maintenance and incidents both operating in a read-only sandboxed environment with no redeployment required and no impact on production performance.