How to solve key site reliability engineering challenges
Apr 20, 2026
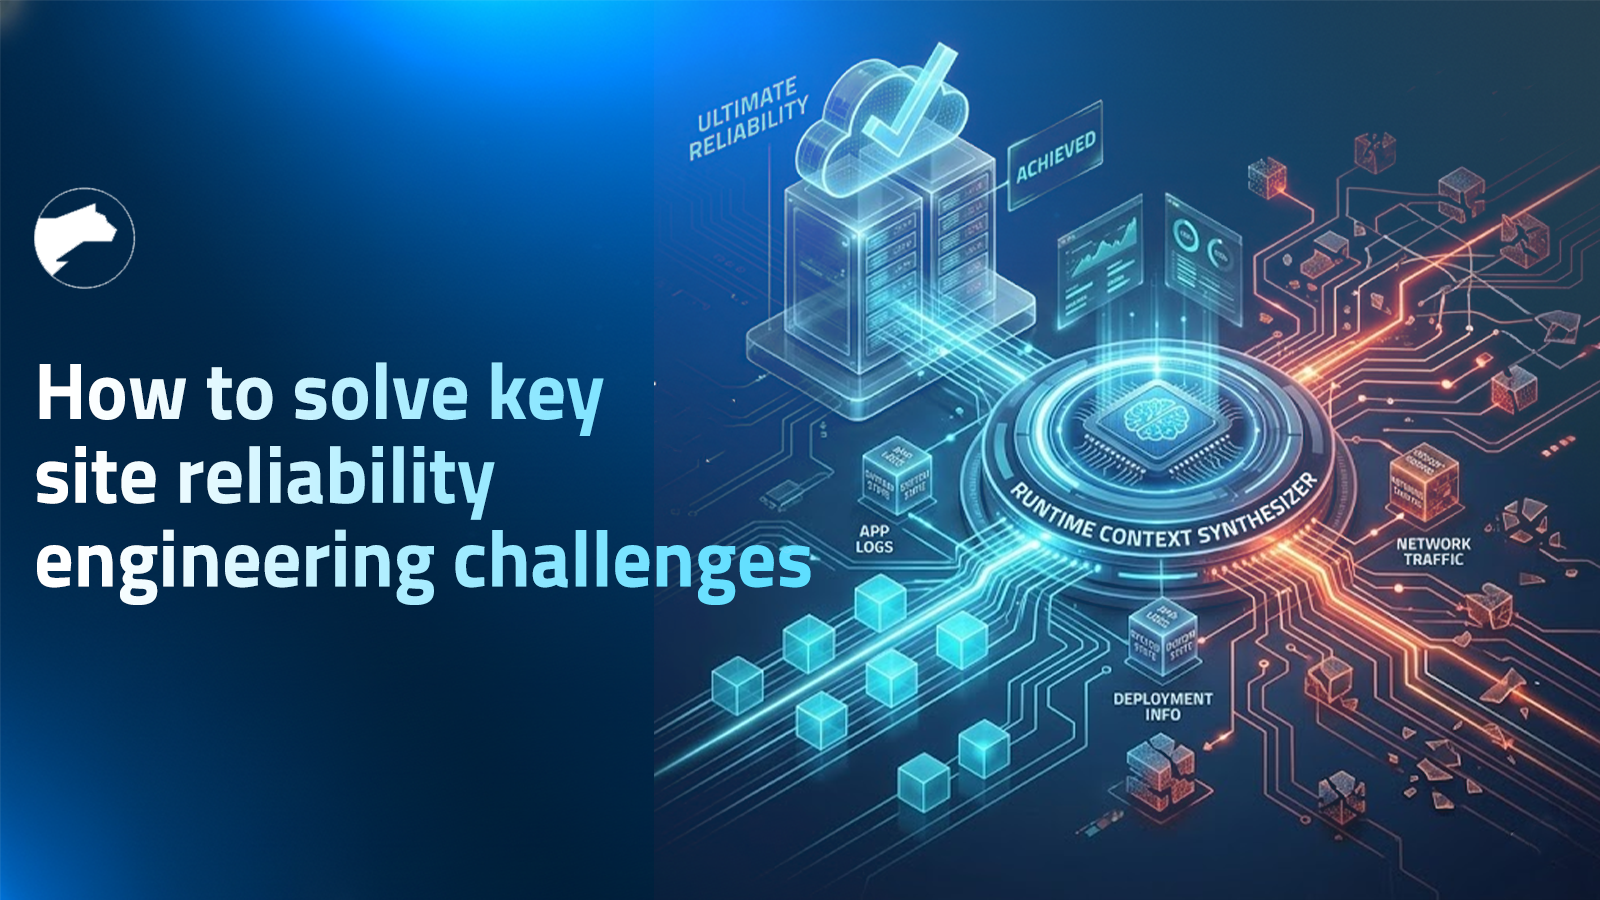

Modern site reliability engineering challenges stem from the difficult requirement of confirming why complex systems fail in ways staging cannot replicate. While observability tools signal failures, and AI SREs reason over data, they leave observability gaps regarding the actual state of running code. By utilizing runtime context, teams capture live execution data to accelerate production debugging, resolving incidents in minutes without requiring manual redeploy cycles.
Key takeaways
- Outage trends: In 2025 44% of organizations faced outages due to suppressed alerts, while 78% experienced incidents in which no alert fired at all.
- Cost of downtime: Organizations estimate production downtime costs at least $50,000 per hour.
- The SRE bottleneck has moved from detection to confirmation: When the right execution-level signal was never captured, investigations stall into redeploy-wait-retry cycles that can stretch resolution from minutes to hours.
- AI trust: 58% of Senior SRE leaders state that trusting AI depends on their ability to generate live runtime evidence on demand.
- Modern workflows: Solutions like Lightrun AI SRE enable fast resolution by combining AI reasoning over multi-source system data with live traces generated at the point of failure.
What are the core SRE challenges?
SRE teams are responsible for keeping production systems available, performant, and correct under real-world conditions. The site reliability engineering challenges they face today are fundamentally different from the ones observability tools were built to solve.
The issue is no longer about detecting that something broke. It is about confirming exactly what happened inside a complex distributed system, under pressure, even when the signals needed to prove it were never captured in the first place.
The following challenges track a single incident: a trade platform processing high-value trades where fraud validation fails silently. The core service is TradeExecutionService.java, which determines whether a transaction qualifies as high-value based on a totalCost field and a highValue flag.
Forty-seven minutes after a routine upstream schema update, fraud validation stops working correctly for every transaction above the $10,000 threshold. This case shows where investigations break down at every stage.
1. Incident Detection Without Context
Modern monitoring tools excel at detecting that something is wrong, but fail to provide the execution context needed to understand why they happened or where it actually started.
A P1 alert fires on the trade execution service, three services are yellow, a latency spike is visible on one endpoint, and a schema update was deployed 40 minutes ago. However, the alert carries no variable values, no code path, and no indication of whether these signals are causes or downstream symptoms of something upstream.
Without that execution context, engineers spend the first 20 minutes of the investigation just to confirm which of the three services is the actual starting point. According to the Lightrun State of AI-Powered Engineering 2026, 60% of engineering leaders identify a lack of visibility into live production behavior as the primary bottleneck in incident resolution.
When that missing context spans multiple services, the investigation compounds rapidly.
The core problem:
- Missing state: Alerts fire without the execution state that produced them.
- Manual correlation: Engineers manually correlate signals across multiple services before any real diagnosis begins.
- Lost time: Every minute spent confirming which service caused the problem is a minute not solving the root cause.
2. Root Cause Analysis Across Distributed Services
In distributed architectures, the service that throws the error is rarely the one that caused it. Tracing a failure back to its true origin across dependencies and configuration changes is where most investigation time is lost.
In our incident, the trade execution service starts rejecting high-value transactions above $10,000. As a result, the investigation begins in TradeExecutionService.java. Logs are reviewed, recent deployments are checked, and thresholds examined, but after two hours there is no conclusive evidence found.
The trade service works as designed, but silently evaluates the wrong data type: an upstream schema update began passing totalCost as a String instead of a BigDecimal.
The highValue flag was never set to true, fraud validation was never triggered, and every high-value trade was passed through unverified. No exception was thrown leaving the mismatch invisible to standard logs.
Why distributed root cause analysis is harder:
- Misleading alerts: The service that alerts is rarely the service that failed.
- Delayed failures: Upstream schema changes can create failures that surface downstream days later.
- Verification gap: AI correlation narrows the search space but cannot confirm the root cause without execution-level signals.
3. The Telemetry Blind Spot
Observability systems only surface what was instrumented before a failure occurred. When the signal needed to explain a specific failure was never captured, the investigation hits a wall that no amount of AI correlation can break.
In the trade incident, the existing logs confirm errors but capture nothing about what totalCost holds inside validateHighValueTrade() at the point of failure. They do not show what type of validation logic was expected, nor why highValue is evaluating to false for every transaction above the threshold. This is because that specific variable state was never instrumented.
The only path forward becomes manual redeploy cycle: the engineers must log the right line in TradeExecutionService.java, open a PR, get it reviewed, deploy it, wait for the failure to recur under the same conditions, to capture the necessary information.
Why this compounds quickly:
- Cycle time: Every redeploy cycle to capture missing signals adds hours to resolution time.
- Overhead: In large enterprises, each deployment requires change management approval, making every cycle even more costly.
- Resetting progress: Investigations often restart from zero because the necessary evidence did not exist at the right time.
The result is not just downtime, but longer investigation cycles based on incomplete data.
4. Toil and Repetitive Manual Triage
Even with AI tools in place, incident response remains manual when telemetry is incomplete. The gap between what the tools surface and what engineers actually need to confirm a root cause is where most of the toil lives, indeed 44% of APM and AI SRE investigations fail because the necessary execution-level data was never captured.
In the trade execution incident, the SRE correlates the latency spike with the schema update and hypothesizes that a timeout in the validation layer is causing the rejections. They add instrumentation to the timeout handler, only to find that the timeout is a symptom, not the cause. The entire cycle resets with another two hours added.
The real cause, totalCost arriving as a String and the highValue flag silently evaluating to false, was never captured because no one thought to instrument that specific line in TradeExecutionService.java before the incident began.
Manual triage vs automated runtime-aware triage:
- Manual triage: Open dashboards, correlate signals, form hypotheses, add logging, deploy, wait, and repeat,
- Automated with runtime context: Validate hypothesis against live execution state in minutes, without redeployment needed.
According to the Lightrun State of AI-Powered Engineering 2026 Report, developers spend an average of 38% of their weekly capacity on debugging, verification, and environment-specific troubleshooting. This highlights how much engineering time is lost not on building systems, but on trying to confirm behavior that should have been observable in the first place.
5. On-Call Burnout and Institutional Knowledge Loss
System reliability often depends on tribal knowledge held by senior engineers. They carry mental models of how services behave and which upstream contracts have drifted before, which type mismatches have caused silent failures in the validation logic, and which deployment combinations triggered edge cases in highValue evaluation. None of it is written down anywhere.
When these experts leave, an incident that once took 20 minutes to solve now takes six hours. This is because the team has to rebuild its contextual knowledge. Reliability becomes tied to who is on call rather than what the tooling can surface.
In the trade execution incident, resolving the issue depended entirely on whether an experienced engineer recognized that upstream schema changes could silently affect validation logic. Without that context, the team cycles through redeployments and false hypotheses under pressure.
6. Governance and Auditability in Regulated Environments
In regulated industries, every action taken during a production incident must be documented and traceable. This includes what was investigated, what changed, and what evidence supported each decision.
If an AI agent investigates the alert, and suggests a fix that works, a compliance auditor may still require the evidence trail supporting the remediation decision three weeks later. Traditional logs often show that a fix was applied but leave no record of which hypotheses were evaluated or ruled out.
Audits often include:
- Which signals the AI correlated across services.
- Which hypotheses were evaluated and ruled out before the fix was identified.
- What runtime evidence confirmed the root cause.
The team either reconstructs the investigation from memory or acknowledges the gap. In environments where audit findings carry regulatory and legal weight, neither answer is acceptable.
7. Fix Validation Before Deployment
Identifying a root cause is only half the battle; validating the fix actually under real conditions is where the final risk lives. Staging environments are often structurally incapable of providing this confidence.
The type correction fix is applied to the upstream schema, tested in staging against simulated load, and it passes. The team ships to production, and a subset of failures continues, because the specific combination of transaction volume above the $10,000 threshold, concurrent session count, and upstream response latency under real peak load does not exist in staging at the scale production runs.
The fix was validated against conditions that are not presented at runtime.
What staging cannot replicate:
- Scale: Real transaction volumes and concurrent session counts.
- Live patterns: Upstream response patterns under live load that affect how totalCost is passed between services.
- Data distributions: Specific clustering of transactions above the $10,000 threshold in ways that test data never reaches.
Production remains the only environment where a fix can be genuinely confirmed and every team that has shipped a staging-approved fix that broke in production has experienced exactly why no approximation of it is sufficient.
Understanding why these seven challenges persist requires looking at the layer beneath them, the observability and AI tooling that is currently in place, and where these fall short.
Why Production Became the Only Place Bugs Reveal Themselves
Site Reliability Engineering sits at the boundary between software development and operations, responsible for what happens after code ships. SRE teams own availability, latency, and correctness in production, and increasingly, the hardest part of the job is managing the complexity that only surfaces once that code is live.
Reliability failures used to come from missing logic, or bugs catchable in testing. Today SRE teams face a different kind of failure: issues that only surface when real traffic hits, concurrent sessions collide,, or data volumes expose edge cases that test suites never considered.
The Limits of Staging
Staging environments are structurally incapable of replicating the conditions of a live distributed system. Several factors ensure that production remains the only environment where certain bugs reveal themselves:
- Peak volume deadlocks: A payment service handles concurrent requests correctly in staging, but deadlocks under Monday morning peak volume
- Silent type mismatches: A fraud validation flag works against test data, but silently fails when an upstream service passes a string instead of an expected integer.
- Cascading regional failures: A configuration change with no effect in single-instance staging causes cascading timeouts across 40 replicas in three regions
The AI Instability Factor
The situation is compounded as AI accelerates code generation without accelerating the ability to validate it. According to the State of AI-Powered Engineering 2026 Report, engineering teams average three manual redeploy cycles to verify a single AI-generated fix.
This is corroborated by Google Cloud DORA 2025 report that found AI adoption correlates with an almost 10% increase in delivery instability. The bottleneck is no longer writing code but proving it works correctly under conditions that only exist in production. This reality is the primary driver behind modern site reliability engineering challenges. It is this problem that runtime context solves.
Why Observability Can Detect Failures but Not Prove Them
Traditional observability tools were designed for visibility rather than verification. Application Performance Monitoring (APM) tools and distributed tracing show where failures propagate, but they cannot confirm actual runtime execution behavior..
These tools depend entirely on instrumentation configured before a failure occurs. entirely on instrumentation configured before a failure occurs. If the critical signal wasn’t pre-captured, the tool can only offer a historical record of events rather than live proof.
The Architectural Constraint
A review of the leading continuous monitoring tools reveals the same architectural constraint:
- They observe systems from the outside rather than from inside running services.
- They correlate signals but cannot confirm root causes when the critical data was never captured.
- AI operating on incomplete telemetry produces a shorter list of probable causes rather than a confirmed one
According to the State of AI-Powered Engineering 2026 Report, there is a significant trust issue among leadership.
77% of engineering leaders report low or no confidence that their current observability stack provides enough information for reliable automated root cause identification. Closing this gap requires a fundamentally different approach, moving beyond pre-captured telemetry to runtime context.
How Runtime Context Turns Reliability into Evidence-Based Engineering
Reliability has traditionally been reactive, built entirely around what was captured before the failure occurred. When critical signals are missing, investigation stalls regardless of whether it’s a human or AI-led investigation or how robust the AI’s reasoning is.
Runtime context changes this by giving teams and AI agents direct access to execution-level behavior while systems are running. Instead of inferring what might have happened, engineers can observe what actually happened and resolve incidents based on evidence rather than hypotheses.
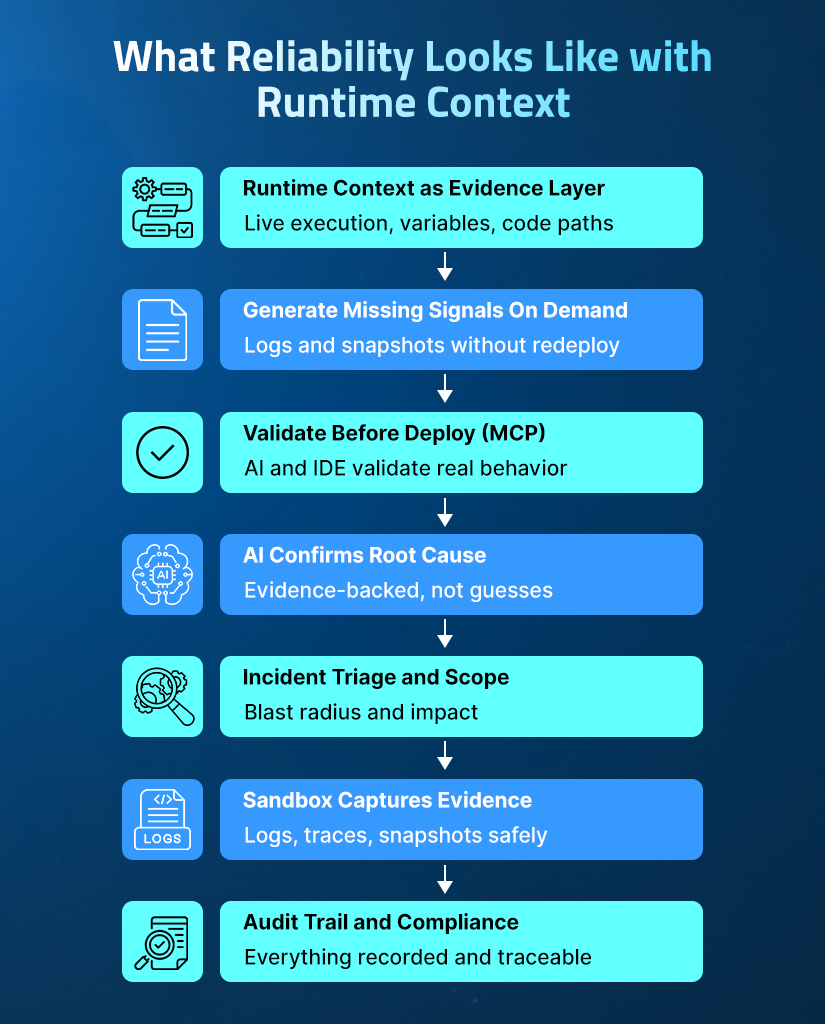
To further explore how to resolve site reliability engineering challenges, we pick up the same trade execution incident example and show how runtime context resolves each challenge at every stage of the investigation.
1. Runtime Context as the Evidence Layer
Runtime context captures what is actually executed, at the exact line and request. It is collected under the conditions that caused the failure being investigated.
In the trade execution incident, the existing logs confirm errors, they miss the critical state inside validateHighValueTrade() at the moment of failure.
Runtime context answers vital questions on demand under real traffic:
- Variable state: What is the value and type of totalCost at this exact line?
- Logic evaluation:Why highValue evaluates to false for transactions above $10,000
- Dependency state: The condition of upstream dependencies during validation.
2. Generating Missing Signals On Demand
Traditional observability is limited by what was instrumented at build time. It can only query this instrumentation during incidents.
In our trade execution incident, the SRE can inject a conditional snapshot into TradeExecutionService.java that triggers only when totalCost > 10000.
The Lightrun Sandbox executes this in a patented read-only environment without touching the live service, triggering a redeployment, and not affecting users. Within 60 seconds, as real transactions flow through the service, the system captures:
| totalCost: 72315.4 (type: String) highValue: false quantity: 313 |
This reveals that the totalCost field arrives as a String but the validation logic expects a BigDecimal. This causes a silent failure, without throwing an exception. This closes the confirmation gap from the SRE Challenge 3: The Telemetry Blind Spot in 60 seconds without a redeploy.
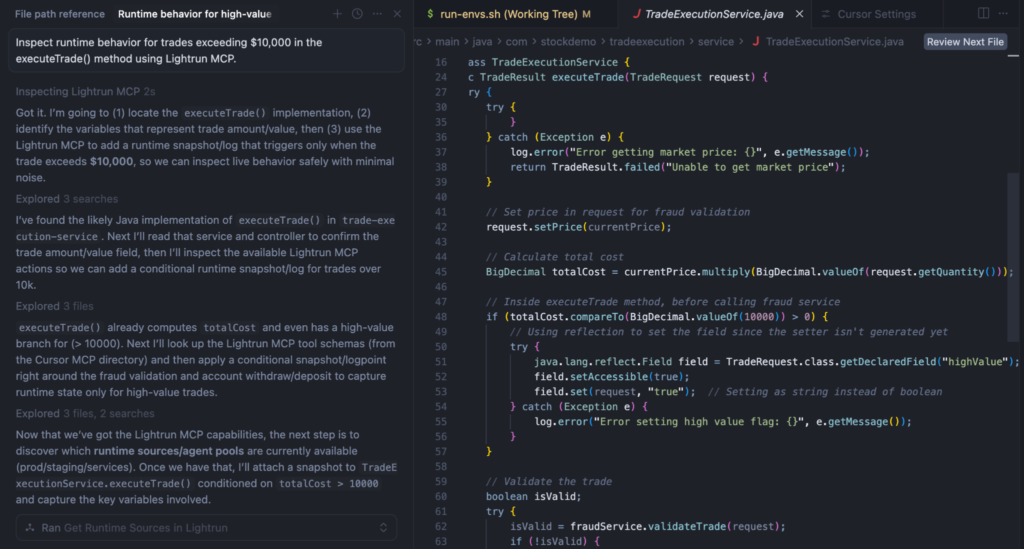
3. Validating Assumptions Before Code Ships
Had the engineer who deployed the upstream schema update used Lightrun’s Runtime Context MCP (Model Context Protocol) integration before merging the change, they could have observed how totalCost was being consumed downstream under live traffic, catching the type mismatch before it ever reached production.
For developers working inside JetBrains IDEs, Lightrun AI SRE provides the same AI-powered investigation directly inside IntelliJ IDEA, PyCharm, and WebStorm. Learn how runtime context for AI coding agents works in practice.
Before a merge, engineers can use Lightrun MCP to:
- Observe behavior: See how execution paths in TradeExecutionService.java handle live production traffic.
- Validate contracts: Check variable states and type contracts between upstream and downstream services.
- Catch mismatches: Identify type errors before they reach production.
- Ensure safety: Propose conditional snapshots at specific lines without touching a deployment pipeline.
In the screenshot below, using Cursor with Lightrun MCP, the AI has identified the relevant code path, located the variables involved, and proposed where to add a conditional snapshot, all without writing a single log statement. The type mismatch would have been caught here, before the schema update ever shipped.
In the screenshot below, the AI has identified the relevant code path, located the variables involved, and proposed where to add a conditional snapshot, all without writing a single log statement. The type mismatch would have been caught here, before the schema update ever shipped.
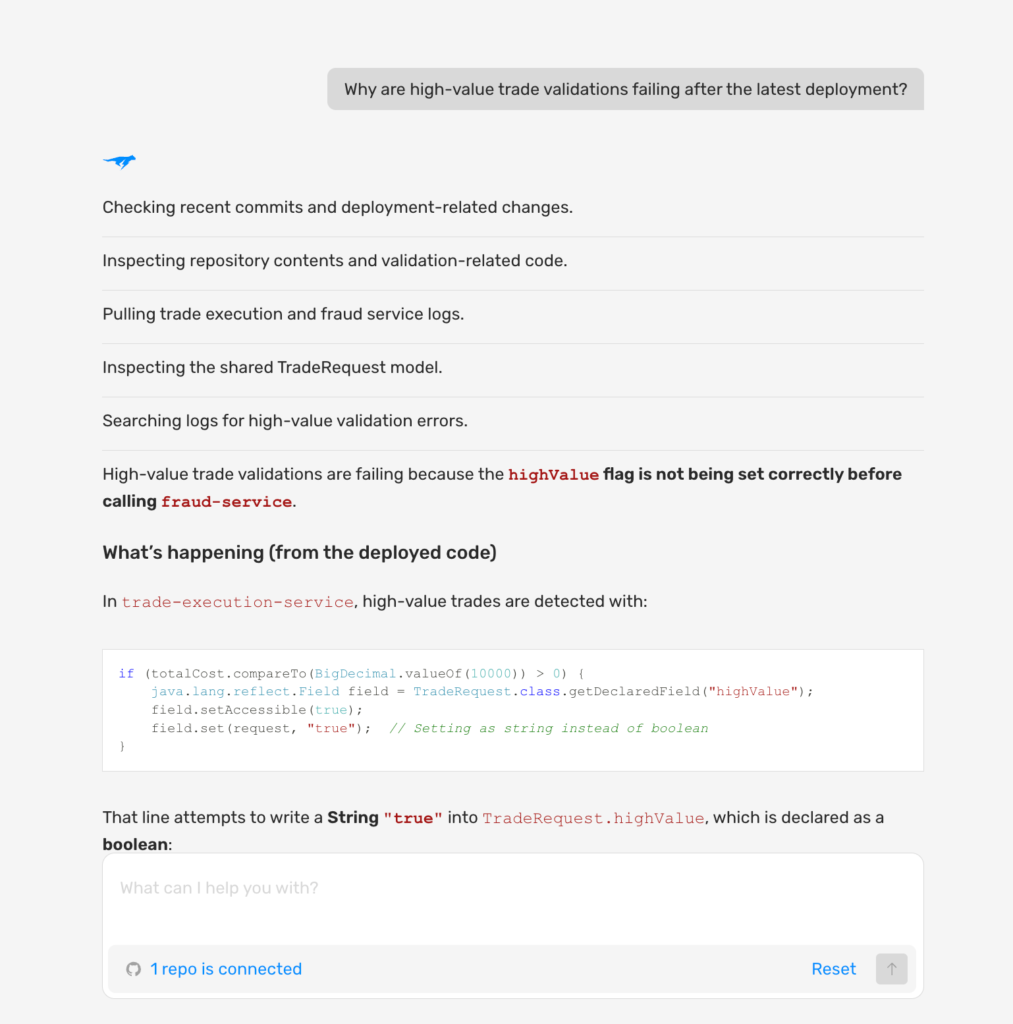
4. Confirming Root Causes with AI in Live Execution
In the trade execution incident, Lightrun AI SRE correlates the snapshot data against deployment history in parallel with the Sandbox capture. It surfaces the confirmed root cause with commit-level attribution: the type mismatch was introduced in the upstream schema update deployed 47 minutes before the incident. Every trade above $10,000 has been passing fraud validation without triggering the highValue check since that deployment.
In a single session, Lightrun AI SRE:
- Correlates changes: Reviews recent deployments and correlates changes with the failure timeline
- Traces failures: Points to the specific line in TradeExecutionService.java
- Validates hypotheses: Confirms the String vs BigDecimal type mismatch hypothesis against the live data
- Provides testable evidence: Delivers a confirmed root cause with a full evidence trail attached.
This eliminates the triage cycle. Rather than forming a hypothesis about a validation timeout, deploying instrumentation, and discovering two hours later that the hypothesis was wrong, Lightrun AI SRE validates each hypothesis against live runtime evidence before surfacing it, confirmed or ruled out in the same session, without a single redeployment.
In the screenshot below, the AI has traced the failure to the specific line in TradeExecutionService.java and surfaced the confirmed root cause with the full evidence trail.
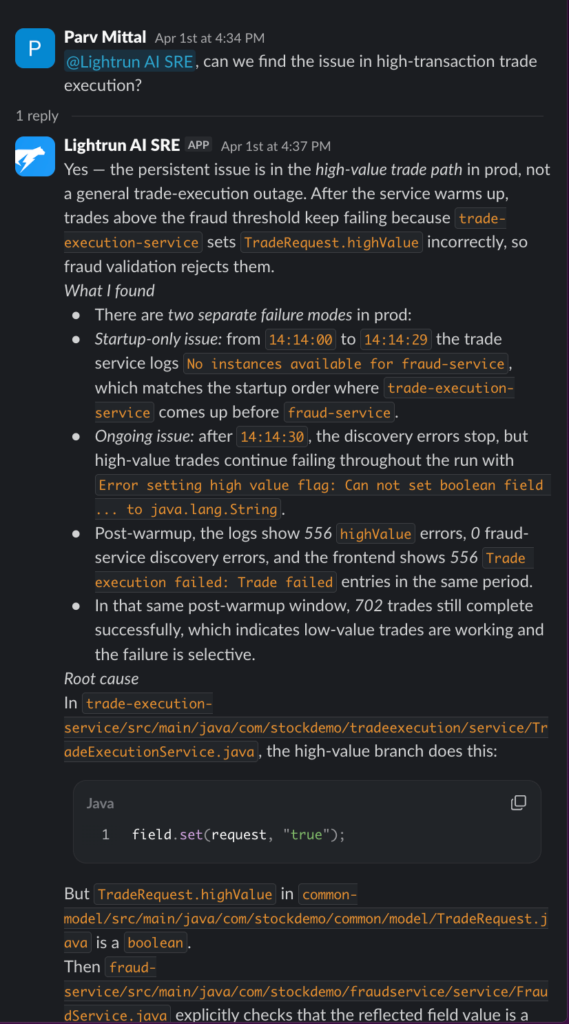
5. Understanding Incident Scope Before Investigating
In the trade execution incident, tagging Lightrun AI SRE in the Slack incident channel immediately identifies the incident scope. It flags that the trade execution service in US-EAST-1 is affected, impacting 12% of active sessions, and 100% of transactions above $10,000 are failing.
The AI SRE also flags that the schema update deployed 47 minutes ago is the correlating change. This directly addresses Challenge 1, when a P1 alert fires across three yellow services with no execution context. Lightrun AI SRE identifies the actual starting point before the SRE opens a single dashboard.
Lightrun AI SRE connects to tools like Datadog, New Relic, Prometheus, Grafana, AWS, GCP, and Kubernetes to map affected services and measure user impact automatically. As it integrates with Slack, Microsoft Teams, and PagerDuty, the entire triage conversation happens inside the tools where on-call engineers already work.
In a single session, Lightrun AI SRE delivers:
- Dependency mapping: Affected services mapped across the full dependency chain.
- Real-time impact: User impact is measured live before manual investigation begins.
- Resolution steps: The root cause confirmed with runtime evidence attached and the next investigation steps are proposed directly in the incident channel.
In the screenshot below, the AI has responded to a Slack mention with a complete investigation, all inside the incident channel.
6. Capturing Runtime Evidence Inside the Sandbox
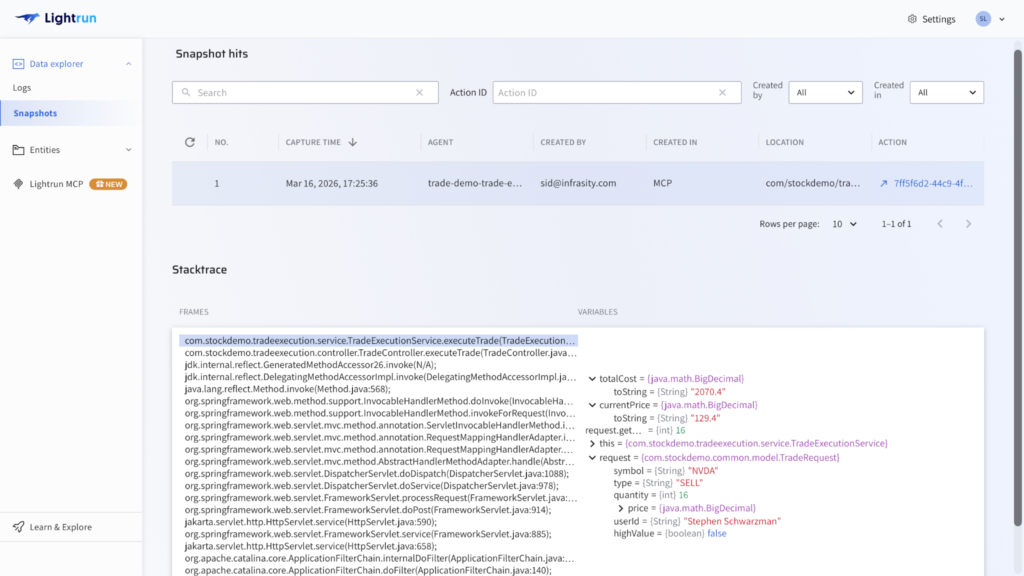
The Lightrun Sandbox is the safe-execution layer enabling these steps without performance overhead. The conditional snapshot that captured totalCost: 2070.4 (type: String), highValue: false, and quantity: 16 was collected here, against real production traffic, at the exact line of failure in TradeExecutionService.java, with no redeployment and no impact on users.
Lightrun supports four types of sandboxed instrumentation:
- Dynamic logs: I at any specific line of code.
- Snapshots: Capturing full variable state at a point in execution.
- Metrics: Tracking behavior over time.
- Dynamic traces: Following a request across services.
The Lightrun AI SRE operates on top of this evidence layer to validate hypotheses, confirm root causes, and generate fix proposals.
In the screenshot below, a live snapshot has been captured at the specific line of code in TradeExecutionService.java. The variables panel shows totalCost: 2070.4, quantity: 16, and highValue: false, the exact runtime state that confirmed the root cause under real production traffic.
7. Maintaining a Full Audit Trail for Enterprise Environments
In the trade execution incident, the full investigation is captured automatically the moment it closes, giving compliance teams, on-call engineers, and auditors a complete structured record with no memory reconstruction required.
What gets captured and why it matters:
- Snapshot injection and variable values from TradeExecutionService.java the exact runtime evidence that confirmed the root cause.
- Deployment correlation and hypothesis trail which changes were evaluated and ruled out before the type mismatch was identified.
- Fix validation result confirmation that the fix held against real transaction volumes above the $10,000 threshold that staging never reproduced.
- A full postmortem is accessible to every engineer on the team, so knowledge of upstream type contract failures is documented rather than locked in one person’s memory.
Lightrun meets PCI-DSS, SOC 2, and other enterprise governance requirements in regulated environments where many AI SRE tools cannot operate without compliance risk.
Total time from first alert to confirmed root cause: under 10 minutes. The same investigation through traditional observability typically takes three to four hours, and that difference reflects a fundament
How Lightrun Addresses Each SRE Challenge
The trade execution walkthrough above shows these seven capabilities in action. Here is how each challenge maps directly to a Lightrun capability:
| SRE Challenge | How Lightrun Resolves It |
| Alert without context | Lightrun AI SRE maps the blast radius and the surface execution context before manual investigation begins. |
| Distributed RCA | AI grounded in live cross-service behavior confirms root cause with commit-level attribution. |
| Telemetry blind spot | Conditional snapshots generate missing signals on demand without redeployment. |
| Manual toil | Lightrun AI SRE validates hypotheses against live runtime evidence in a single session. |
| Knowledge loss | Full investigation trail and postmortem captured and accessible to the entire team. |
| Governance gaps | Structured audit trail of every AI action and finding meets PCI-DSS and SOC 2 requirements. |
| Fix validation risk | The Lightrun Sandbox is used to validate fixes against real production conditions before deployment. |
Conclusion: Reliability Is Only as Strong as the Evidence You Have
SRE teams are not limited by a lack of tools. They are limited by a lack of reliable evidence when it is needed most. Every investigation that stalls, or results in a repetitive redeploy cycle is a symptom of an architectural deficiency: reliance on pre-captured telemetry.
While detection and correlation have improved, true confirmation still depends on whether the right execution data existed before the failure occurred. If that data is missing, even the most advanced AI can only suggest probable causes.
The pressing of site reliability engineering will not be solved by faster correlation alone. It requires execution-level truth generated on demand from within running systems under real conditions. While AI can accelerate the investigation, only runtime context can confirm the answer.
Lightrun is the only platform built to close that gap, with live, runtime-grounded reliability from the first line of code written to the final resolution of a production incident, without redeployments.
Ready to solve your SRE challenges?
Frequently asked questions
The primary shift is from detection to confirmation. Teams can surface failures faster, but confirming the root cause still depends on capturing the right execution signals, which traditional observability stacks often miss.
Most AI tools operate on pre-captured telemetry and can only correlate existing signals. If a critical execution-level signal was never instrumented, the AI cannot validate what actually ran and can only surface probable causes rather than confirmed ones.
It is the gap between what an observability system was instrumented to capture at build time and what engineers actually need during a live investigation. Any question not anticipated before code ships requires a new instrumentation pass and redeployment.
Runtime context is live, execution-level evidence of how a system behaves in production: variable states, execution paths, conditional logic branches, and dependency responses under real traffic, at the exact moment they occur. It is the data that confirms what is actually happening, and is the ground truth for engineering teams.
While traditional observability tools observe systems from the outside using pre-captured telemetry. Lightrun operates inside running services at the execution level, attaching to live processes through a production-safe agent, generating missing evidence on demand at specific lines of code, and confirming fixes inside the Sandbox before they reach users, all without redeployments, service restarts, or meaningful performance overhead.
What are the biggest site reliability engineering challenges in 2026?
The primary shift is from detection to confirmation. Teams can surface failures faster, but confirming the root cause still depends on capturing the right execution signals, which traditional observability stacks often miss.
Why do AI SRE tools still miss production failures?
Most AI tools operate on pre-captured telemetry and can only correlate existing signals. If a critical execution-level signal was never instrumented, the AI cannot validate what actually ran and can only surface probable causes rather than confirmed ones.
What is the telemetry blind spot?
It is the gap between what an observability system was instrumented to capture at build time and what engineers actually need during a live investigation. Any question not anticipated before code ships requires a new instrumentation pass and redeployment.
What is a runtime context in software engineering?
Runtime context is live, execution-level evidence of how a system behaves in production: variable states, execution paths, conditional logic branches, and dependency responses under real traffic, at the exact moment they occur. It is the data that confirms what is actually happening, and is the ground truth for engineering teams.
How is Lightrun different from traditional observability tools?
While traditional observability tools observe systems from the outside using pre-captured telemetry. Lightrun operates inside running services at the execution level, attaching to live processes through a production-safe agent, generating missing evidence on demand at specific lines of code, and confirming fixes inside the Sandbox before they reach users, all without redeployments, service restarts, or meaningful performance overhead.