
Lightrun’s Product Updates – Q1 2023
During the past quarter, Lightrun has been busy at work producing a wealth of developer productivity tools and enhancements, aiming for greater troubleshooting of distributed workload applications and cost efficiency.
Read more below the main new features as well as the key product enhancements that were released in Q1 of 2023!
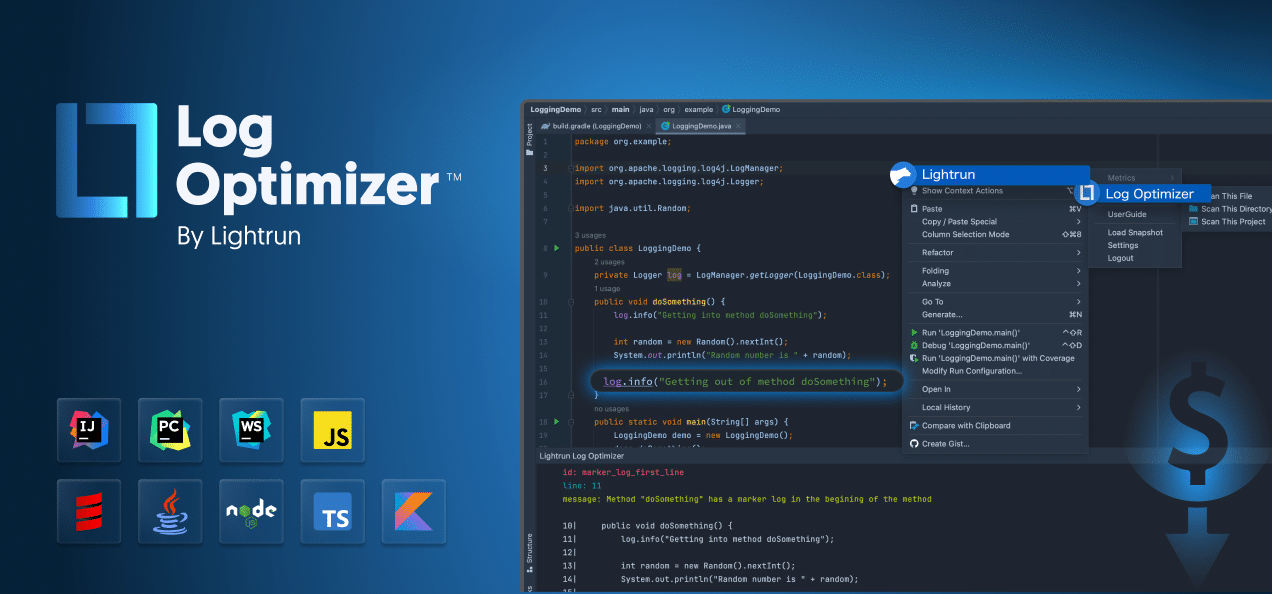
📢 NEW! Lightrun Log Optimizer(™) Launched!
Lightrun’s Log Optimizer™ is a new and unique log-optimization and cost- reduction solution that is part of the Lightrun IDE plugins. It allows developers to scan their source code (a single file or complete project) across the supported runtimes (Java, Python, and Node.js) for log waste, and get in seconds the log lines that are replaceable by Lightrun’s dynamic logs.
By using this solution developers can save up to 40% of their logging costs, and reduce around 60% of logging noise volume. For more information about the Log Optimizer solution, visit our website.
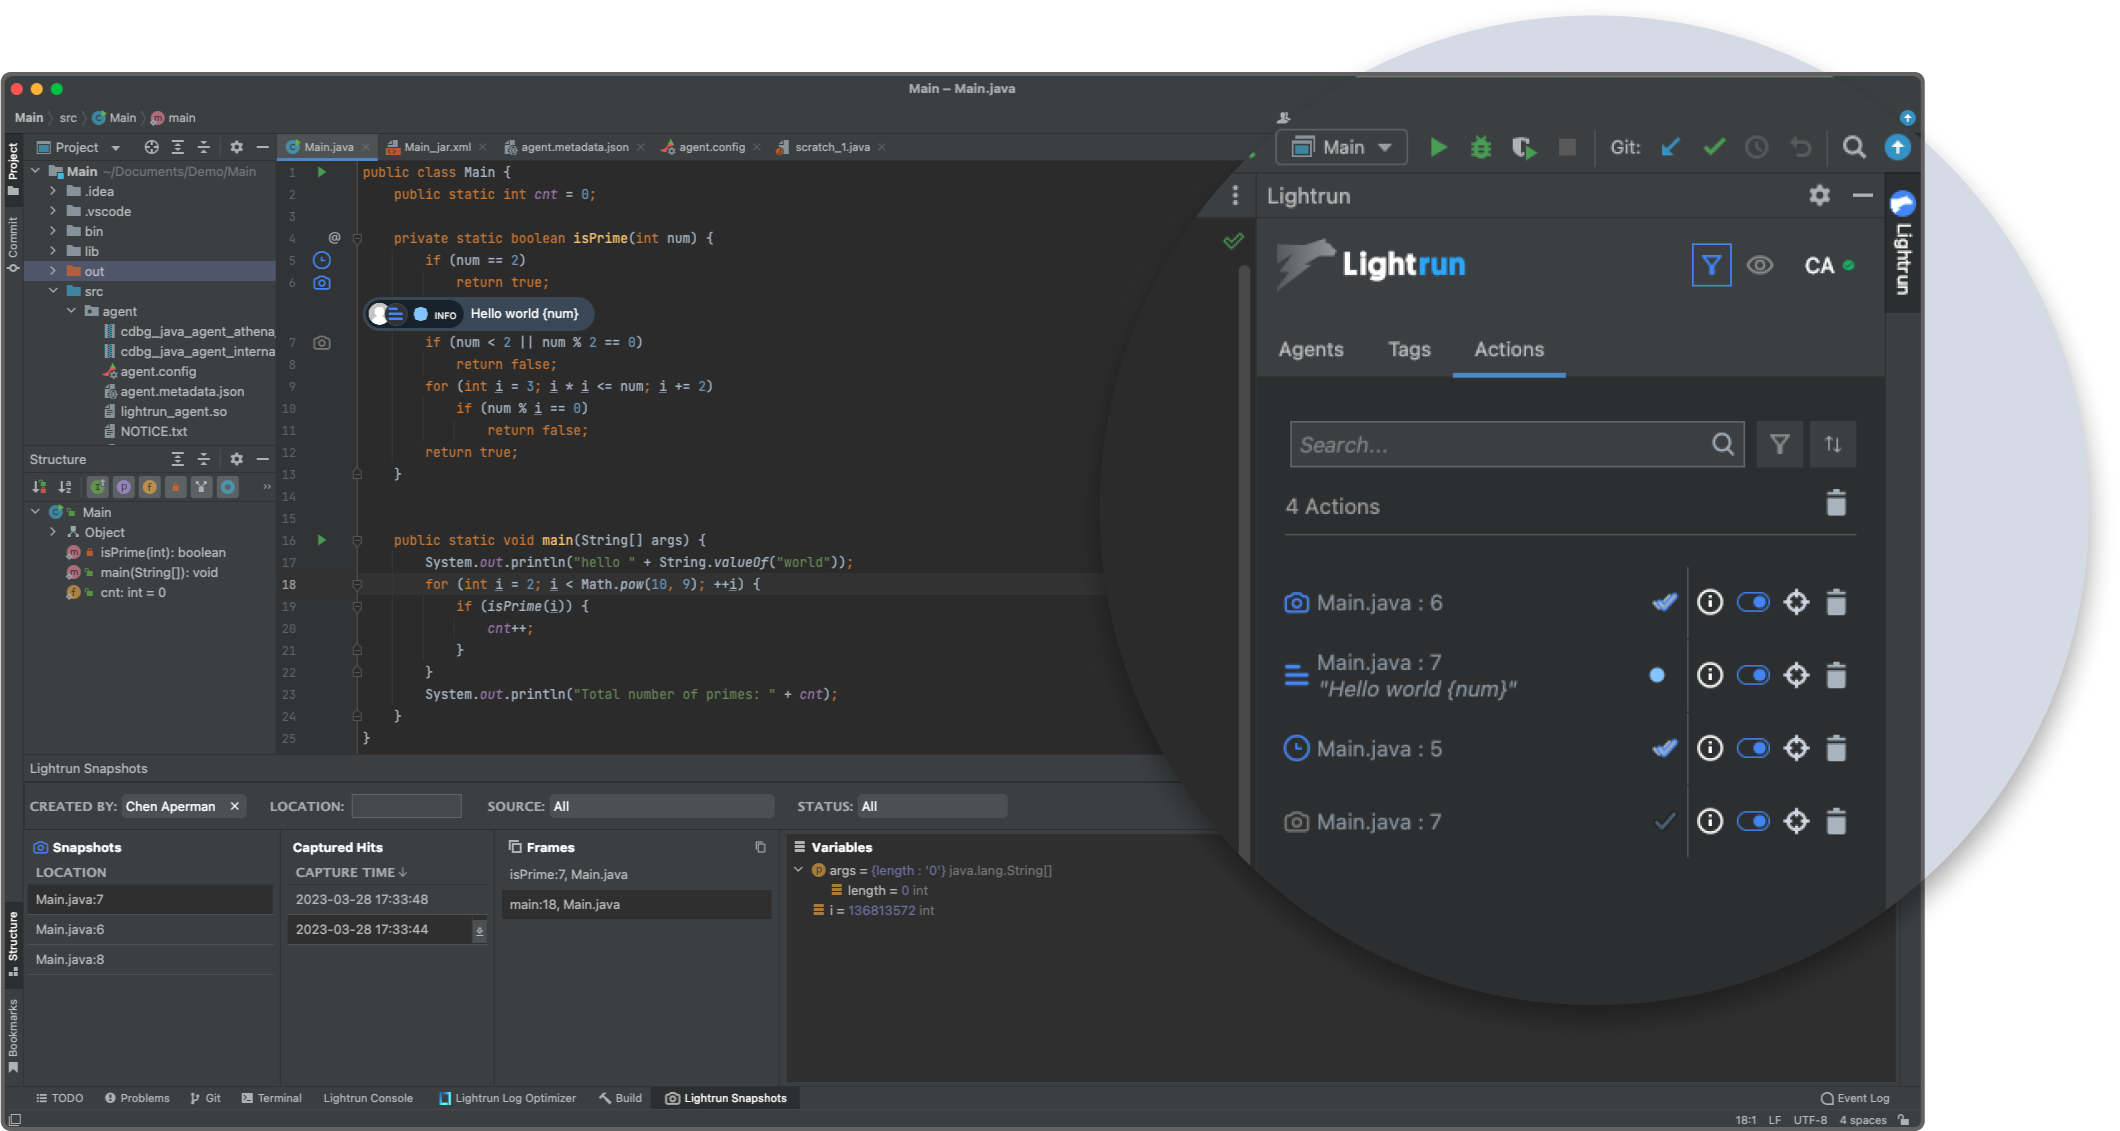
📢 New! Actions Tab Added to Lightrun IntelliJ IDE and VSCode Plugins
With the new tab, developers can better manage their existing and new Lightrun actions (Logs and Snapshots). This feature helps developers more easily gain insights while debugging. Within the new tab, they can filter actions and select the ones they care about based on their status: Error, Active, or Expired.
📢 NEW! Additional Java runtime support
The Lightrun JVM agent now supports JDK 18 and JDK 19.
Developer Productivity & User Experience Enhancements 🎉
Lightrun strives for developer productivity and efficiency throughout the troubleshooting workflow. With that in mind, we have implemented several capabilities and enhancements to our platform. Read more about them below.
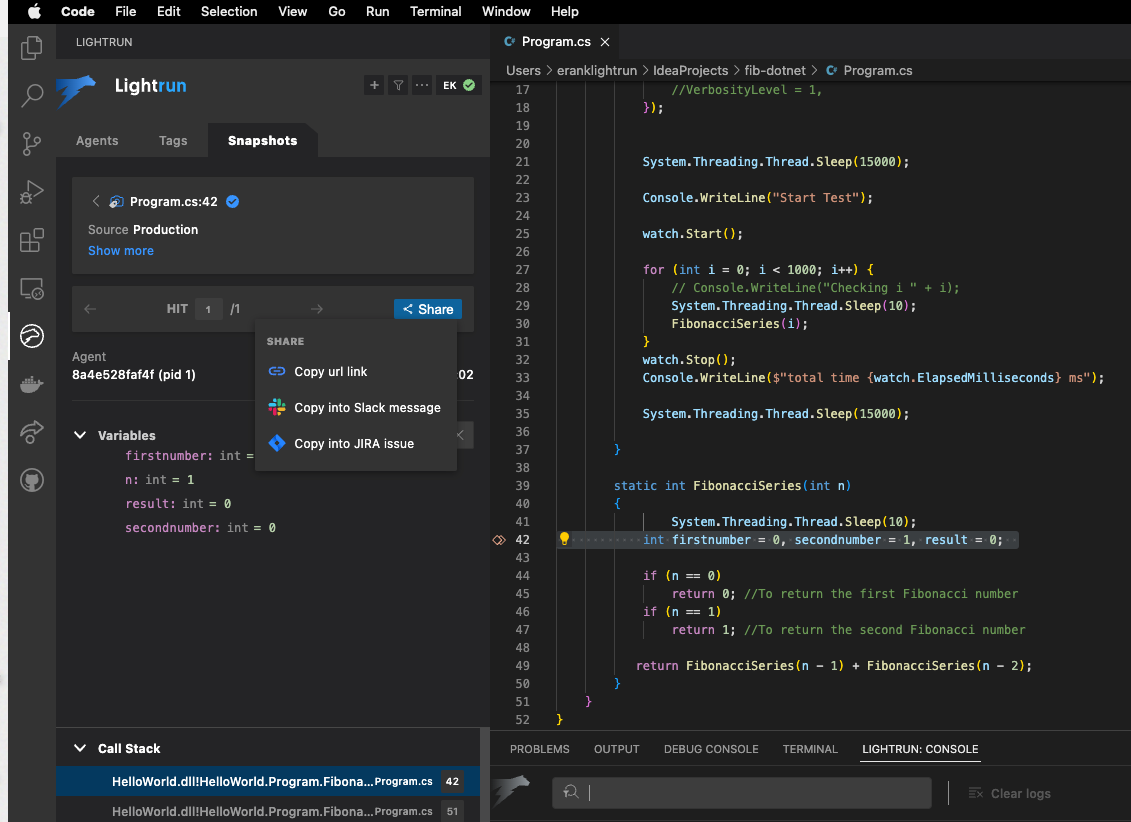
Sharing Snapshot Hits!
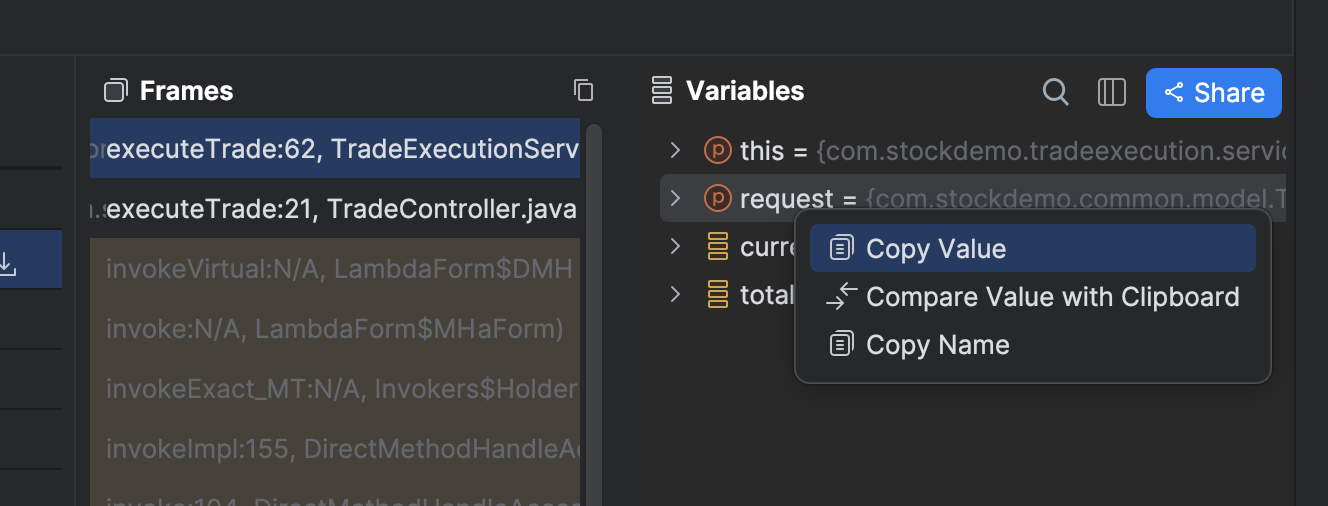
With this new feature, developers can share a snapshot result with their teammates for additional review. This capability allows developers to better collaborate and get help in resolving complex issues. This should expedite fixing complex issues and reduce the overall MTTR. It helps unify troubleshooting visibility among team members.
To use this new feature within the IDE plugin, upon capturing a snapshot hit, use the Share button and choose from among the available options: Copy link, share via Slack, share as Jira issue.
Additional Supported Target Outputs for Logs and Metrics
Users can now select specific integrations (logz.io for logs / Prometheus for metrics) as their action output targets. This option makes it easier to configure where to view your output in addition to the Lightrun Console. For more information, see Action Output Target.
Lightrun Log Console Enhanced for Greater User Experience
We have added filename and line number to the log output format, as well as the ability to right-click and navigate to the relevant line using the “goto” action, or copy the entire row.
Lightrun VSCode Plugin Enhanced for Better Snapshots Consumption
- Lightrun users can now view snapshot hits created by other users in their organization. This contributes to cross team collaboration, visibility into investigations by other teammates, and a more streamlined troubleshooting process.
- Snapshot hits data now loads much faster. This shortens the time to insights and expedites the overall troubleshooting process. In addition, we’ve extended the variable tree depth to give more information in every snapshot.
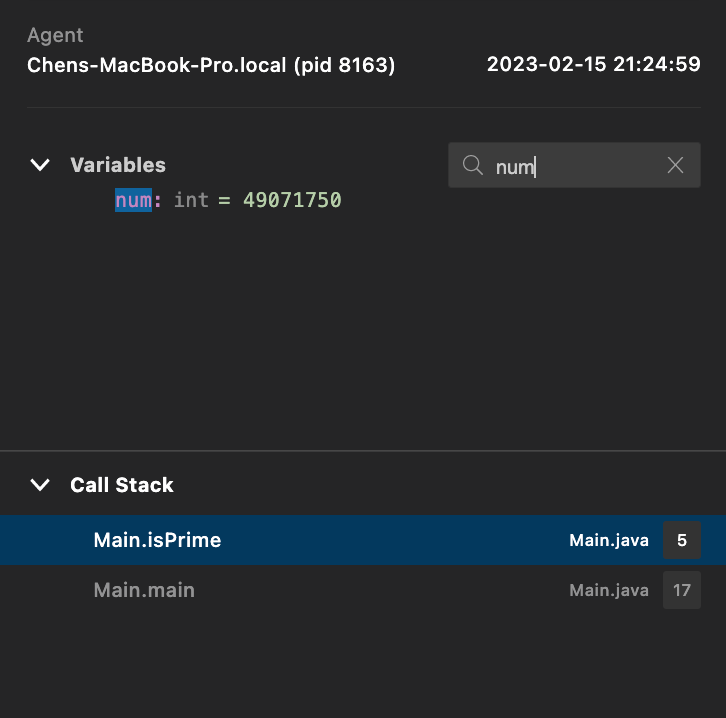
- We have added the ability to search a snapshot to help you find the data you’re looking for, faster.
Enhanced User Experience: Collapse and Expand Snapshots
In the latest release, we’ve improved the user experience around snapshots by providing an expanded variables section as seen in the below screenshot. The view below is of a Jetbrains IDE; VSCode has been similarly enhanced.
Not a Lightrun user just yet? Start using Lightrun today, or request a demo to learn more.
It’s Really not that Complicated.
You can actually understand what’s going on inside your live applications.


