Research System Behavior with Distributed Tracing
See how your application logic and infrastructure behave in live production to validate assumptions and solve complex architectural questions.
Study your system architecture under real conditions
Replace assumptions with evidence by observing how your distributed system actually behaves under pressure.
Trace real
execution paths
Follow how requests flow across services under live traffic instead of reconstructing them afterward.
Connect code
to infrastucture impact
See how application logic affects database load, API latency, cache behavior, and cloud resource usage.
Inspect live
configuration state
Check environment variables, feature flags, memory state, and deployment conditions affect execution.
How Lightrun enables deep code and system research
Lightrun inserts read-only instrumentation in live sandboxed systems,
so engineers can explore behavior without redeploying or altering code
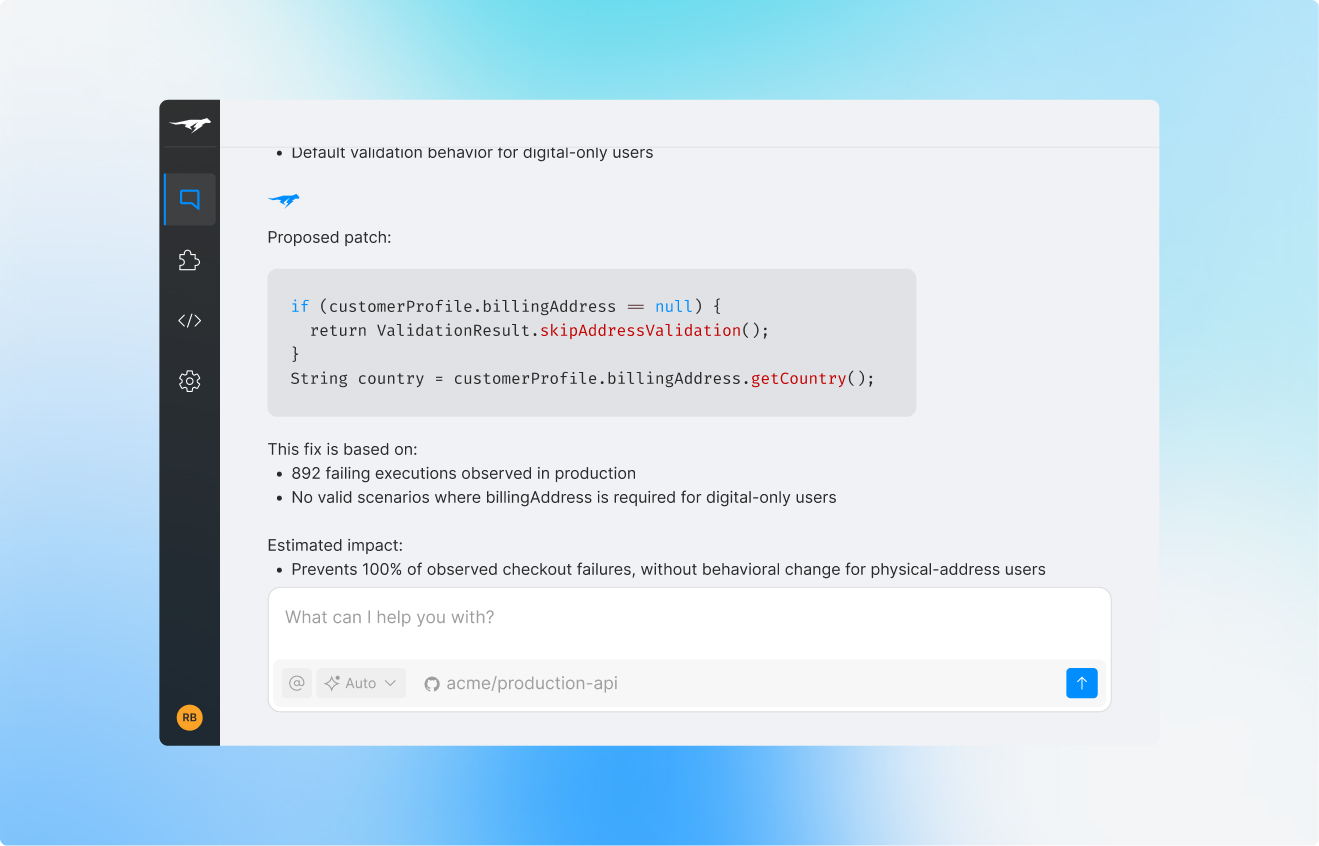
Ask precise questions
about live code
Validate exactly how a specific function behaves under real traffic before making changes.
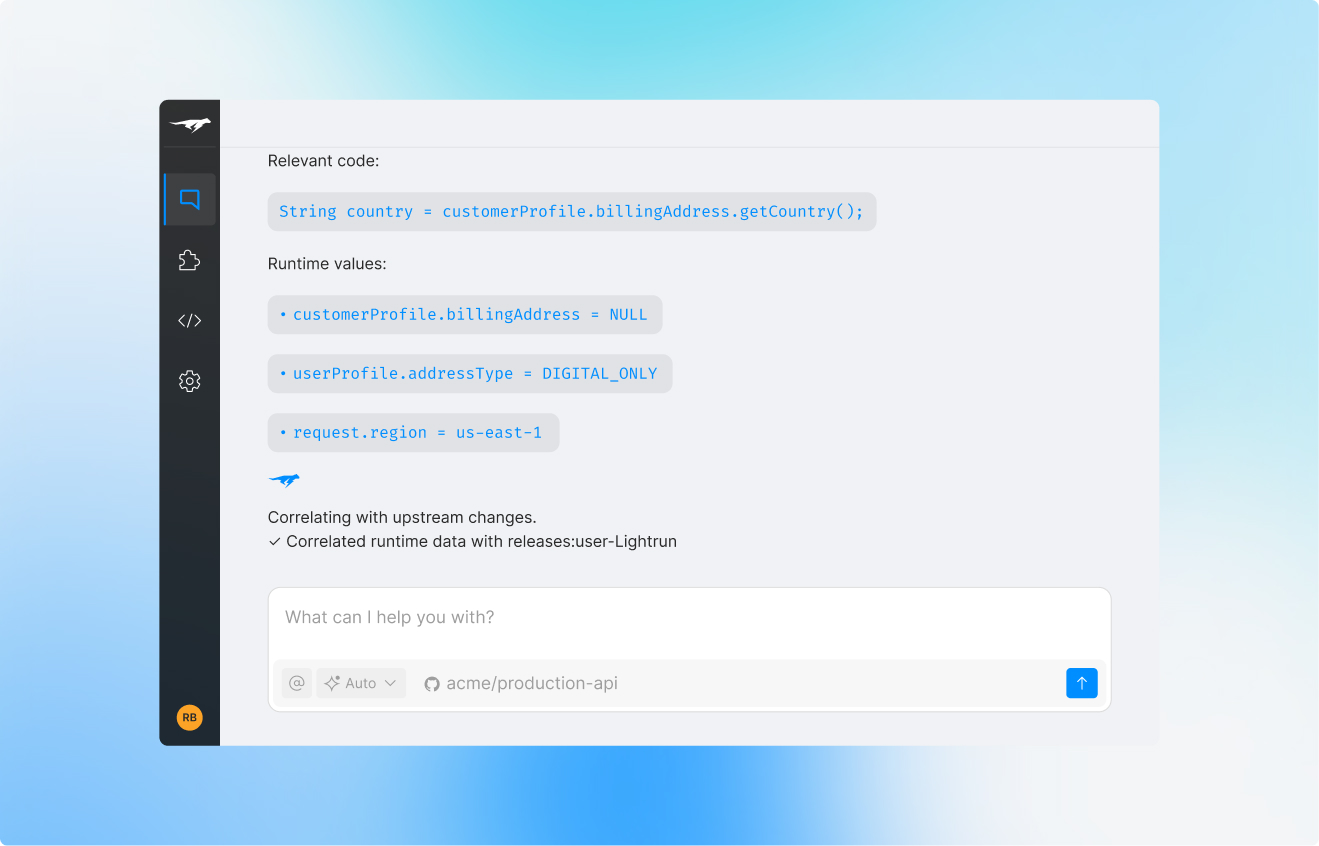
Confirm how configuration
and runtime state influence behavior
Verify whether feature flags, environment variables, or memory state are affecting performance or failures, without complex reconstructions.

Understand downstream
service behavior
Confirm whether latency, failures, or resource spikes originate in your code or in external dependencies.
Build a complete
system narrative
Combine runtime evidence with telemetry, codebase, and infrastructure signals to understand how components interact under load.
