Deterministic vs Probabilistic AI Engineering Explained
Jul 07, 2026 / Updated: Jul 22, 2026

Deterministic processes carry one guarantee: the same input will produce the same output. That guarantee built the entire observability stack. AI broke that contract by reasoning in terms of probability. The same input can now produce different outputs, whether from AI-generated code that carries assumptions invisible in staging, or from distributed systems where timing creates failures that no pre-captured telemetry can anticipate.
Key Takeaways
- Deterministic engineering assumes that the same input produces the same output, allowing engineers to pre-instrument systems to anticipate predictable failure modes.
- Non-deterministic behavior in AI is intentional by design: LLMs predict likely next actions rather than execute fixed logic. This probabilistic nature is their strength, not a flaw.
- The challenge is not making AI deterministic but constraining its reasoning within the live runtime environment so that it chooses the appropriate execution path rather than one of many technically valid alternatives.
- Traditional observability tools were built for deterministic failures. They fail in non-deterministic failures because the evidence needed to diagnose unanticipated behavior was never captured.
- Runtime context narrows AI’s search space by grounding it in live execution evidence, turning probabilistic inference into a confirmed root cause without redeployment. According to Lightrun’s State of AI-Powered Engineering 2026 report, 60% of engineering leaders cite lack of visibility into live production behavior as their primary bottleneck in incident resolution.
How Deterministic Engineering Made Reliability Predictable
For most of software engineering’s history, the deterministic contract held. Everything in the reliability stack was built on top of it.
How Did Deterministic Systems Let Engineers Pre-Instrument Failures?
Think about a payment processing service at a fintech company. Every time a transaction comes in with the same amount, account, and merchant, the outcome is identical. The validation logic runs in the same order.
The database write follows the same path, and the response carries the same structure.
Engineers knew this, so they could deliberately instrument for it. They added a log where the database connection was acquired and set an alert on the connection pool metric. They wrote a test that replicated the exact failure mode they were worried about, ran it in staging, and trusted the result because staging and production shared the same behavioral contract.
This predictability made reliability tractable:
- You could pre-instrument: Log statements were written at deployment time because engineers knew where failures would manifest.
- You could write alert rules: If you understood the inputs, you knew which metric would move when something broke.
- You could reproduce failures: Because the system was deterministic, staging could replicate production conditions well enough to confirm a hypothesis.
- You could trust your telemetry: The observability stack was built from the same assumptions as the system it monitored.
Why Every Observability Tool Was Built on Deterministic Engineering
Datadog, Prometheus, New Relic, and the observability platforms that followed are fundamentally pre-capture systems. Engineers decide at deployment time what to log, which metrics to expose, which thresholds to alert on, and which traces to propagate. The underlying assumption is that engineers can anticipate system behavior well enough to make those decisions before a failure occurs.
Imagine an SRE setting up monitoring for OrderIngestionService. They know it can fail when the upstream inventory API is slow, so they add a trace on the API call. They know memory spikes under batch loads, so they set a threshold at 85%. They know the queue depth can grow if the consumer falls behind, so they add a metric for that too.
Six months later, that entire monitoring setup works perfectly because the failure modes they anticipated are the ones that appear. The cycle is: an alert fires, the engineer sees the log, the hypothesis is confirmed, and a fix is applied. It works because the evidence was written before it was needed.
That world still exists for purely deterministic systems. The problem is that production no longer runs exclusively on them, and what most of the industry still calls “telemetry” is a historical record, not a live one. It tells you what the system did, not what it is doing right now.
What Non-Deterministic Engineering Looks Like in Production Today
Non-deterministic systems break the rule that made reliability tractable. The same input no longer guarantees the same output. In modern production, this happens in three distinct ways, and none of them is going away.
AI Agents Produce Different Root Causes for the Same Incident
An on-call engineer sends the same incident description to an AI agent twice within 10 minutes. The first run focuses on a database query timeout and suggests adding an index. The second run identifies a thread pool configuration mismatch and recommends increasing the worker count.
While both hypotheses are plausible, neither is guaranteed to be correct.
| Run 1 → Database query timeout. Recommendation: add an index on orders.user_id Run 2 → Thread pool saturation. Recommendation: increase WORKER_THREADS from 8 to 24 |
The AI is not malfunctioning. At non-zero temperature settings, LLMs sample from a probability distribution rather than executing fixed logic. The same prompt produces a different most-likely explanation on each run.
That variability is a feature. An agent that investigated every incident with identical deterministic logic would be far less capable than one that reasons flexibly across problem types.
The same probabilistic reasoning that makes agents powerful at investigation also shows up in how they generate code, and that is where things get complicated in production.
AI-Generated Code Injecting Probabilistic Behavior into Deterministic Environments
A backend team asks Claude Code to improve the retry logic in TradeExecutionService.java. The generated code looks clean, passes code review, and handles every test case correctly. What nobody notices is that the retry handler does not check whether the connection pool is available before retrying.
| // AI-generated retry handler — passes staging, breaks at 847 concurrent requests public void executeWithRetry(TradeRequest request, int maxAttempts) { for (int attempt = 1; attempt <= maxAttempts; attempt++) { try { tradeRepository.save(request); return; } catch (TransientException e) { if (attempt == maxAttempts) throw e; Thread.sleep(BACKOFF_MS * attempt); } } } // Missing: no connection pool check before retry // At 847 concurrent requests, pool exhausts and threads hang indefinitely |
In staging with 12 concurrent users, this is invisible. In production, with 847 concurrent requests, the handler retries when the pool is exhausted, resulting in indefinite hangs rather than explicit timeouts.
The alert fires, but the log at line 312 was never written because no one anticipated that the retry handler would be the problem.
According to the State of AI-Powered Engineering 2026 Report by Lightrun, 43% of AI-suggested code changes require manual debugging in production even after passing QA and staging. Behavior under real concurrency patterns diverges from what appeared in lower environments.
Teams are merging AI-generated code faster than they can fully review. The assumptions each suggestion carries about runtime state only become visible after deployment into production.
And AI-generated code is not the only source of non-determinism teams face in production.
Distributed Systems Where Sequence Is Never Guaranteed
Consider an order management system where OrderIngestionService writes to a database and publishes an event to a Kafka topic. Under normal load, the write completes before downstream services consume the event, so everything is consistent.
During a traffic spike of around 2,300 requests per minute, the event is occasionally consumed before the write commits. This causes the downstream service to read stale data. It happens roughly once every 150,000 requests.
It does not appear in staging. It does not reproduce on demand. The moment an engineer adds logging to investigate it, the added latency shifts the timing window, and the failure stops happening.
| Without logging: DB write avg latency = 2ms Kafka publish latency = 1ms Race window = ~1ms open at > 2,300 req/min With logging added: DB write avg latency = 5ms (+ 3ms log overhead) |
This is the canonical Heisenbug: a failure that disappears when you add instrumentation because the instrumentation changes the exact timing that produced it. Pre-captured telemetry cannot help here because capturing changes the conditions being observed. That raises a question worth answering carefully: Is non-deterministic AI actually the problem?
Why Non-Deterministic AI Is Not Broken
The most important reframe for engineers building reliability practices around AI-powered systems: the probabilistic behavior of LLMs is not a defect to be corrected. It is a design property to be accommodated.
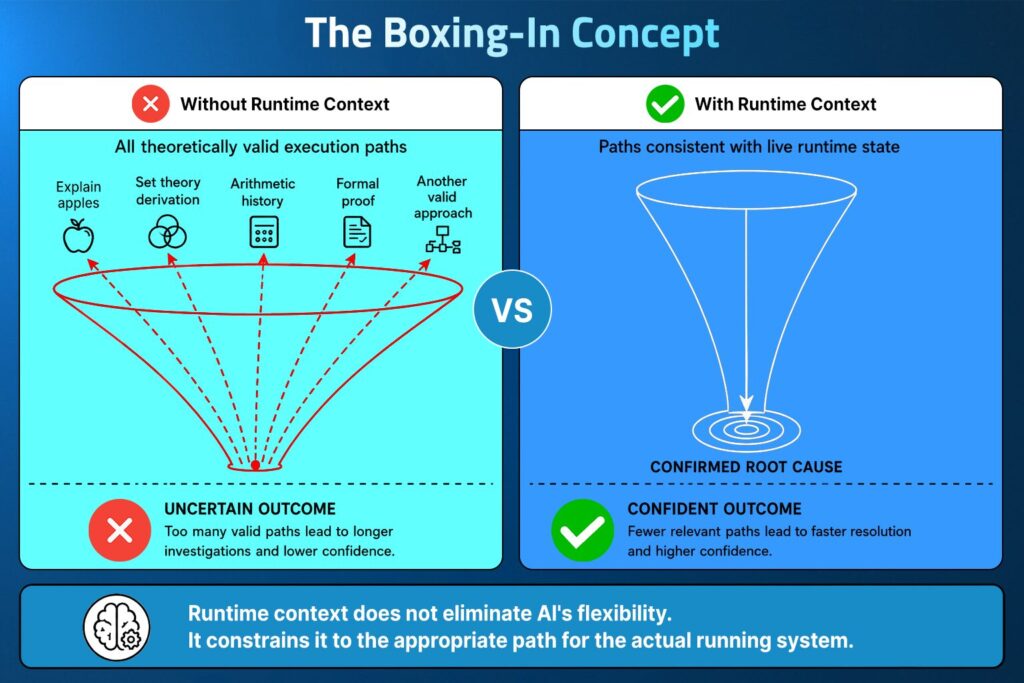
Think of it this way. Imagine asking an engineer to fix a timeout in a service they have never seen. Without access to the running system, they might suggest three valid approaches: increase the timeout threshold, add a circuit breaker, or check the upstream dependency.
All three are technically correct in isolation, but only one is safe given the current state of the connection pool, the traffic pattern, and the retry logic already in place. The same is true for AI agents investigating production failures.
Flexibility is the feature. Unconstrained flexibility reasoning toward a valid answer, via an execution path that leaves the system in a broken intermediate state, poses a risk. Runtime context is what narrows the search space from all valid answers to the one correct answer for this service, under this load, at this moment.
The goal is not to eliminate probabilistic flexibility. It’s to constrain AI’s reasoning within the live runtime environment so it navigates toward the appropriate execution path. Runtime context narrows the search space by what is actually happening in the system right now:
- Which variables hold which values at this exact moment
- Which code paths are actually executing under the current load
- Which dependencies are responding, and how fast
- What the connection pool state looks like at 847 concurrent requests
LLMs that power Claude, Cursor and ChatGPT work exactly as designed, but live runtime context defines the boundaries within which that reasoning operates safely in production. Seeing what those boundaries mean across every dimension of reliability engineering is where the shift from deterministic to non-deterministic production becomes concrete.
Deterministic vs Non-Deterministic Engineering: What Actually Changes
The shift to non-deterministic production environments changes every dimension of the reliability stack. The table below maps that change across the six dimensions that matter most.
Before reading the table, the critical column is telemetry. Everything else, how you test, how you debug, how you confirm the root cause, follows from whether the right evidence was captured at the right moment.
| Dimension | Deterministic | Non-Deterministic |
| Behavior | The same input produces the same output, always | The same input produces multiple possible outputs depending on timing, concurrency, and state |
| Testing strategy | Reproducible test cases with expected outputs | Probabilistic bounds; exact reproduction not guaranteed |
| Telemetry | Pre-instrumented at deployment time | On-demand evidence generation at the moment of failure |
| Debugging approach | Reproduce locally, trace the execution path | Capture at execution time; local reproduction is often not possible |
| Root cause analysis | Logical path from symptom to cause | Execution-level state at the exact moment of divergence |
| Reliability tooling | Traditional observability is built on pre-captured signals | Runtime-aware AI SRE grounded in live execution evidence |
Why the Reliability Stack That Worked for Deterministic Systems Fails Here
Three structural reasons explain why the standard reliability stack breaks down when production becomes non-deterministic.
1. You cannot pre-log a Failure You Did Not Anticipate
Go back to the TradeExecutionService.java example. The team had monitoring in place: latency alerts, error-rate dashboards, and connection-pool metrics. When the retry handler started hanging under 847 concurrent requests, every alert fired correctly: error rates climbed, latency spiked, and the dashboard turned red.
But when the engineer opened the logs to find out why, the variables at line 312, where the retry decision was being made, had never been instrumented. Nobody wrote that log statement because nobody anticipated the retry handler would be the problem.
The failure was clearly visible from the outside, but the cause was completely invisible from the inside. That gap exists not because the monitoring was poorly configured, but because it was configured for a world where engineers could anticipate what to capture. Even when an engineer does know where to look, the act of looking can destroy the very evidence they need.
2. Heisenbugs and the Confirmation Gap
The engineer investigating the OrderIngestionService race condition had a hypothesis: the event was being consumed before the write was committed. To confirm it, they needed to see the timestamps of both operations at the exact moment the failure occurred.
Their only option under traditional observability was to add logging to the write and the event publish, deploy the change, and wait for the failure to recur under the same traffic pattern.
The cycle played out like this:
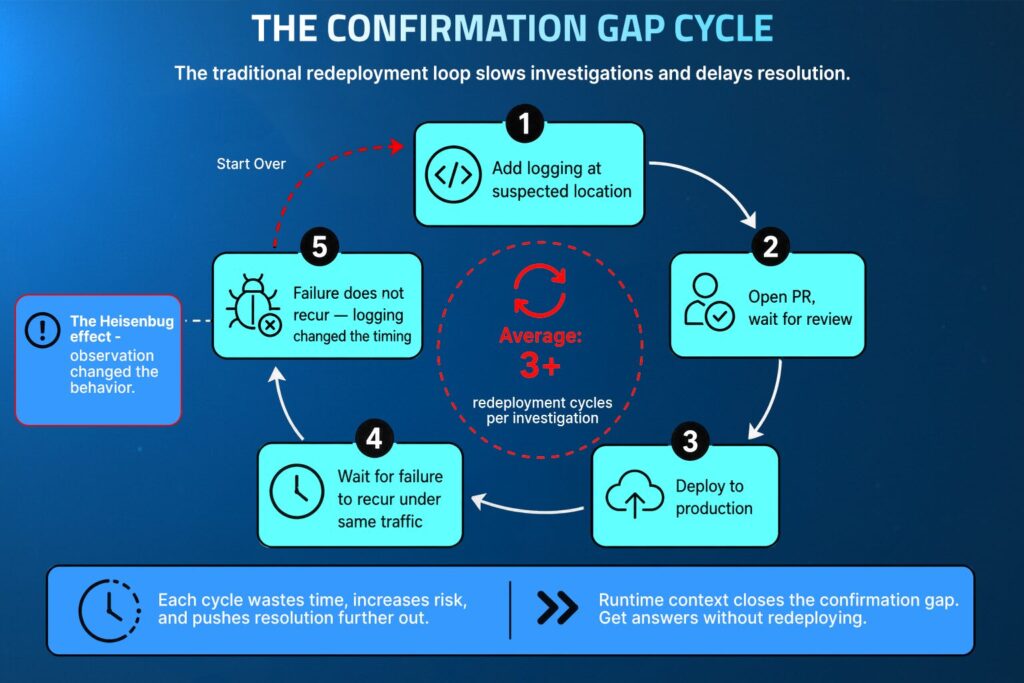
- Added logging to the write operation
- Opened a pull request, waited for review
- Deployed to production
- Waited two days for the traffic spike that triggered the failure
- Checked the logs and found the failure had not recurred since the deployment
The logging changed the timing. The added latency in the write path shifted the window, and the race condition no longer occurred under the same conditions. According to the State of AI-Powered Engineering 2026 report, 88% of organizations need 2-3 redeploy cycles to validate a single AI-generated change, and this cycle is exactly why.
This is the confirmation gap: you have enough telemetry to suspect the issue, but you cannot confirm what actually happened without changing the very thing you are trying to observe. According to the same report, 44% of cases where AI SREs or APM tools investigated production issues ended in failure because the necessary execution-level data was never captured.
3. AI SRE Tools Bounded by Telemetry That Was Written Before the Failure Existed
AI SRE tools are genuinely useful for accelerating root cause analysis. They correlate signals across large telemetry datasets and surface patterns that would take a human engineer hours to find.
Their constraint is not sophistication; it is the telemetry layer they sit atop. When the variable that caused the failure was never logged at deploy time, no amount of AI correlation can surface it. The AI reasons from what exists, and what exists was decided before the failure occurred.
When the engineer investigating TradeExecutionService.java asked their AI SRE tool what was causing the hangs, it correlated the latency spike with a recent deployment and suggested that a change to the retry logic was the likely cause. That much it got right.
But when asked to confirm exactly why the retry handler was hanging, it could not answer, because the variable state at line 312 under 847 concurrent requests had never been captured. The AI inferred a hypothesis it could not prove, and the investigation stalled exactly where it would have stalled without AI assistance.
What Reliable Engineering Requires in a Non-Deterministic World
The answer is not broader pre-captured telemetry and better AI correlation. It is a different architecture, one built to generate evidence at execution time rather than to anticipate it at deployment time.
The architecture that works here is built on a different principle: generate evidence at the moment of failure rather than anticipating it at deploy time. This means on-demand instrumentation, the ability to capture variable state, call stacks, and execution context at any line of any running service, without a pull request, a redeployment, or waiting for the failure to recur.
It also means that instrumentation must not change the behavior it observes; any added latency or lock acquisition can shift the timing window and make a Heisenbug disappear. And it means the AI reasoning on top of that instrumentation must be constrained by live execution evidence, not by pre-captured signals.
Evidence Generated at Execution Time, Not at Deployment Time
When the retry handler in TradeExecutionService.java starts hanging with 847 concurrent requests, and no instrumentation is present at line 312, the engineer needs to add a conditional snapshot at that exact line while the service is running under real traffic.
That snapshot should capture retryCount, connectionPoolState, and timeoutThreshold at the moment the retry decision is made, without requiring a pull request, a code review, a deployment, or a wait for the failure to recur.
This is what the Lightrun Runtime Sensor provides: on-demand, dynamic logs, conditional snapshots, and runtime metrics at any specific line of code in any running service. Evidence is generated at the moment of failure, without touching the deployed artifact or affecting the users it is serving.
Instrumentation That Does Not Change the Behavior Being Observed
Adding logging to the OrderIngestionService race condition investigation changed the timing and made the failure stop occurring. Any instrumentation that introduces latency, acquires locks, or alters memory allocation can shift the exact timing window that produced the failure.
The Lightrun Sandbox solves this through its patented read-only environment. All instrumentation added through the Runtime Context Engine operates inside the Sandbox, which:
- Captures evidence without mutating application state
- Introduces no performance overhead
- Preserves the exact timing conditions of a Heisenbug investigation
- Poses no risk to the live service or its users
The engineer investigating the OrderIngestionService race condition can add a snapshot to both the write and the event publish, capturing timestamps and variable state at the exact moment each operation executes, without changing the timing window that produced the failure.
Preserving the conditions of a failure is one capability. Using that preserved evidence to constrain AI reasoning to the right conclusion is the other.
Constraining AI’s Pathways with Live Runtime Truth
When the Lightrun AI SRE investigates a production failure, it does not reason from pre-captured telemetry toward a hypothesis. It reads the actual code, identifies what can and cannot cause the observed symptom, and surfaces the real blocking path even when that means challenging the assumption the engineer started with.
That is what constraining AI reasoning to live runtime truth looks like in practice: not confirming a guess, but eliminating wrong paths and isolating the one that fits the actual execution state. Here is exactly what that investigation looks like in practice.
How Do You Diagnose a Non-Deterministic Failure When Logs Say Nothing?
The engineering team’s TradeExecutionService.java intermittently hangs under concurrent production load. Some requests succeed; others time out with no clear error, and nothing in the existing monitoring explains why.
In staging with 12 concurrent users, it worked correctly. In production, requests began hanging intermittently under concurrent load; some succeeded, others timed out without a clear error, and the pattern could not be reproduced locally.
The on-call SRE opens Lightrun AI SRE and asks one question: “Why is the retry handler in TradeExecutionService.java hanging under concurrent production traffic?”
It reads the actual file, rules out the code paths that cannot cause a hang, and identifies four synchronous downstream calls with no timeout configuration. It flags fraudService.validateTrade() at line 62 as the most likely blocking path under concurrent load.
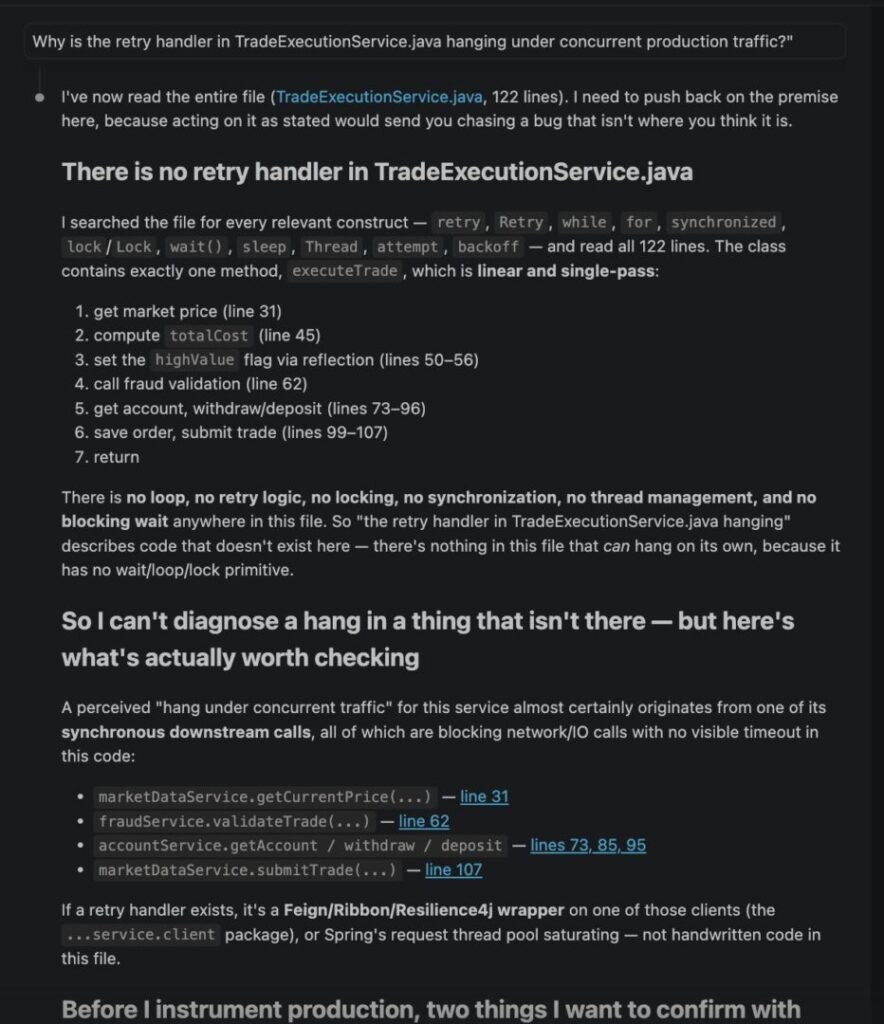
With the actual blocking path confirmed, the root cause and full evidence chain surface from live production logs and connected repos, no redeployment is required:
Three things confirmed from live production logs and connected repos zero redeployments:
- executeTrade() blocks every request on fraudService.validateTrade(request) before any account or order work continues TradeExecutionService.java:62
- The fraud client uses RestTemplate.postForObject() with no explicit timeout, constructed as new RestTemplate() with no timeout factory TradeExecutionServiceApplication.java:21
- Eureka registered fraud-service after trade-execution had already started, explaining the initial service discovery gap service-registry.log:54
- Secondary bug: TradeExecutionService writes the string “true” into the boolean field highValue, causing high-value trades to fail fraud validation TradeExecutionService.java:51, confirmed in prod-trade-execution-service.log:88
The fix:
| // Fix 1: Add bounded HTTP timeout HttpComponentsClientHttpRequestFactory factory = new HttpComponentsClientHttpRequestFactory(); factory.setConnectTimeout(2000); factory.setReadTimeout(5000); RestTemplate fraudClient = new RestTemplate(factory); // Fix 2: Wrap in circuit breaker // Fix 3: Correct the type mismatch |
The investigation that would have taken days of redeployment cycles was completed in a single session, with a confirmed root cause, an evidence chain tied to specific log lines, and a concrete fix.
Summary Table
The five failure classes from the blog above, mapped against why traditional tools stall and how Lightrun resolves each one.
| Non-Deterministic Failure Class | Why Traditional Tools Fail | How Lightrun Resolves It |
| Heisenbug (disappears when logging is added) | Adding instrumentation changes timing and race condition windows | Lightrun Sandbox captures evidence in a patented read-only environment that does not alter application state |
| AI agent behavior divergence | Cannot pre-log execution paths that were not anticipated | Lightrun queries live runtime state directly, constraining reasoning to actual system behavior |
| Race condition under a specific concurrent load | Pre-captured telemetry misses the variable state at the moment of divergence | Conditional snapshots capture the exact state at the decision point under real traffic |
| Timeout with no instrumentation at origin | Logs confirm failure occurred, but not why the pathway produced it | Call stack and variable state captured at execution confirm the causal chain |
| Confirmation gap (hypothesis without execution proof) | AI SRE tools reason toward likely explanations from available telemetry | Runtime context confirms with execution evidence, no redeployment required |
The Evidence Gap Is the Reliability Gap
Production engineering teams are not limited by a shortage of tools. They are limited by the evidence available to those tools. When fraudService.validateTrade() started blocking every concurrent request with no timeout configured, nothing in the existing monitoring captured it because no one had logged that call’s behavior before the failure.
Adding more AI to a telemetry gap does not close it. It produces faster inferences from incomplete data, and faster wrong answers are still wrong answers.
Runtime context closes the gap at the source. Lightrun’s Runtime Sensor generates the missing evidence on demand, inside the running service, and uses it to confirm the root cause in a single session, not after the next redeployment cycle.
The deterministic guarantee doesn’t return by making the model more predictable. It returns by constraining what the model reasons over. Give an AI agent the live state of the system it’s actually operating on, and the same failure converges on the same answer again, not because the model stopped being probabilistic, but because only one path is still consistent with what production is actually doing.
FAQs
Deterministic systems always produce the same output for the same input, which allows engineers to pre-instrument for predictable failure modes. Non-deterministic systems can produce different outputs depending on timing, concurrency, or AI reasoning paths, which breaks the assumption that pre-captured telemetry can cover what will actually go wrong in production.
AI coding assistants generate different approaches to the same problem on each run because they are probabilistic systems by design, and that flexibility is what makes them useful. The challenge is that production environments have specific constraints around concurrency, connection pools, and dependency state that make some valid paths unsafe, which is exactly what runtime context surfaces before those paths cause incidents.
A Heisenbug is a failure that disappears when you add logging to investigate it, because the logging changes the timing or concurrency conditions that produced it. The Lightrun Sandbox captures evidence in a patented read-only environment that does not alter application state or timing, so engineers can safely investigate a Heisenbug without making it vanish.
Runtime context is live, execution-level visibility into a running service: variable values at specific lines, call stacks, dependency responses, and system state at the exact moment a failure condition is met. Unlike pre-captured telemetry, it is generated on demand at the precise location of the failure, under real production traffic, without redeployment.
Traditional observability tools can only reason about signals captured before the failure and cannot generate new evidence when the key data was never written. Lightrun’s Runtime Context Engine generates execution-level evidence on demand within the running service via the Lightrun Sandbox, allowing the Lightrun AI SRE to confirm the root cause rather than produce hypotheses bounded by pre-captured telemetry.