What is Runtime Context? A Practical Definition for the AI Era
Feb 19, 2026

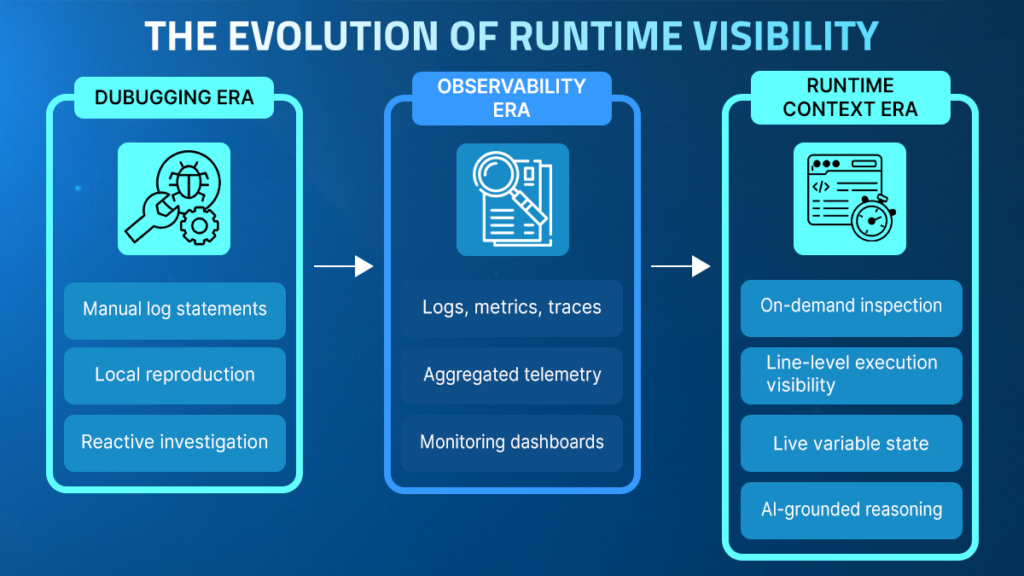
Runtime context describes the ability to observe code as it executes in real time, capturing precise variable states and logic branches in production. Unlike traditional observability, which relies on static logs and metrics, runtime context provides on-demand, execution-level evidence. This foundational layer enables engineers and AI workflows to validate behavior against real-world data, transforming root cause analysis into a direct observation process.
TL;DR
- Runtime context describes the ability to observe how code actually executes in real time, including the precise path a request takes, the state of variables at specific lines, and the conditions under which logic branches evaluate in production.
- Traditional observability systems provide structured telemetry such as logs, metrics, and traces, but they rely on signals defined in advance and therefore cannot always answer newly emerging runtime questions.
- By enabling on-demand inspection of running services, the runtime context allows engineers to retrieve execution-level evidence without rebuilding, redeploying, or waiting for another failure to occur.
- This approach moves engineering workflows from interpreting partial telemetry to validating behavior against live execution, enabling root cause analysis, change validation, live system investigation, and deep code-level analysis.
- As modern systems grow more dynamic and AI participates in development and operational workflows, runtime context becomes a stabilizing layer that aligns diagnosis and remediation with what actually occurred inside the running application.
AI has accelerated the pace at which software can be written, refactored, and deployed. What it has not accelerated is our ability to understand how that software behaves once it runs in production.
Most critical failures do not emerge in isolation; they arise from real traffic patterns, evolving dependencies, and environment-specific conditions that cannot be fully reproduced in development. Runtime context provides direct visibility into this live behavior, enabling reasoning about software based on observed execution rather than assumptions.
This article explores what runtime context means in practical terms, why traditional observability models leave structural gaps, how root cause analysis changes when execution can be inspected directly, and why runtime context is becoming foundational in AI-driven engineering workflows.
Why is it So Hard to Understand Production Behavior?
Modern systems are distributed, stateful, and constantly evolving. A single request may traverse multiple services, interact with third-party APIs, trigger asynchronous jobs, and depend on cached data whose state has shifted since deployment. Even when individual components are well-tested, their interactions under real-world conditions often introduce behavior that was never anticipated.
Many production incidents emerge from complex interactions across services that are difficult to reproduce outside live environments. The Google Site Reliability Engineering research highlights that distributed systems often fail in ways that cannot be easily simulated in staging environments due to real traffic patterns and evolving dependencies.
When an issue emerges, engineers typically turn to logs, metrics, and traces. These tools are essential for monitoring and alerting, but they are built on prior configuration. They reflect decisions about what to capture at the time of instrumentation.
If a specific variable, branch condition, or dependency interaction was not logged in advance, it is not available during investigation. At that point, teams often redeploy to add additional logging or attempt to reproduce the issue in staging, where the environment rarely matches production precisely. If they are using an AI tool, it is forced to guess.
This gap between what is happening and what is visible creates uncertainty. Engineers are left to interpret signals rather than observe execution directly. As development velocity increases, especially with AI-generated changes, the number of unanticipated runtime scenarios grows, widening the distance between telemetry and reality.
What Does Traditional Observability Miss?
Observability systems are designed to monitor known signals at scale. Logs capture events that developers anticipated might be relevant. Metrics summarize performance characteristics over time. Traces reconstruct request flows across services. Together, they provide structured insight into system health and are essential for detecting anomalies. However, their strength lies in answering predefined questions rather than exploring new ones.
During incident analysis, the limitation becomes apparent.
- A spike in latency may be visible in metrics, yet the precise branch condition that triggered it may not have been logged.
- A trace may show that a dependency call slowed down, but not reveal the data state that caused a retry loop.
- Logs may confirm that an error occurred, but not capture the variable values that explain why.
When the required signal is never instrumented, engineers are forced to infer behavior from partial data or initiate redeployment cycles to add instrumentation.
This gap is not a tooling failure; it is a structural constraint. Observability relies on advanced configuration and cost-conscious data collection. It cannot capture every possible runtime permutation without becoming prohibitively expensive and noisy.
As systems grow more dynamic and AI accelerates code changes, the number of unanticipated execution paths increases. What observability misses, therefore, is not volume, but the specificity, the ability to inspect exactly what happened at the moment the question arises.
| Capability | Traditional Observability | Runtime Context |
| Data collection | Predefined logs, metrics, traces | On-demand inspection |
| Visibility level | Aggregated telemetry signals | Line-level execution behavior |
| Investigation model | Interpret signals and infer causes | Directly observe runtime execution |
| Instrumentation | Requires redeploying new logs | Dynamic instrumentation in running systems |
| AI reasoning | Based on historical telemetry | Based on live execution evidence |
What Is Runtime Context?
Runtime context provides execution-level visibility into how code behaves under real-world conditions. It captures what is happening inside an application at a specific line of code, for a specific request, at a specific moment in time. Instead of relying solely on signals emitted in advance, runtime context allows engineers to directly observe execution as it unfolds.
In practical terms, the runtime context makes it possible to inspect:
- The exact execution path taken for a request
- The state of variables at a specific line
- The evaluation of branch conditions
- The behavior of code under real traffic
Unlike traditional telemetry, runtime context is generated on demand and shows live behavior. When a new question arises, why a failure occurred, why a subset of users experienced latency, or why a specific edge case triggered unexpected behavior, engineers can introduce temporary inspection points into the running system without rebuilding or redeploying.
The investigation can then align to the question rather than be built around prior instrumentation decisions.
How Does Runtime Context Change Root Cause Analysis?
Root cause analysis traditionally begins with interpretation. Engineers and AI SREs review logs, correlate metrics, examine traces, and form hypotheses about what might have happened.
Each hypothesis must then be validated, often by adding new instrumentation or attempting to reproduce the issue in a controlled environment. This cycle introduces delay and uncertainty because the investigation depends on signals collected before the actual question was known.
Runtime context shifts the investigation model from interpretation to observation, a direct interaction with runtime reality rather than an exercise in deduction.
Instead of inferring behavior from partial telemetry, engineers and AI tools can inspect the exact execution path that produced the failure. They can examine variable values at the moment an exception was thrown, observe how a branch condition evaluated under real data, or understand why a dependency behaved differently for a specific request.
This has two important consequences. First, hypotheses can be validated immediately against live execution rather than through redeployment cycles. Second, remediation decisions are grounded in evidence rather than probability. Root cause analysis becomes less about narrowing down possibilities and more about confirming what actually occurred.
To put it simply:
- Telemetry helps identify where to look.
- The runtime context shows what happened and explains why.
And that difference changes the speed and confidence of resolution.
Why is Runtime Context Even More Important in the AI Era?
AI has fundamentally changed the pace of software development. Code suggestions, automated refactoring, and AI-generated services have reduced the friction of writing and modifying logic.
As change velocity increases, the number of possible runtime permutations expands accordingly. More changes introduce more execution paths, more edge cases, and more interactions between components that were never explicitly designed to operate together.
This shift introduces new reliability challenges:
- Rapid code iteration increases behavioral variability across environments.
- AI-generated logic may introduce subtle execution paths that were not manually reviewed.
- Complex service interactions amplify data-dependent and concurrency-driven failures.
- The investigation must now keep pace with the higher deployment frequency.
AI systems themselves depend heavily on available signals. When AI tools analyze telemetry to suggest a root cause or remediation strategy, they are constrained by the completeness of the data provided. If a critical runtime condition was never logged, automated reasoning becomes probabilistic rather than definitive.
Runtime context introduces a necessary grounding layer:
- It exposes live execution behavior rather than relying solely on historical signals.
- It enables AI-assisted workflows to validate hypotheses against real runtime evidence.
- It reduces speculative diagnosis by aligning reasoning with observed execution state.
- It stabilizes reliability in environments where systems evolve continuously.
In an AI-driven engineering landscape, runtime context functions not merely as a debugging enhancement but as an architectural safeguard that ensures both human and automated reasoning remain anchored to execution reality.
How Is Runtime Context Applied in Real Engineering Workflows?
The impact of runtime context becomes clearer when applied to real investigative workflows.
In practice, it allows engineers to insert temporary inspection points into running services to retrieve execution data precisely when needed. These inspection points can capture logs at a specific line, snapshot variable states during execution, or introduce short-lived metrics to observe behavior over time, all without rebuilding or restarting the application.
This changes how incidents are handled. Instead of rolling back, deploying new logs, and then waiting for another failure, engineers can observe their system live. For example, during an unexpected spike in errors, they can inspect the exact values of the variables that triggered the exception. If latency increases for a subset of users, they can observe the execution branch taken only for those requests. Once the investigation concludes, the temporary inspection logic can be removed, leaving the production environment unchanged.
Platforms such as Lightrun operationalize this model by attaching a production-safe agent to running services and enabling inspection through IDEs, web interfaces, and AI workflows.
Engineers can interact directly with runtime behavior from the environments they already use, generating evidence on demand rather than relying solely on previously collected telemetry. This allows root cause analysis to move from inference toward confirmation while maintaining production safety.
How is Runtime Context Used Across the SDLC?
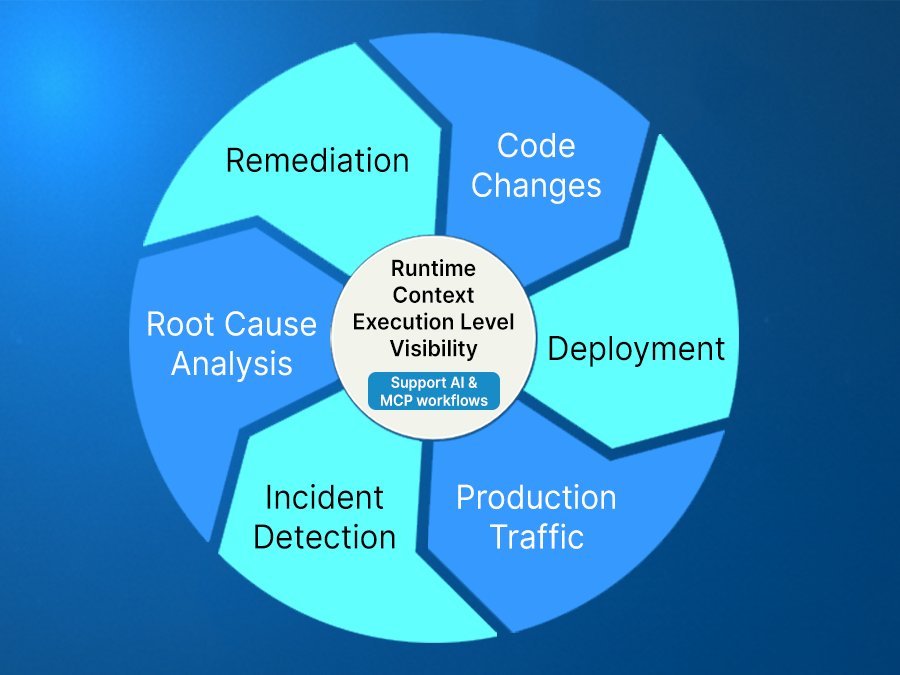
Runtime context is often associated with production debugging, but its impact extends beyond incident response. The same capability that enables engineers to inspect a failing request can also be applied earlier in the lifecycle, when assumptions are still being formed, and changes are still being evaluated. Rather than confining runtime visibility to moments of failure, it becomes part of the continuous validation of software.
During Development and Code Changes
When new logic is introduced, whether written manually or generated by AI, the primary risk lies in how it behaves under real-world conditions. Test environments cannot fully reproduce live traffic distributions, data shapes, or dependency states. Runtime context allows engineers to validate behavior against actual execution patterns, reducing the likelihood that subtle edge cases slip into production.
This enables teams to:
- Confirm how specific branches evaluate under real inputs
- Observe performance impact before broad rollout
- Ground AI-generated code suggestions in runtime behavior
- Detect mismatches between expected and actual execution paths
During Incidents and Production Events
When an issue emerges, the runtime context shifts the investigation from interpretation to confirmation. Instead of deploying additional logging or attempting to reproduce the failure, engineers can inspect the exact execution path that triggered it. The same mechanism used during development now accelerates remediation.
This continuity matters. The capability does not change between environments; only the question changes. Whether validating new code or diagnosing an outage, runtime context provides direct access to execution reality.
What Does Runtime Context Look Like in Action?
Consider a trade execution service processing thousands of transactions per minute.
Here is the scenario:
- Under normal load, trades complete successfully and balances reconcile correctly.
- However, during peak trading windows, high-value orders intermittently fail with a generic validation error.
- Infrastructure metrics show no resource saturation, and logs confirm that trades are rejected, but they do not explain why identical orders sometimes pass and sometimes fail under similar conditions.
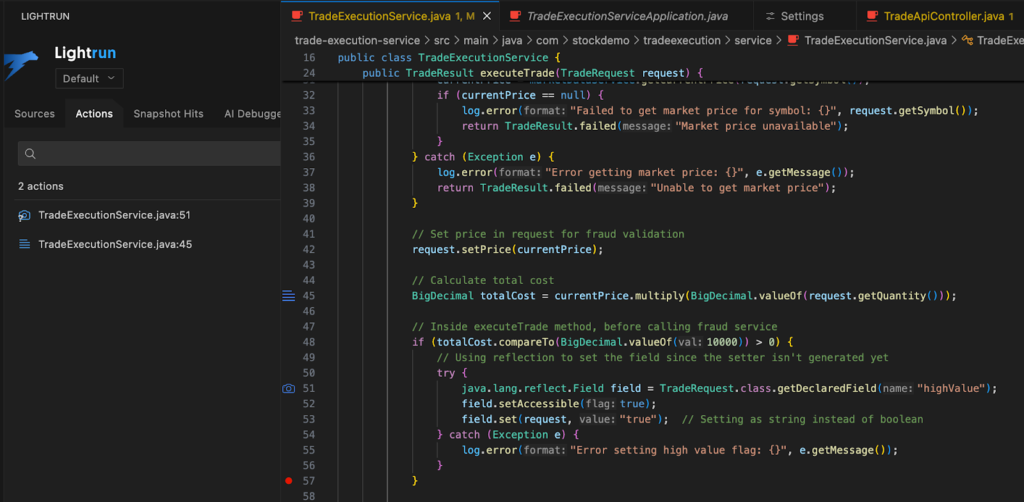
A simplified portion of the execution logic resembles the following:
if (totalCost.compareTo(BigDecimal.valueOf(10000)) > 0) {
    Field field = TradeRequest.class.getDeclaredField("highValue");
    field.setAccessible(true);
    field.set(request, "true");  // string instead of boolean
}
The logic appears straightforward, yet failures increase for trades above the threshold. Because only the final validation outcome is logged, it is unclear whether the issue stems from incorrect flag assignment, inconsistent fraud validation behavior, or side effects under concurrency.
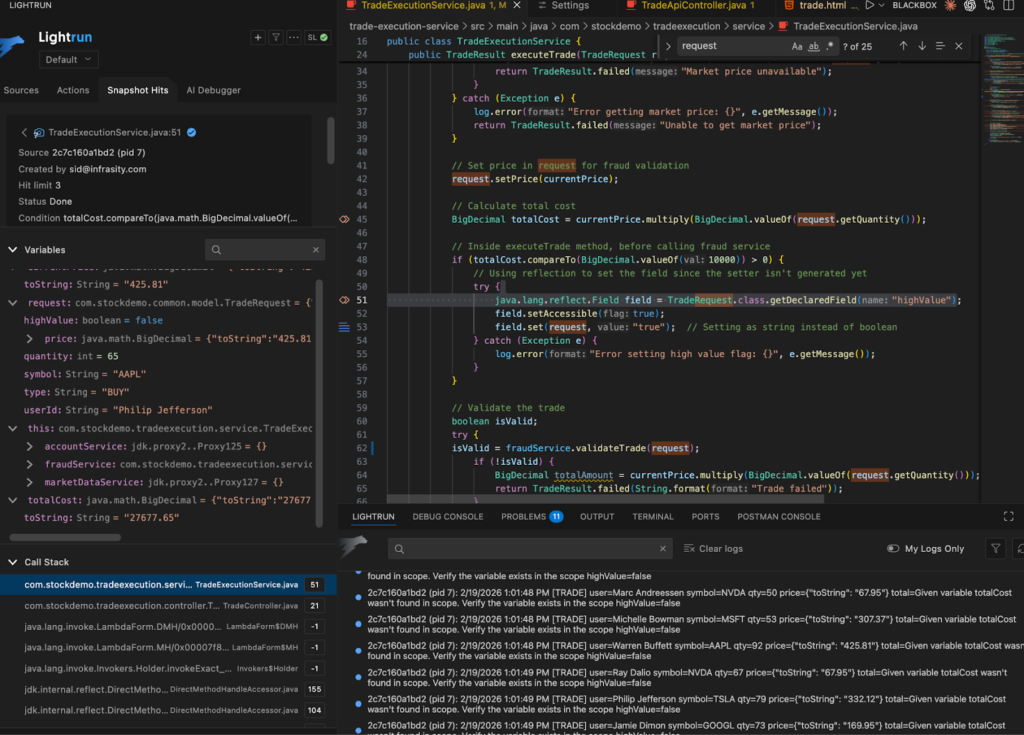
By using runtime context, the investigation moves from inference to direct observation. A dynamic log inserted at this decision point reveals that the highValue field is not consistently set as expected. Live traffic confirms a type mismatch introduced through reflection, leading to validation inconsistencies that surface only on specific runtime paths.
Further inspection around the account balance validation exposes an additional issue. Concurrent high-value BUY orders read the same balance before withdrawal occurs, creating a race condition during peak load. This behavior does not reproduce reliably in staging because it depends on real concurrency and real timing.
Telemetry indicated that trades failed, but the runtime context exposed the exact execution conditions responsible for those failures.
How Lightrun Operationalizes Runtime Context Safely
The trading example illustrates the analytical value of runtime context; the remaining challenge is to implement that capability safely in live production systems. In high-stakes environments such as financial platforms, diagnostic tooling must guarantee isolation and non-interference.
Lightrun implements runtime context through a lightweight agent attached to running services. Engineers, AI agents, and code assistants can insert dynamic logs, capture execution snapshots, or introduce temporary metrics directly from their IDE, web interface, or collaboration tools. These inspection points execute immediately against live traffic and can be removed without rebuilding or restarting the application.
In the trading scenario, a dynamic log inserted at the reflection block reveals the actual runtime value and type of the highValue field. A snapshot placed at the account balance validation step captures full variable state, stack trace, and thread context, allowing engineers to confirm concurrency behavior directly under real production load.
All instrumentation runs inside Lightrun’s secure, read-only sandbox, which prevents state mutation and preserves control flow. This ensures that runtime inspection does not alter trade execution or application data. Once the investigation is complete, the temporary instrumentation is removed without residual impact.
Within Lightrun, runtime context appears as line-level execution data attached directly to source code.
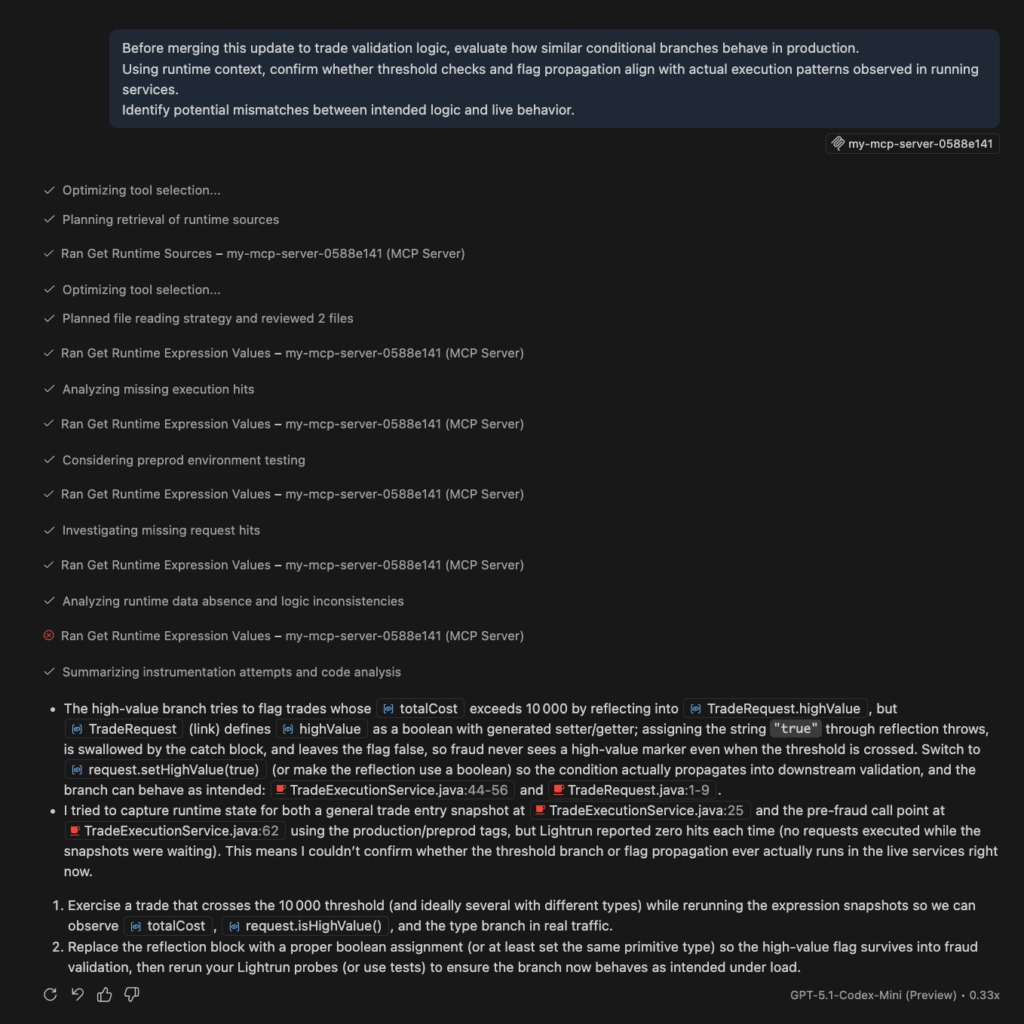
Engineers can observe dynamic logs in real time, inspect snapshots, and correlate findings with existing telemetry. When exposed through the Model Context Protocol (MCP) or Lightrun AI SRE, the same execution evidence becomes accessible to AI-assisted workflows, grounding automated reasoning in live behavior rather than static analysis.By incorporating runtime context into AI SRE workflows, investigations become anchored in verifiable execution evidence, shifting diagnosis from probabilistic inference toward proof-based analysis.
Through this approach, runtime context becomes a practical and production-safe capability embedded directly into investigation and validation workflows.
Conclusion
Software systems are evolving at a pace that widens the gap between rapid code creation and clear understanding of execution. AI has reduced the friction of writing logic, but reasoning about how that logic behaves in distributed, real-world environments remains complex. As change velocity increases, the distance between what is shipped and what can be confidently explained continues to grow.
Observability remains essential, but traditional tools cannot anticipate every execution path or capture every condition that becomes relevant during investigation. Runtime context addresses this limitation by aligning visibility with inquiry, enabling engineers and AI workflows to generate execution-level evidence when new questions arise.
Runtime context is therefore not simply a debugging enhancement but a structural shift in reliability practice across the software lifecycle. By enabling direct observation of live execution, it moves investigations from inference to confirmation while supporting continuous validation of system behavior from development and code changes through incident diagnosis and remediation in production. In AI-driven systems where change is continuous, runtime context becomes a foundational layer for building software that is understandable, trustworthy, and evolved with confidence.
Frequently Asked Questions About Runtime Context
Runtime context refers to live, execution-level visibility into how code behaves while it is running in a real environment. It includes insight into the exact execution path taken by a request, the state of variables at specific lines, and the evaluation of conditional logic under real traffic. Unlike predefined telemetry, runtime context aligns visibility with the specific investigative question at hand.
As AI accelerates development and increases the pace of system change, the number of possible execution paths expands. Automated reasoning systems can analyze telemetry at scale, but they are limited by the completeness of available signals. Runtime context provides a grounding layer that exposes what actually happened inside the running application, reducing reliance on probabilistic inference.
Lightrun attaches a lightweight agent to running services and enables engineers to insert dynamic logs, capture execution snapshots, or introduce temporary metrics directly at specific lines of code. All instrumentation runs within a secure, read-only sandbox that prevents mutation of application state and preserves control flow, ensuring that live traffic is not disrupted.
Yes. Through Lightrun’s Model Context Protocol (MCP) and Lightrun AI SRE, runtime context can be made accessible to AI-assisted investigation workflows. This allows automated systems to reason over live execution evidence, grounding diagnosis and remediation recommendations in observed runtime behavior rather than static analysis alone