Salesforce with Lightrun: debugging in production

Introduction
Working in the technology field, we’re no strangers to the challenges posed by managing a vast array of code, services, containers, data, and the occasional bug. These challenges are amplified when you’re part of an engineering team within a major enterprise like Salesforce. In such an environment, even seemingly minor bugs can have a significant impact on the smooth operation of our systems and services.
Today, I want to share a recent experience that showcases how a production debugging tool called Lightrun has revolutionized the way we tackle bugs within our Marketing Cloud Intelligence team. It’s a story of how Lightrun enabled us to swiftly resolve a nagging issue that could have otherwise consumed days, if not weeks, of our valuable time.
The unfolding mystery of the “stack overflow” exception
Picture this: you’re deep into a project, and everything seems to be going smoothly until a dreaded error disrupts your workflow. That’s precisely what happened to us recently. We encountered a “Stack Overflow” exception, a notorious issue known for its complex and lengthy stack traces. To make matters worse, the stack trace in the logs was truncated, leaving us in the dark about the precise location where the error originated.
In a traditional debugging scenario, we would have embarked on the time-consuming journey of adding log statements incrementally to our codebase, hoping to pinpoint the exact line of code responsible for the error. This trial-and-error process often leads to prolonged debugging sessions, something we couldn’t afford, given that our production deployments were limited to once a day. It was clear that we needed a more efficient solution to crack this enigma.
Adopting Lightrun: A debugging game-changer
Fortunately, we had recently integrated Lightrun into our production instances, a decision that would soon prove to be a game-changer. Lightrun, a production debugging plaform, offered us the ability to insert logs anywhere in our code without necessitating a full deployment. This feature alone was a game-changer, as it allowed us to be agile in our debugging process.
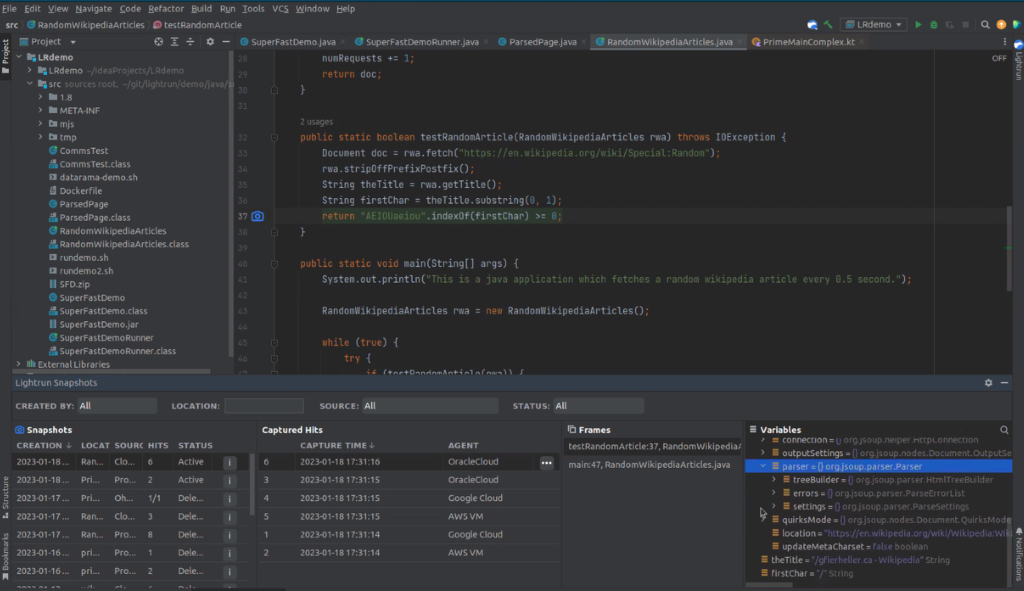
Lightrun also provided another invaluable feature: Snapshots. These Snapshots allowed us to inspect the state of variables at different points in our code, giving us a comprehensive view of what was happening during runtime. And all of these helpful features are integrated in the IDE, so we were able to easily navigate through our code in a familiar environment. Armed with these powerful capabilities, we set out to conquer the “Stack Overflow” exception that had been causing us sleepless nights.
Swift resolution and unraveling the mystery
With Lightrun at our disposal, we embarked on our debugging journey with newfound confidence. Instead of making blind guesses, we strategically inserted log statements and Snapshots to trace the flow of our code. Within just a few hours, we had uncovered the exact location where the exception was occurring, and we even identified the specific record in our database that triggered it.
Comparing this experience to the conventional trial-and-error debugging approach, the contrast was striking. Lightrun had not only saved us an immense amount of time but also spared us the frustration and uncertainty that often accompanies traditional debugging methods.
Conclusion: Lightrun – A time-saving debugging ally
In the dynamic world of enterprise-level software development, time is of the essence. The faster you can identify and resolve issues, the smoother your operations will run, and the happier your customers will be. Our recent encounter with a “Stack Overflow” exception could have turned into a protracted ordeal, consuming valuable time and resources. However, thanks to Lightrun, we were able to expedite the debugging process and maintain our agile development pace. As someone who has experienced the “old-fashioned” way of debugging, I can confidently affirm that Lightrun has proven to be a lifesaver for our team. It not only saved us days, if not weeks, of painstaking debugging but also provided a more streamlined and efficient approach to tackling complex issues in our production environment. In the ever-evolving landscape of technology, having tools like Lightrun at our disposal is what keeps us at the forefront of innovation and efficiency.
This post was originally published on LinkedIn by Tomer Glicksman from Salesforce.