
New Feature: Automatic Snapshots When Latency Spikes
Jun 30, 2026 / Updated: Jun 30, 2026


We’ve released an exciting new Lightrun capability: set a duration threshold on your Tic & Toc or Method Duration metrics, and Lightrun will automatically capture a snapshot whenever execution exceeds it. It takes moments to configure, and gives engineers the runtime context they need to understand why unexpected slow executions are occurring.
TLDR: What’s New?
Tic & Toc and Method Duration metrics now support an optional snapshot trigger. Set a duration threshold at the millisecond level, and Lightrun will automatically capture a snapshot when execution time exceeds it. This stops you having to manually reproduce the issue, or wait for the right moment. It’s available in the JetBrains plugin for Java/JVM applications from version 1.87.
What Are Tic & Toc and Method Duration Metrics?
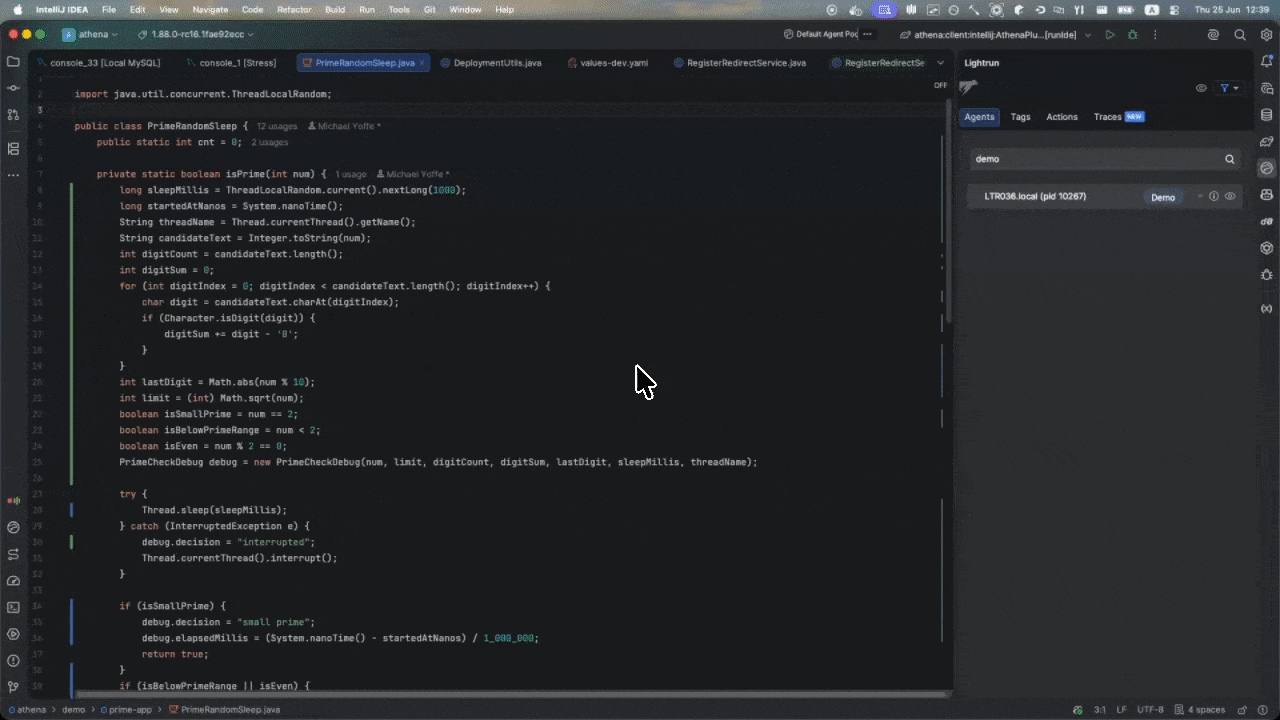
Just like a clock, Lightrun’s Tic & Toc metrics measure how long it takes for a specific block of code, within the same function, to execute. The Tic marks the start line where timing begins, while the Toc marks the point where timing stops.
Lightrun deploys this instrumentation directly into your live JVM application with no code change or redeployment required.
Every time a thread passes through that code block, Lightrun records the elapsed time and streams statistical output (count, min, max, mean, and standard deviation) to your configured target every second.
The companion action, Method Duration, measures the full execution time of a method from entry to return. Where Tic & Toc isolates a specific block within a method (a database call, a serialization step, a cache lookup), Method Duration covers the whole function.
Both metrics give you timing specificity, and tell you exactly which code block or method is consuming the time, across every call, live in production.
The Problem We Want To Solve
While these metrics are great for measuring execution latency, showing averages, outliers, and trends over time, they can’t tell you why an unexpected execution anomaly suddenly occurred.
When a specific execution spikes beyond your normal range, we have a record of the duration, but not the full runtime context behind that spike. To understand this we have to review inputs, object state, branch decisions, downstream response details, or lock/queue state.
Without additional runtime capture in place, engineers often need to reproduce the condition, watch for the issue to recur, and add a targeted snapshot of application state when the slow path happens again.
To put it another way, engineers have the signal without the explanation, and that’s the gap we’re closing today.
Introducing Threshold Triggered Snapshots
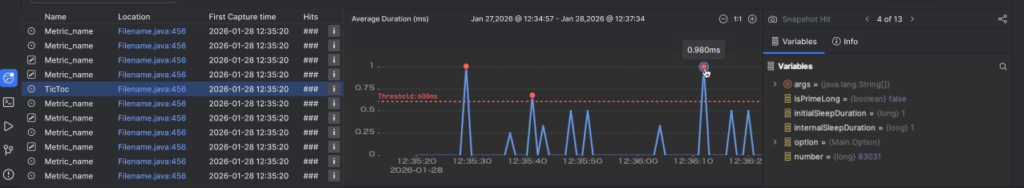
This new capability uses duration metrics to trigger a snapshot of deep runtime context. They are activated when the elapsed time between Tic and a Toc, or the total execution time of a method takes longer than a predefined threshold.
When captured, the snapshot can include local variables, object fields, selected expressions, call stack, source location, alongside the metric value that crossed the threshold.
Taken together, engineers can see not only that an execution was slow, but also understand what was different about it, and what the likely cause was.
This new capability is particularly useful when dealing with:
- Intermittent latency spikes: p99 occasionally spikes under real traffic but is hard to catch live;
- Load-dependent slow paths: code that behaves differently under high concurrency or large payloads that can’t be reliably reproduced in staging;
- Third-party library calls: you can’t instrument the library directly, but you can wrap the call in Tic & Toc and capture surrounding application state at the Toc point when it exceeds your SLA;
- Pre-incident investigations: metrics suggest degradation before an alert fires, giving you an evidence trail of what was happening in the code during slow executions.
How to Setup Threshold Triggered Snapshot
For Method Duration, right-click on any line within the method. For Tic & Toc, place your cursor at the start of the code block you want to measure and right-click and then set the Toc line number.
In both cases, hover over Lightrun, select the relevant action from the Metrics menu, and the insert form will include a Capture a Snapshot When Threshold Is Exceeded checkbox. Check it and two additional fields appear:
- Threshold: the duration in milliseconds that must be exceeded to trigger a snapshot capture
- Max Snapshot Hits: the maximum number of threshold-triggered snapshots to capture for this metric
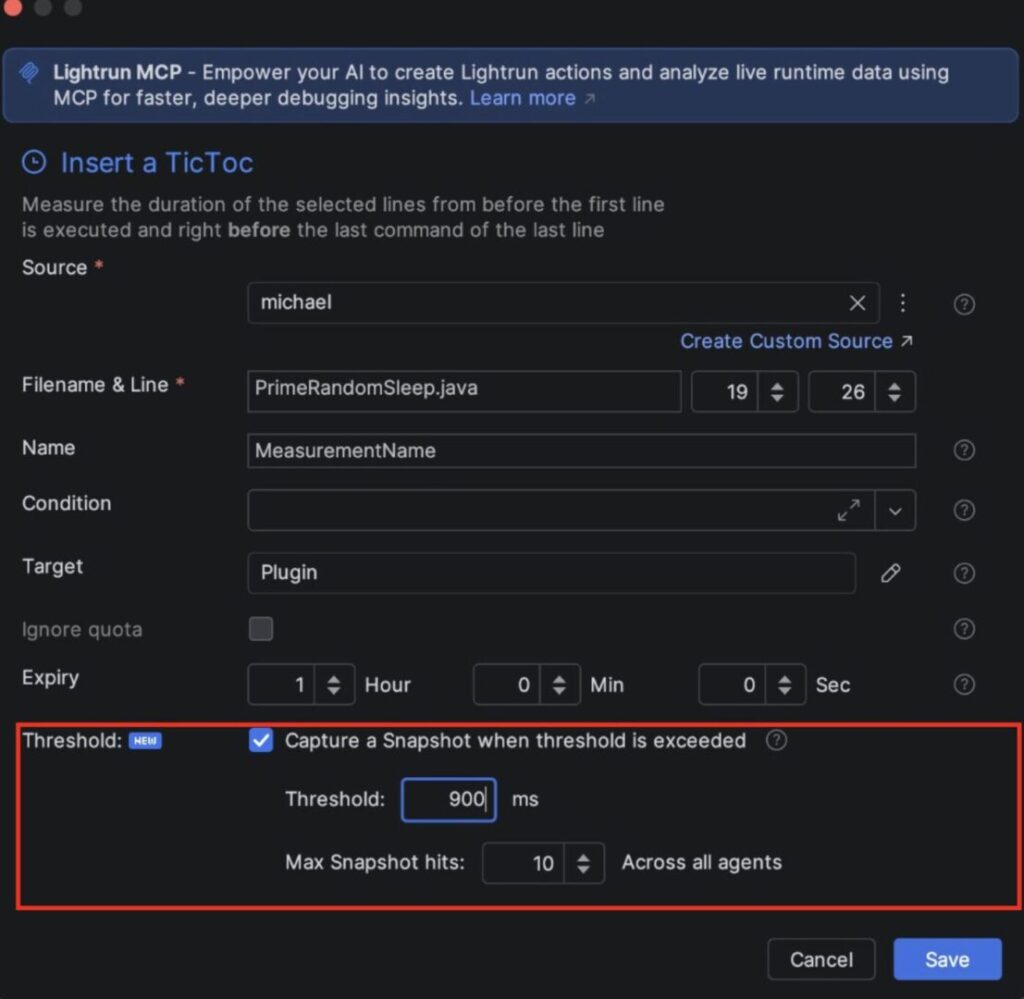
Set the threshold at a value that represents genuinely suspicious behavior for your application. A payment method that normally completes in under 40ms might warrant a threshold of 150ms. A batch aggregation that runs in under 1 second might warrant 5 seconds. The metric data you’ve already collected is a good guide for calibrating it.
Once saved, the metric runs while the action is active. If execution exceeds the threshold, a snapshot can fire. If it never does, the duration data still accumulates and you get the full timing distribution regardless.
If you have feedback on what you’d want to see next I’d love to hear from you. We’re actively working on expanding this capability, and will soon give your AI coding agents the ability to place these too via the Lightrun Runtime Context MCP.
Get the full guide to set triggered snapshots
Frequently asked questions
A snapshot is triggered when the elapsed time between the Tic and Toc lines, or the total execution time of a method, exceeds the millisecond threshold you defined. The snapshot fires at the Toc line (Tic & Toc) or at method exit (Method Duration).
Lightrun uses sandboxed instrumentation that is designed to have minimal impact on production performance. The snapshot only fires when the threshold is exceeded, so it is does not capture data on every execution.
You control this with the Max Snapshot Hits setting. Once that limit is reached, the metric continues collecting duration data but no additional snapshots are captured
Yes. The snapshots output to the Lightrun plugin and can also target Stdout, StatsD, Prometheus, or Dynatrace depending on your configured integrations.
Currently the auto-triggered snapshot capability is available for Java/JVM applications only, via the JetBrains plugin from version 1.87. Support for additional languages and IDEs is on the roadmap.


