Why CI/CD Pipelines Miss Runtime Failures
Jun 16, 2026 / Updated: Jun 16, 2026


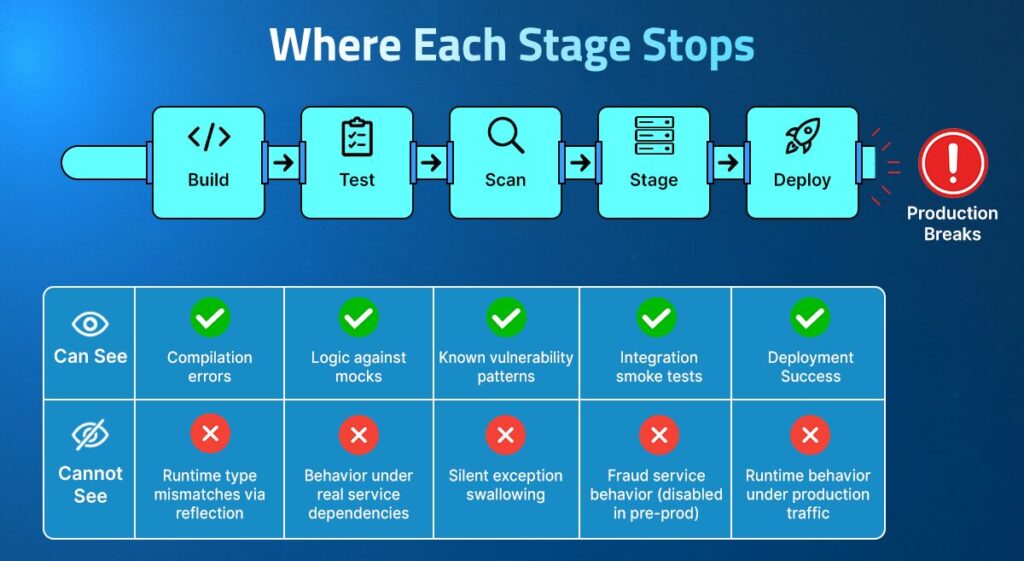
CI/CD pipelines do four things: it builds code, runs tests against mocked dependencies, lints for style violations, and scans for known vulnerability patterns. What it cannot do is validate how that code behaves under real users, real service responses, and real runtime constraints that staging was never configured to reproduce. That entire class of failure clears every gate cleanly and surfaces only in production.
Key Takeaways
- CI/CD pipelines validate structure not behavior: build, test, lint, scan. They cannot confirm what code actually does real production services enforce constraints that mocked environments skip.
- 43% of AI-generated code changes require manual debugging in production after passing QA and staging, and 88% of organizations require two to three manual redeploy cycles just to verify a single fix.
- Code compiles cleanly, passes every test, and ships through a green pipeline, only to fail silently at runtime because a reflection-based setter writes a String into a boolean field.
- Lightrun’s MCP (Model Context Protocol) connects AI coding assistants directly to live production execution, surfacing variable state, call stacks, execution counts, and latency at any line of code, without redeployment and without leaving the IDE.
- The fix in this blog was confirmed against real production execution before a single line of changed code was deployed. Most teams currently need two to three redeploy cycles to verify a single fix; this collapsed that to one, because the evidence came from the live JVM, not from staging or guesswork.
What CI/CD Pipelines Actually Validate
CI/CD pipelines validate structure: whether the code compiles, whether tests pass against mocked dependencies, and whether known vulnerability patterns appear in the static scan. They do not validate behavior, what the code actually does when real users, real service dependencies, and real runtime type constraints converge in production.
This isn’t a gap you can close by adding more tests or tightening staging. The build compiles cleanly because the JVM resolves reflection at runtime, not at compile time. Tests pass because they mock the classes the reflection path runs against. Staging passes because its downstream services are intentionally configured for development velocity, not production fidelity.
Each gate is working correctly, but none of them was designed to reach the environment where this class of failure actually fires.
Every team that ships code through a CI/CD pipeline eventually hits the same gap: a change that passes every automated check fails in production, and by the time it does, the runtime state that would explain why is already gone.
Why Runtime Failures Bypass Every CI/CD Pipeline Gate
Runtime failures bypass the pipeline because the pipeline runs code in an environment that structurally cannot reproduce the conditions where they occur.
The specific failure class this article covers, a reflection-based type mismatch that fires silently under a production service constraint, clears every gate for a concrete reason at each stage:
- Build: reflection is resolved at runtime, not compile time. The type mismatch is invisible to javac.
- Unit tests: tests mock TradeRequest and never exercise the reflection path against the live class from the common model.
- Static scan: no known vulnerability pattern matches a legal reflection call with an incorrect argument type.
- Staging: the downstream fraud service is intentionally configured to skip validation in pre-prod mode. The code path that enforces the highValue constraint never fires.
- Deploy: packaging validates structure, not runtime behavior. A clean artifact ships.
The failures that escape CI/CD aren’t random. They fire under one specific condition: when real production services enforce constraints that mocked environments skip. They don’t appear in diffs, they don’t appear in test output, and they don’t trigger alerts. They appear in production, under real traffic, on the first trade above $10,000.
The failures that escape CI/CD are not random.
They fire under one specific condition when real production services enforce constraints that mocked environments skip.
These failures do not appear in diffs. They do not appear in the test output, and they don’t trigger alerts. They appear in production, under real traffic, on the first trade above $10,000.
Why Reflection Call that looks correct and fail silently
For trades above $10,000, the downstream fraud service requires that highValue be true in the incoming TradeRequest. The developer used a Java reflection to set it inside TradeExecutionService.java, bypassing the Lombok-generated setter, and wrapping the call in a try-catch to handle any errors:
| // Inside executeTrade, before calling fraud service if (totalCost.compareTo(BigDecimal.valueOf(10000)) > 0) { try { java.lang.reflect.Field field = TradeRequest.class.getDeclaredField(“highValue”); field.setAccessible(true); field.set(request, “true”); // Setting as String instead of boolean } catch (Exception e) { log.error(“Error setting high value flag: {}”, e.getMessage()); } } |
The code attempts to flip a boolean flag before fraud validation runs, Java refuses the assignment because the types don’t match, the catch block swallows the IllegalArgumentException, and execution continues as if the flag was never touched.
From a reviewer reading the diff, this looks defensive: it wraps the reflection call in a try-catch block, logs the error if something goes wrong, and ensures the field name matches the model. The problem is invisible in the source.
The highValue field in TradeRequest.java is declared as boolean. Java’s reflection layer throws an IllegalArgumentException when you attempt to assign a String to it. The exception is swallowed by the catch block; highValue remains its default false, and execution continues directly into fraud validation, where every trade above the $10,000 threshold is now rejected because the flag was never set.
How a Green Pipeline Ships a Broken Artifact
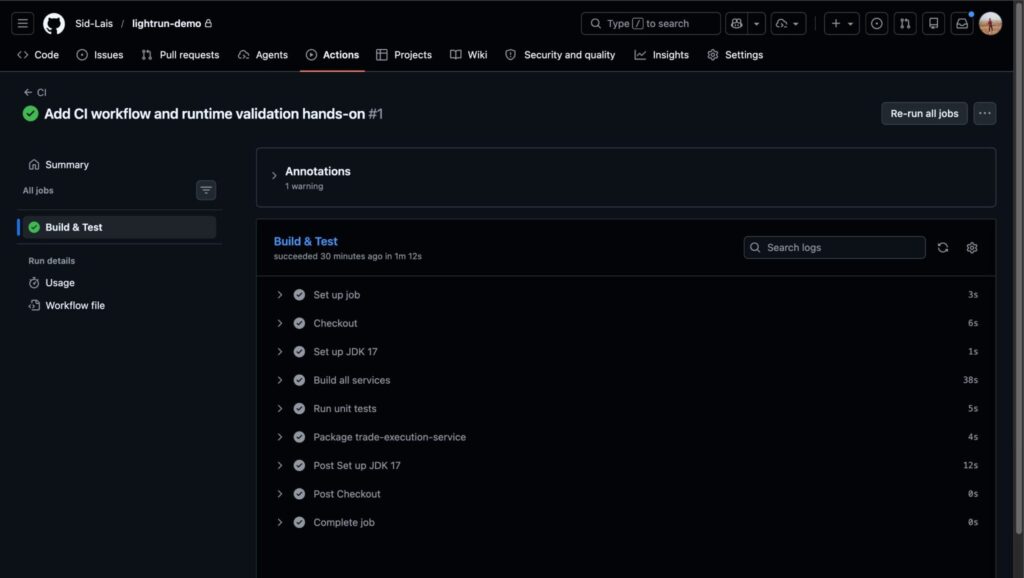
The .github/workflows/ci.yml in this repository runs four stages on every push: checkout, JDK 17 setup, Maven build, and unit tests. Every stage passes.
| jobs: build-and-test: name: Build & Test runs-on: ubuntu-latest steps: – uses: actions/checkout@v4 – uses: actions/setup-java@v4 with: java-version: “17” distribution: temurin cache: maven – run: mvn -B clean install -DskipTests – run: mvn -B test – run: mvn -B -pl trade-execution-service -am package -DskipTests |
The run shows four green stages, no warnings, not because the pipeline caught everything, but because it has no mechanism to flag a failure that only exists at runtime.
The change merges, the artifact ships, and production receives the new trade-execution-service jar already containing the broken reflection setter.
The Lightrun Runtime Sensor attached to the prod JVM begins intercepting live execution as soon as the service starts.
- The package produces a clean artifact because packaging validates the structure, not the runtime behavior
The run for this exact commit shows four green stages, no warnings. Not because the pipeline caught everything it should, but because it has no mechanism to flag a failure that only exists at runtime.
The change merges.The artifact ships. Production receives the new trade-execution-service jar, already containing the broken reflection setter. Lightrun runtime agent attached to the prod JVM begins intercepting live execution as soon as the service starts.
Hands-On: Catching the Bug in Production with Lightrun MCP
The Lightrun MCP integration closes the production debugging gap by connecting AI coding assistants directly to live runtime execution, surfacing variable state, call stacks, and execution counts at any line without redeployment. This walkthrough shows exactly how.
The bug is live: trades above $10,000 are being rejected. The logs confirm an error, but not why highValue is still false after the reflection call fires. Staging cannot reproduce it. Adding visibility means another deployment. The only place the evidence exists is inside the running JVM, at the exact line, under real production traffic.
The engineer opens Claude Code in VS Code with Lightrun MCP attached and asks one question:
“What is the runtime state of the highValue field on TradeRequest for high-value trades hitting TradeExecutionService.executeTrade() in production right now?”
Lightrun MCP calls the runtime sensor attached to trade-demo-trade-execution-service-prod, places a conditional snapshot at the exact line where the fraud validation call fires, and begins collecting execution evidence from real production traffic. No redeploy, no log statement, no staging reproduction.
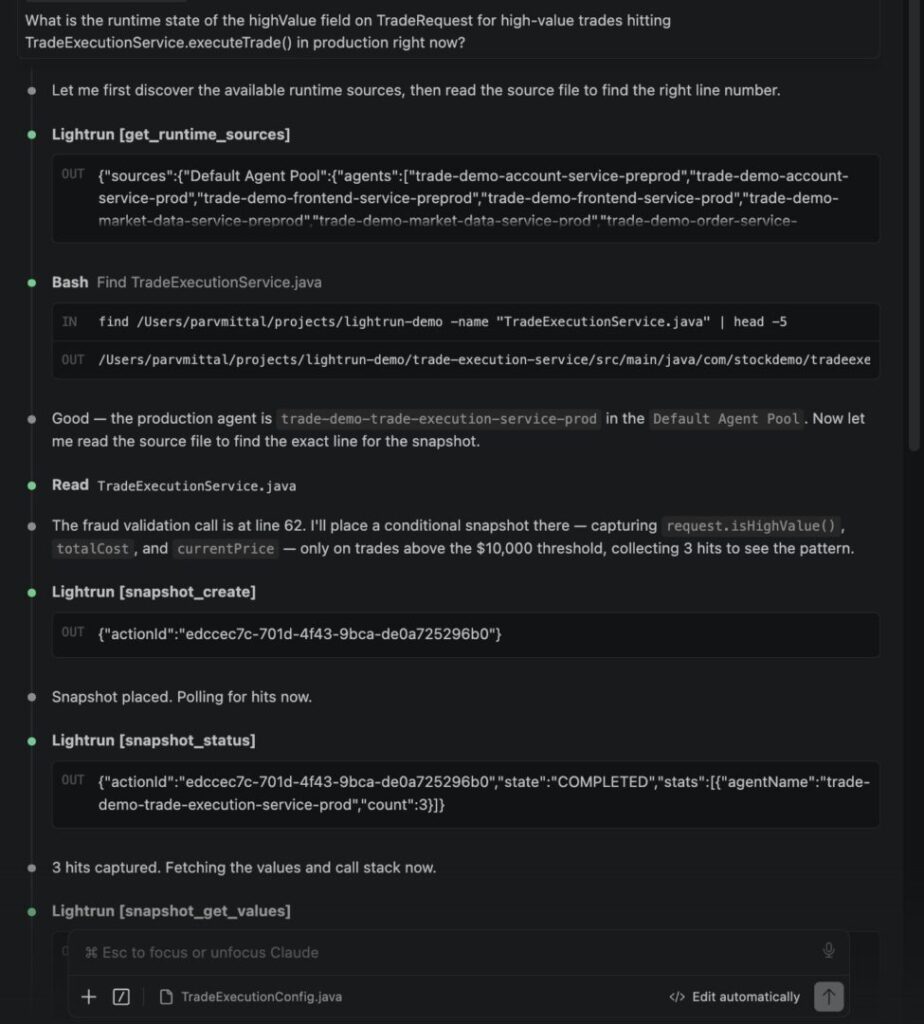
[Claude Code chat panel in VS Code showing the Lightrun MCP tool call with TradeExecutionService.java open at the reflection block, condition set, target expression populated]
The snapshot is placed directly from the chat session against the live production agent, with the source file open alongside it, so the engineer never leaves the editor, while the AI instruments production.
Step 1: The Snapshot Surfaces the Type Mismatch
The Runtime Sensor captures execution state at line 62 (isValid = fraudService.validateTrade(request)) on every high-value trade, three times, within seconds of the snapshot being placed. The values returned are not inferred from the source. They are the actual contents of memory on the running JVM at the moment each request crossed the $10,000 threshold.
| User | Symbol | Qty | currentPrice | totalCost | request.isHighValue() |
| Jamie Paul | TSLA | 37 | $307.79 | $11,388.23 | false (boolean) |
| Jerome Hampshire | MSFT | 40 | $387.81 | $15,512.40 | false (boolean) |
| Marco Polo | GOOGL | 68 | $177.29 | $12,055.72 | false (boolean) |
Every trade clears the $10,000 threshold by a significant margin, confirming that the high-value branch is firing on every execution. But request.isHighValue() returns false on all three, despite the code on the previous lines explicitly attempting to set it to “true”. The reflection call fails; the exception is swallowed, and fraud validation receives a request with the flag set to its default value.
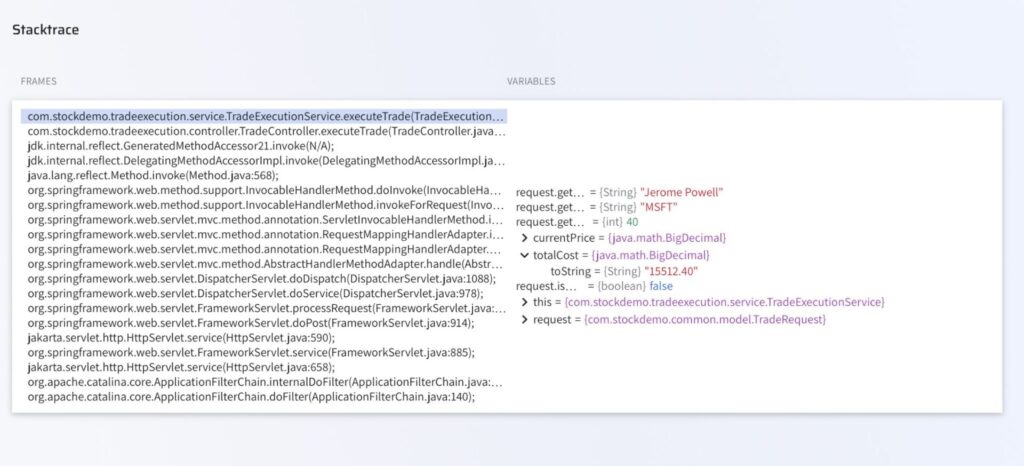
[Lightrun variables panel for the Jerome Powell/MSFT hit at line 62, showing request.isHighValue() = false (boolean), totalCost, and the full call stack confirming a live production HTTP request]
The type annotation (boolean) next to false is what makes the mismatch immediately visible: the field is a boolean, but the reflection call was attempting to assign a String, which Java refused with an IllegalArgumentException that the catch block silently swallowed.
Step 2: The Call Stack Confirms This Is a Live Production Request
The same snapshot captures the full call stack, proving that this is a real production HTTP request path, not a test harness or a synthetic trace, and it was also given by Claude when we ran an Lightrun MCP in step 1:
| frame 0 TradeExecutionService.executeTrade TradeExecutionService.java:62 frame 1 TradeController.executeTrade TradeController.java:21 frame 2 InvocableHandlerMethod.invokeForRequest InvocableHandlerMethod.java:190 frame 3 ServletInvocableHandlerMethod.invokeAndHandle …java:118 frame 4 RequestMappingHandlerAdapter.handleInternal …java:891 frame 5 DispatcherServlet.doDispatch DispatcherServlet.java:1088 frame 6 FrameworkServlet.doPost FrameworkServlet.java:914 frame 7 HttpServlet.service HttpServlet.java:590 |
This is a real user hitting a real endpoint in production, not a test harness or a synthetic probe.
The call originates from TradeController.executeTrade via a live HTTP POST to /api/trades/execute, passes through the Spring dispatcher, and reaches TradeExecutionService.executeTrade, where the snapshot fires. There is no ambiguity about the execution context.
Step 3: Blast Radius Confirmed Across the Service Boundary
The FraudService running on the downstream service receives every high-value trade request with highValue still false.
Its validation logic at line 34 of FraudService.java checks if (!(highValue instanceof Boolean) || !((Boolean)highValue)) and sets result.reason = “highValue flag not set on fraud verification request.” before returning a rejection. Every high-value trade is declined.
The upstream error appears in the production log on every affected request:
| ERROR … TradeExecutionService : Error setting high value flag: Can not set boolean field com.stockdemo.common.model.TradeRequest.highValue to java.lang.String |
This error fires on every single high-value trade request; the exception message confirms the exact type mismatch; and the downstream fraud service receives a request with the flag permanently set to false.
The screenshot below shows both ends of the service boundary at once: the terminal on the left is tailing the production log and grepping for the exact error message, while VS Code on the right has FraudService.java open in the rejection branch, which fires on every request where highValue is false.
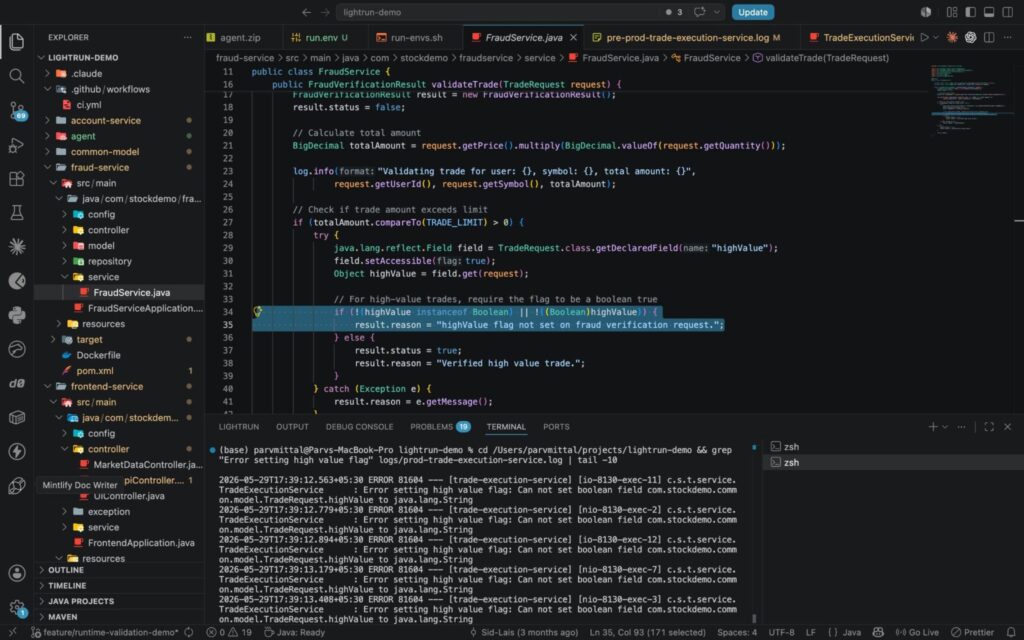
As you can see, the error is not an intermittent edge case. The live log shows 92 occurrences within a single 60-second window under real production traffic, and every one of those executions results in a fraud rejection on the downstream service. This is the blast radius, confirmed from both ends of the service boundary without a single additional log statement.
Four steps, one green pipeline, one silent production incident. The diagram below traces exactly how they connect.
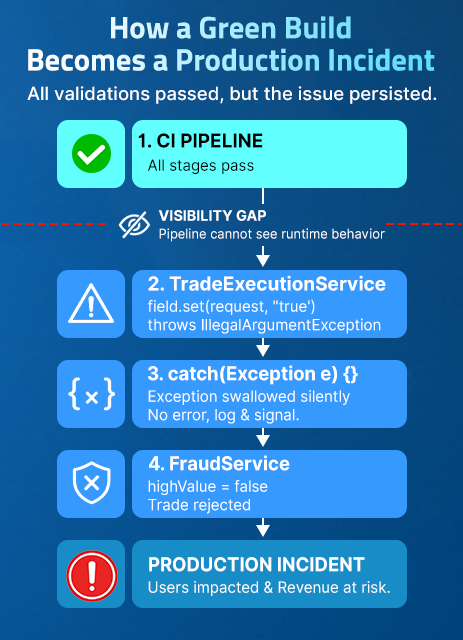
The dotted line between node 1 and node 2 is where every CI/CD pipeline stops. Everything below it only exists at runtime.
How Lightrun Surfaces What the Pipeline Cannot See
Lightrun’s Runtime Sensor closes the production debugging gap by running inside the live JVM through Sandboxed Instrumentation, a patented read-only environment that observes execution without modifying it, without redeployment, and without affecting the users whose traffic generates the evidence.
This is architecturally different from a sidecar or an external observability tool reading pre-configured telemetry: the sensor operates at the execution level, at any line, under the exact conditions that production traffic creates, for failures that produced no pre-existing signal.
Three capabilities made the diagnosis above possible:
- Conditional snapshots capture variable state and call stacks at any executable line only when a specific condition is true, allowing high-frequency paths to be observed without flooding the agent. The totalCost.doubleValue() > 10000 condition in this demo meant that only trades above the threshold triggered the capture, producing exactly three clean, evidence-quality hits from thousands of total executions.
- Execution counters measure how often a specific line fires within a sampling window, answering the question a reviewer always asks: Is this an edge case, or is this happening constantly? The answer in this case was 92 times in 60 seconds, which immediately changes the severity classification of the finding.
- TicToc duration measurement instruments the wall-clock time between any two executable lines in the same execution path, surfacing latency and variance across the service boundary into FraudService.validateTrade() without a profiler, without redeployment, and without any instrumentation code in the repository.
All three run inside the Lightrun Sandbox, patented read-only environment. The live service is untouched, no redeployment is triggered, and no users are affected by the instrumentation itself.
How to Validate a Fix Against Production Before It Ships
The fix is a single line. The reflection block is replaced with the Lombok-generated setter that was always available on the boolean field:
| // Before — reflection silently swallows the type mismatch try { java.lang.reflect.Field field = TradeRequest.class.getDeclaredField(“highValue”); field.setAccessible(true); field.set(request, “true”); // String into boolean → IllegalArgumentException } catch (Exception e) { log.error(“Error setting high value flag: {}”, e.getMessage()); } // After — Lombok-generated setter on the boolean field |
Before this fix is deployed, the same Lightrun snapshot is placed at line 55 of the updated service.
The Lightrun Sandbox validates the corrected execution state against real production traffic, without deploying the fix to users. The snapshot returns three hits, all with request.isHighValue() flipped to true.
| User | Symbol | Qty | currentPrice | totalCost | request.isHighValue() |
| Stephen Callabasas | MSFT | 51 | $398.00 | $20,298.00 | true (boolean) |
| Warren Charles | MSFT | 73 | $398.00 | $29,054.00 | true (boolean) |
| Christine Jones | MSFT | 39 | $398.00 | $15,522.00 | true (boolean) |
[Lightrun variables panel after the fix — same layout as the prefix screenshot, same production agent, same conditions. highValue = true (boolean) is the only changed value]
The before-and-after captures use identical tooling in the same environment. The only thing that changed between the two snapshots is the code, and the Runtime Sensor confirms the behavioral change directly in the execution evidence.
This is the core missing capability Lightrun’s State of AI-Powered Engineering 2026 Report identifies: 88% of organizations currently require two to three manual redeploy cycles to verify a single AI-generated fix because they lack a way to validate against live execution state before promotion. The Lightrun Sandbox closes that cycle at one.
How to Add a Runtime Validation Gate to Your Pipeline
A runtime validation gate is a pipeline stage that places instrumentation at a specific line, waits for real traffic to exercise that path, asserts that the observed behavior matches the expected state, and blocks promotion if the assertion fails. This makes it the only stage in a standard CI/CD pipeline that validates behavior rather than structure.
The CI/CD workflow in this repository includes a commented-out runtime gate stage that formalizes what was demonstrated above:
| # runtime-gate: # name: Runtime Validation (Lightrun) # needs: build-and-test # steps: # – name: Validate highValue flag on high-value trades # run: | # ./scripts/lightrun-runtime-gate.sh \ # –agent trade-demo-trade-execution-service-prod \ # –file com/stockdemo/tradeexecution/service/TradeExecutionService.java \ # –line 62 \ # –assert “request.isHighValue() == true” |
Instead of asking “did the code change look correct,” the pipeline now asks “did the code behave correctly under real traffic,” and blocks the release if the answer is no.
This stage places a Lightrun snapshot at the fraud validation line after deployment to a canary environment, wait for high-value trades to hit the instrumented path under live traffic, assert that request.isHighValue() is true on every captured hit, and block promotion to full production if the assertion fails. The pipeline goes from approving code by structure to approving code by behavior, which is the only standard that actually reflects what production will experience.
The YAML above is the implementation. The diagram below is what it looks like across the full pipeline.
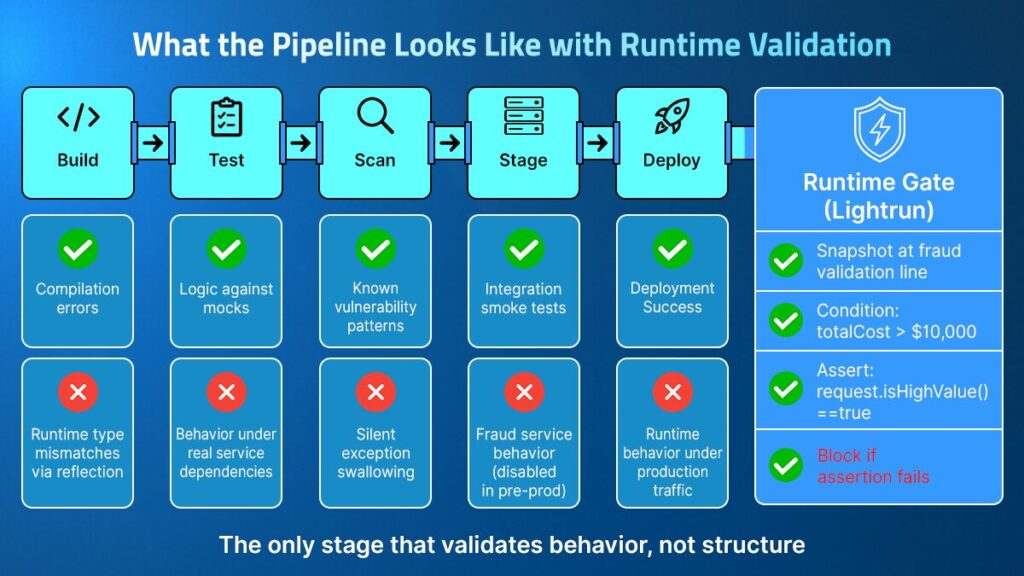
The five stages on the left have not changed. The Runtime Gate on the right is the only addition and the only stage where a behavioral assertion can block promotion.
How Lightrun Fits Across the Delivery Lifecycle
Runtime Context isn’t only useful after a failure. The same capability that surfaced the type mismatch above extends across every stage of the delivery lifecycle, shifting validation progressively earlier.
At build time, Lightrun’s MCP integration lets engineers and AI coding assistants query live runtime behavior from inside the IDE before a change is committed.
A developer working on the fraud validation path could ask Claude Code, Cursor, GitHub Copilot, or any other AI coding assistant to confirm the request.isHighValue() actually contains under production conditions before writing the setter, eliminating the need for the reflection workaround entirely.
At review time, the same MCP snapshot can be attached to the change as hard evidence of execution, giving the reviewer more than just a diff to approve. Instead of inferring what the code will do under production conditions, the reviewer sees what it does, with real variable values and a real call stack from the exact execution path the change modifies.
After deployment, the Lightrun runtime agents stay attached to the live production service. If behavior drifts from what was validated at the Sandbox stage, the same conditional snapshot can be placed again in seconds without a new deployment cycle, closing the confirmation gap at the point of observation rather than at the next incident.
Between incidents, Lightrun’s Deep Code Research enables engineering teams to review live system behavior and surface unusual execution patterns before they trigger alerts, shifting reliability from reactive incident response to an ongoing engineering discipline.
CI/CD Pipeline vs. Lightrun: What Each Layer Validates
| Validation Need | CI/CD Pipeline | Lightrun MCP + Sandbox |
| Compilation correctness | Yes | Not needed |
| Test coverage against mocks | Yes | Not needed |
| Static analysis and vulnerability scanning | Yes | Not needed |
| Runtime type correctness under live traffic | No | Conditional snapshot confirms field type and value |
| Branch decisions under production conditions | No | Execution counter confirms hit frequency |
| Latency across service boundaries | No | TicToc duration captures live call timing |
| Fix validation before deployment to users | No | Lightrun Sandbox validates against real execution state |
| Downstream service behavior confirmation | No | Cross-service snapshot confirms blast radius |
The Structural Gap CI/CD Will Never Close
The CI/CD pipeline will keep going green. It’s working exactly as designed. The problem is that a green build is structural evidence, and structural evidence stops at the runtime visibility gap.
What’s on the other side of that gap is execution: real type constraints, real service responses, real traffic. That’s not something you can test into existence. It’s something you have to observe, and the only tool that can observe it is one that can capture the failure live.
Both the Lightrun Runtime Sensor and AI SRE are built on the same principle: in a world where AI generates more code faster, AI is not the source of truth, runtime context is, and the pipeline will only be as reliable as the environment it actually runs against.
FAQs
Because it validates code against mocked dependencies and a staging environment configured for development velocity, not production fidelity, which means any failure that depends on a live runtime type constraint, a real service response, or an execution path staging never reproduces will clear every gate cleanly and only surface under real traffic.
A pipeline stage that places instrumentation at a specific line, waits for real traffic to exercise that path, and asserts that the observed behavior matches the expected state before the change promotes, making it the only stage that validates behavior rather than structure.
Runtime context is live visibility into variable state, call stacks, and dependency responses captured at any line without redeployment. The pipeline does not capture it because it runs code in isolation, while production runs it against real users, real data, and real concurrency that only exist in the live environment.
It attaches a Model Context Protocol server to AI coding assistants, including Claude Code, GitHub Copilot, and Cursor, so when an engineer asks how code behaves in production, the integration places a conditional snapshot at the relevant line and returns the execution evidence directly into the chat session without a context switch or redeployment.
Staging approximates production on different load profiles and simplified service configurations. The Lightrun Sandbox runs the runtime sensor against the live production JVM in patented read-only mode with zero performance overhead, so a fix validated there is validated against the actual execution state it will face when it ships.