Why Blast Radius Analysis Does Not End When Alerts Fire
May 07, 2026

Modern distributed systems fail in ways that can bypass even well-designed isolation patterns. When a failure is actively propagating across services at four in the morning, the question shifts from “how do we limit the blast radius” to “how do we confirm what it actually is.”
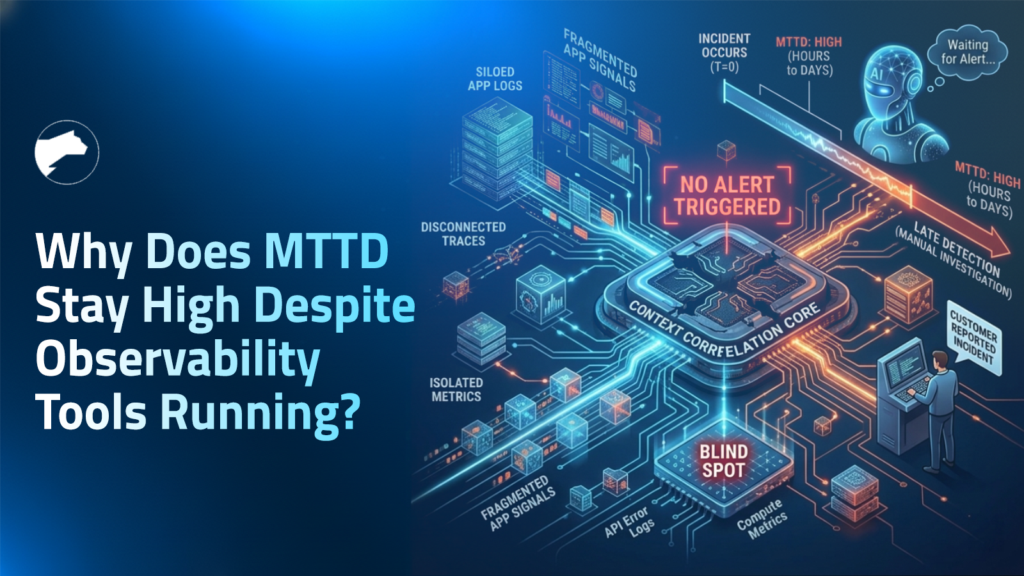
Monitoring shows which services are in the impact zone, but it cannot show what code path caused the failure to spread, or whether it has stopped. That gap between structural scope and execution scope is where most MTTR is lost.
Key Takeaways
- Silent failures produce no signal: No exception thrown, no error logged, HTTP 200 returned on every request. Standard observability sees nothing because it was built to detect failed output, not wrong output.
- Every alert was written for a failure you already knew about: Investigations stall not because teams are slow, but because novel failure modes were never instrumented. You cannot write an alert for a brand-new failure mode.
- The bottleneck is confirmation, not detection: According to the State of AI-Powered Engineering 2026 Report, 60% of engineering leaders say lack of visibility into live system behavior is the primary bottleneck in incident resolution. Structural scope is confirmed in minutes. Execution scope takes hours without the right evidence.
- The cost is real engineering time: 38% of weekly engineering capacity is consumed by debugging, verification, and environment-specific troubleshooting, the equivalent of two full working days every week.
- Runtime sensor is the structural fix: When execution-level evidence can be generated on demand at the exact failure line without redeployment, the investigation confirms what happened in a single session rather than across multiple deployment cycles.
Before getting into the tools, the tooling gaps, and the solution, we should start from the ground up. What blast radius actually means in a live production system, why confirming it has become significantly harder than containing it, and why the gap between knowing which services are down and understanding why is where most incident time is actually lost.
What Is Blast Radius in Software Engineering?
Blast radius is the range of impact when a production failure occurs. It is measured by how far consequences travel across services, users, and transactions before they are contained. The term originates from explosive engineering, and it describes the physical area damaged by a detonation. In software, it maps directly to how far the consequences of a failure propagate across a distributed system.
Every blast radius has two dimensions that every incident response decision depends on:
- User impact: How many users, tenants, or transactions are affected by incorrect or unavailable behavior
- Service propagation: How many upstream and downstream services are pulled into the failure alongside the one that originated it
Getting either dimension wrong means the remediation either undershoots, leaving the root cause of the issue in place, or overshoots, introducing instability into services that were never actually in the blast radius.
Three blast radius profiles that show the range:
| Profile | User Impact | Service Propagation | Visibility |
| Bad database migration locks one write table | Low | Low | Immediate |
| Shared authentication outage takes down platform login | High | Moderate | Immediate |
| Silent type mismatch corrupts payloads across three downstream consumers, no exception thrown | Low alert signal | High | Invisible on the dashboard |
That third profile is not an edge case. It is the default failure mode in modern microservice architectures, and it is exactly why the traditional approach to managing blast radius is no longer enough.
How Teams Have Traditionally Managed Blast Radius
The traditional answer has always been that architecture and design system failures stay isolated, regardless of what breaks, and the blast radius stays small, regardless of which component fails.
The five core design-time blast radius reduction strategies:
- Microservice isolation keeps a fault in one service from taking down adjacent ones, so a broken recommendation engine does not affect checkout
- Circuit breakers stop requests to a failing downstream service before timeouts cascade upstream and pull additional services into the failure.
- Canary deployments roll changes to a small traffic slice first, so a bad change only affects a subset of users while the team evaluates whether to proceed or roll back.
- Regional isolation uses cloud infrastructure boundaries to keep a US-EAST-1 failure from reaching EU-WEST-1
- Feature flags decouple deployment from release, so a broken feature can be turned off without triggering a full rollback.
These patterns work well for the failure modes they were designed to contain, and every well-run distributed system uses some combination of them. However, they are preventative controls defined during system design, before a live incident begins.
They reduce how far a failure can spread architecturally, but during a P1, the team still needs to confirm how far the failure did spread in the running system, and that requires runtime evidence that the architecture itself cannot provide.
Why Modern Systems Made Blast Radius Harder to Confirm
Two forces have made blast radius significantly harder to confirm in modern production environments, and neither was a factor when the isolation patterns most teams rely on were designed.
Microservice Complexity
In a monolith, the blast radius is immediately obvious because when the monolith fails, the entire blast radius is visible at once. In a microservice architecture, silent data corruption in one upstream service can propagate to multiple downstream consumers, which continue processing requests without errors but with incorrect data.
Those services appear completely healthy on the monitoring dashboard because they are not failing; they succeed with incorrect inputs, passing a corrupted payload to the next service in the chain without throwing a single exception. No alert fires, and the blast radius extends silently across the dependency graph.
AI-Accelerated Deployment Velocity
Code ships faster than ever before, exceeding the capacity of review processes to catch. In addition, changes interact with dependency graphs that are more complex than any single engineer can fully reason about before a change lands in production.
When something breaks, the blast radius of a bad change has more surface area to cover before anyone notices. By the time an alert fires, the failure has often already spread beyond any design-time isolation pattern intended to contain it.
Faster deployment velocity increased the operational complexity of modern systems. Failures now propagate across distributed services, runtime dependencies, and asynchronous execution paths faster than preconfigured telemetry can explain them. The result is that identifying affected services is no longer the hardest part of incident response.
Confirming what actually executes inside those services becomes the real challenge.This distinction creates two distinct blast-radius scopes that every incident investigation depends on.
The Two Scopes of Blast Radius Every SRE Needs to Understand
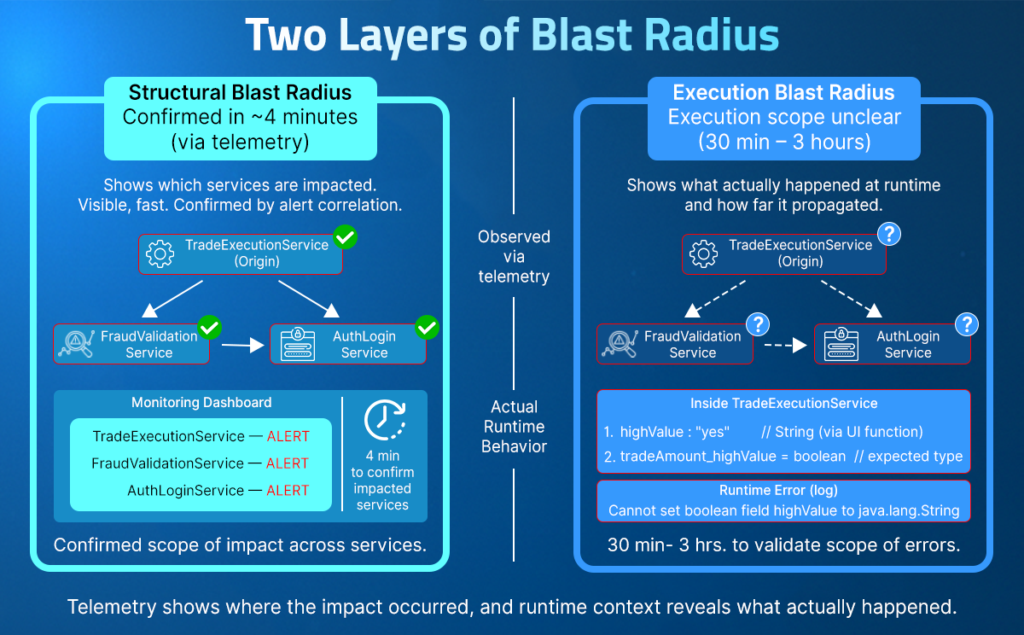
Blast radius in a live production incident has two distinct scopes: structural blast radius and execution blast radius. Structural blast radius is visible within minutes. Execution blast radius is where every investigation stalls, because confirming which code paths drove the propagation, what variable values were present, and where the failure genuinely stopped requires evidence that pre-configured telemetry was never designed to capture.
Structural Blast Radius: What the Service Map Shows
Structural blast radius is the architectural impact zone of a failure: which services are in the dependency path, which alerts have fired, and which teams to page. This layer becomes visible within minutes of a P1, and modern monitoring stacks handle it well.
What structural blast radius confirms:
- Which services are in the impact zone
- Which alerts have fired across the affected topology
- Which teams to page and in what order
- Which region is affected, and which looks clean
Execution Blast Radius: What Actually Ran and Why
Execution blast radius answers a completely different set of questions that structural scope cannot touch:
- Which specific code path ran during the failing request set?
- What variable value was passed across the service boundary, and in what type?
- Is the failure in the third service a downstream consequence or an independent condition?
- Is EU-WEST-1 genuinely outside the blast radius or silently building toward one?
These questions require evidence of what was executing inside running services at the time of the failure. In a novel failure mode, those signals were never captured, and no amount of correlation over existing telemetry can generate them. The investigation narrows to the boundary of existing telemetry and stalls there, turning a 30-minute blast radius assessment into a 3-hour redeployment loop.
A Live Blast Radius Investigation: What the Team Sees and What Stays Hidden
Consider a trading platform where every trade above $10,000 must pass a high-value fraud check before it settles. TradeExecutionService handles trade execution, FraudService runs the fraud validation, and AuditLogService records every transaction for compliance. All three are on the critical path for every high-value trade the platform processes.
At 2:14 am, a P1 fires on TradeExecutionService.java. Within four minutes, FraudValidationService and AuditLogService are also alerting in US-EAST-1. EU-WEST-1 looks clean. A recent code change touched the trade execution flow forty-seven minutes ago.
Three answers needed before any remediation decision:
- Is the failure still spreading or already contained?
- Where did it originate, and what caused it to propagate into FraudValidationService?
- How many trades were processed without fraud validation during the forty-seven-minute window?
What does the Dashboard show at 2:14 am?
The service map surfaces the structural blast radius in four minutes: three services in the impact zone, one region, one alert cluster. The team knows which engineers to page. That part of the investigation works exactly as designed.
Visible on the dashboard:
- Three services with elevated error rates in US-EAST-1
- A code change to the trade execution flow was deployed forty-seven minutes before the alert fired
- EU-WEST-1 showing clean metrics
Not visible on the dashboard:
- Whether highValue is being set correctly in TradeExecutionService before it reaches fraud validation
- What type of highValue holds at the point where FraudService evaluates the threshold
- Whether FraudValidationService is rejecting trades because of a bad input from TradeExecutionService, or a local condition
- How many trades in the window passed fraud validation when they should not have
Where the Investigation Stalls
The logs confirm errors in TradeExecutionService, but capture nothing about what highValue holds at the point of fraud validation. No variable values, no type information, no indication of whether the boolean check is failing because the field was never set or because it was set with the wrong type. The instrumentation was written before this failure mode existed.
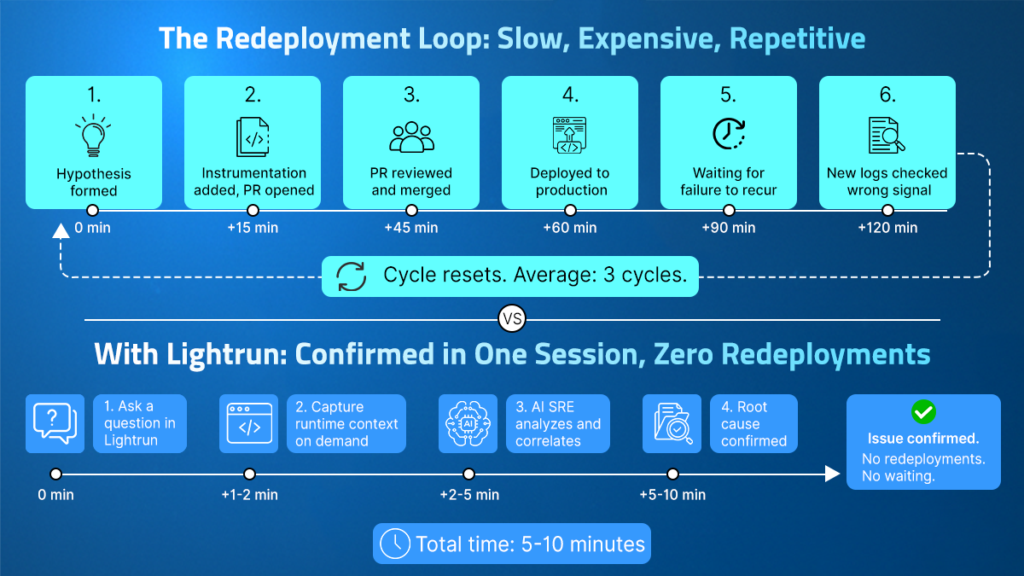
The SRE forms a hypothesis: a timeout in the validation handler is causing the rejections. They add instrumentation to the timeout handler, open a PR, get it reviewed, merge it, deploy it, and wait for the failure to recur. The new logs show the timeout is a symptom, not the cause. The hypothesis was wrong. The cycle resets, adding two more hours to the clock.
The real cause was never visible in the original instrumentation:
- TradeExecutionService computes the trade amount for its own flow and for high-value trades, attempts to set highValue to the String “true” via reflection
- The shared TradeRequest model defines highValue as a boolean field
- FraudService explicitly requires highValue to be a Boolean true before triggering fraud validation
- The runtime logs repeatedly show Can not set boolean field highValue to java.lang.String with no exception surfaced to the caller.
- FraudValidationService passed at least 556 high-value trades in the window without triggering a single fraud check, with up to 685 total trade attempts hitting the type mismatch error.
- No exception thrown. Nothing surfaced. Complete silence across three services.
The Redeployment Loop Nobody Accounts for in MTTR
Each instrumentation cycle costs between 30 minutes and 2 hours, depending on the overhead of change management. According to the State of AI-Powered Engineering 2026 Report by Lightrun, it takes three redeploy cycles to verify a production fix, with no organization surveyed able to confirm this in a single cycle. Every minute in that redeploy loop is a minute during which the execution blast radius is unconfirmed, and remediation decisions are deferred.
Why Current Tools Cannot Break This Cycle
Every tool in this category sits outside the running application and observes only what was configured to be reported before the incident occurred, which means they all face the same structural ceiling when a novel failure mode produces behavior that was never instrumented.
Monitoring and Alerting
Monitoring accurately and quickly surfaces the structural blast radius, exactly what it was designed to do. It was never designed to capture what executes inside a running service at a specific line of code during a specific request set. When a failure mode is not anticipated in the monitoring configuration, there is no signal available to surface it.
APM and Distributed Tracing
APM and tracing show how requests travel across service boundaries and where latency or errors accumulate. Traces only cover spans that were instrumented in advance. When a failure occurs within an uninstrumented code path, such as a type comparison that evaluates to false silently inside a validation handler, the trace ends at the boundary of the existing span configuration, with no visibility into what happened within that code path.
AI SRE Tools
AI SRE tools correlate signals across hundreds of services simultaneously and narrow probable causes faster than any manual process. For well-instrumented failure modes, they often close incidents without human involvement. But they frequently operate on the same pre-captured telemetry that monitoring and APM collect. When the execution-level signal explaining propagation was never captured, AI correlation reaches the same boundary as the logs. Adding more sophisticated reasoning on top of the same telemetry does not change the evidence ceiling.
The problem is not the tool’s sophistication. It is the absence of evidence for the tool to operate on, and no tool in this category was built to generate that evidence on demand from within a running service. That requires an entirely different architectural approach.
How Runtime Sensor Changes the Blast Radius Confirmation Problem
The runtime sensor gathers live execution-level evidence captured on demand from inside running services, without redeployment. Rather than observing what the application reports from outside, it captures what the application actually does while executing: variable values, execution paths, conditional branches, and dependency inputs directly from live code under real traffic at the moment the question is asked.
The Lightrun inline runtime sensor operates through the Lightrun Sandbox, a patented read-only environment that instruments any line of code in a running service without:
- Modifying the application
- Triggering a redeployment
- Introducing any performance overhead for users during the investigation
Monitoring and APM tools observe from the outside and collect what the application was configured to report. The Lightrun runtime sensor operates within the running service, generating signals that did not exist before the investigation was requested, at any code path, under the exact traffic and data conditions that produced the failure. This removes the structural constraint driving the redeployment loop entirely.
Blast Radius Investigation with Lightrun AI SRE in Practice
When the P1 fires, the first question is scope: which services are within the blast radius, how the failure propagated, and what the business impact is. Lightrun AI SRE answers this in a single query against the live running system.
Mapping the Blast Radius
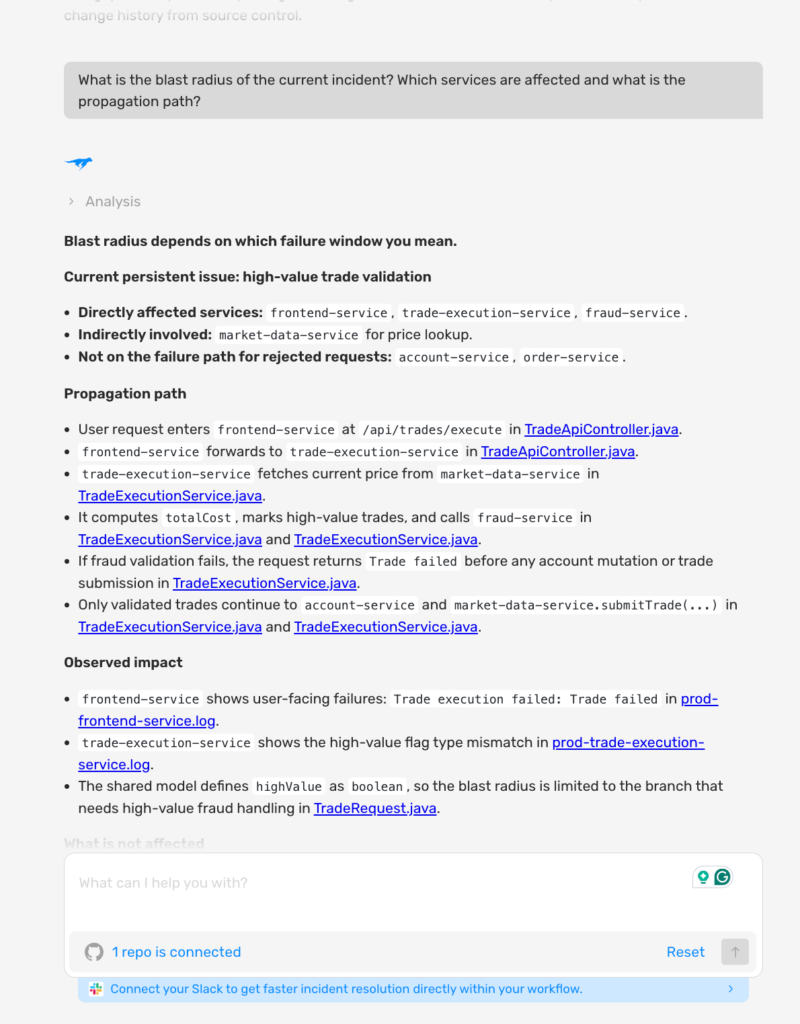
As shown in the screenshot above:
- Lightrun AI SRE mapped the blast radius in a single query: frontend-service, trade-execution-service, and fraud-service are directly affected, market-data-service is indirectly involved for price lookup, and account-service and order-service are confirmed not on the failure path for rejected requests
- The AI traced the full propagation path from the user request through the frontend-service, into the trade-execution-service, through the market-data-service for price fetch, into the fraud-service for validation, and confirmed that only validated trades reach the account-service, which directly narrows the rollback scope before a single remediation decision is made.
Confirming the Execution Scope
With the blast radius mapped, the next question is to understand what caused it. The structural scope shows which services are down. Execution scope confirms what code path drove the failure and why fraud validation was bypassed silently.
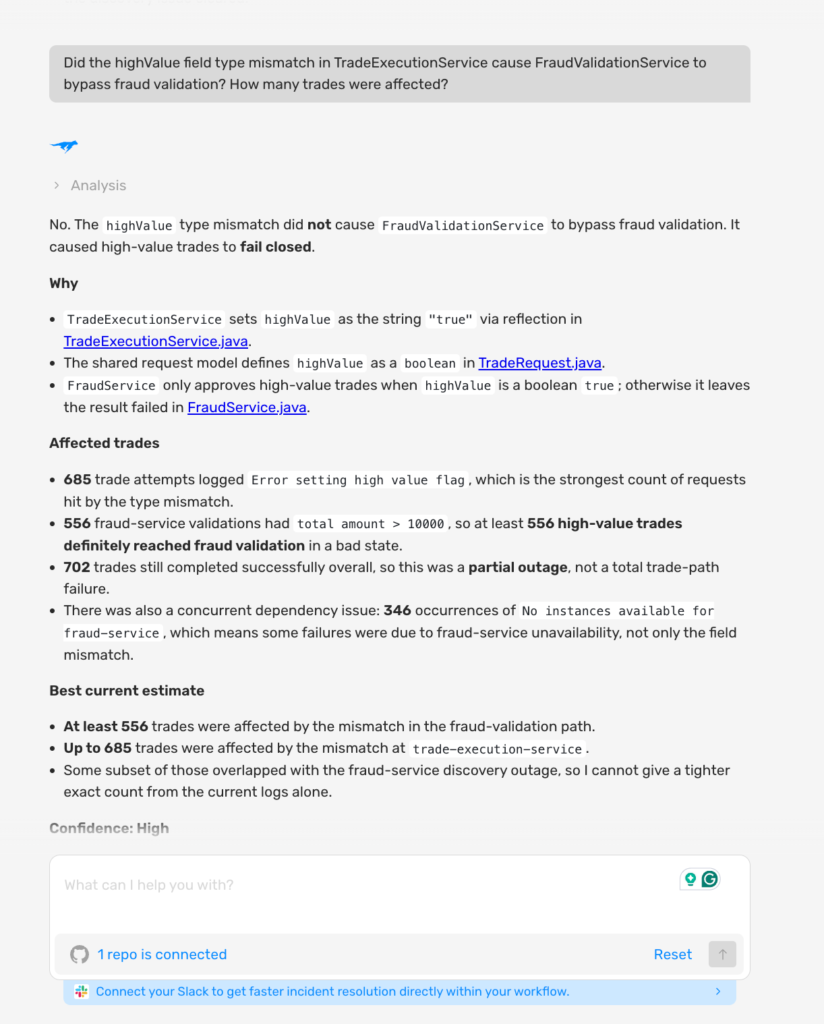
As shown in the screenshot above:
- Lightrun AI SRE confirmed with high confidence that the failure path is the highValue type mismatch: TradeExecutionService sets highValue to String “true” via reflection, but TradeRequest defines it as a boolean, causing FraudService to never receive true. At least 556 high-value trades reached fraud validation in a bad state, with up to 685 total trade attempts hitting the error, and 702 trades completing successfully, confirming this was a partial outage, not a total failure.
- The AI confirmed the fix must address the highValue boolean assignment in TradeExecutionService directly, not the threshold logic in FraudService, which recalculates the trade amount locally and is working correctly, narrowing the fix scope before a single line of remediation code is written.
What Confirmed Blast Radius Evidence Does for the Postmortem
Most postmortems reconstruct what happened from alert timestamps, available logs, and on-call notes. The execution scope is usually inferred rather than confirmed. Which paths ran, which values drove the failure, and where propagation stopped are pieced together from circumstantial signals. Action items built on inferred scope address the hypothesis about the failure rather than the confirmed failure mode, and the instrumentation gaps that allowed silent propagation often survive the postmortem unchanged.
When Lightrun’s runtime sensor captures execution evidence during the investigation, the postmortem documents what actually happened during the failure:
- The propagation path is confirmed, not reconstructed from memory
- The boundary is verified, not estimated from alert timestamps
- The exact execution conditions are on record for the next instrumentation decision
- For teams under PCI-DSS or SOC 2, the audit trail reflects what occurred, not what the team believed occurred
How Lightrun Resolves Each Layer of the Blast Radius Problem
| Challenge | How Lightrun Resolves It |
| Structural scope visible, execution scope unknown | Lightrun AI SRE generates on-demand runtime evidence inside affected services, confirming propagation paths without redeployment |
| Alert correlation shows what fired, not why it spread | Conditional snapshots capture variable values at the exact execution point where the failure occurred |
| Novel failure modes fall outside existing instrumentation | Lightrun’s runtime sensor instruments any code path with no code change and no redeployment |
| Remediation decisions made on an unconfirmed scope | Fixes are validated against the real production state before deployment in the Lightrun Sandbox |
| Postmortem built on inferred scope | Full execution-level evidence trail captured during investigation, documenting confirmed blast radius |
Reliability Is Only as Strong as the Evidence You Have
The fundamental bottleneck in modern incident response isn’t a lack of intelligence; it’s a lack of evidence. Most observability stacks are built to show you what happened in the past, capturing only the telemetry you had the foresight to configure before the crisis began. When a novel failure strikes at 4:00 AM, relying on pre-captured logs is a structural constraint that forces teams into a reactive posture.
Closing the Execution Gap
The transition from identifying a structural blast radius to confirming the execution blast radius is where most MTTR is lost. Without a way to see inside the running service, investigations inevitably stall at the boundary of existing telemetry. This gap creates a “visibility tax” that currently consumes 38% of weekly engineering capacity.
Lightrun’s runtime sensor provides the structural fix for this broken workflow. By generating execution-level signals on demand from within the running service, you can:
- Confirm Propagation Paths: Eliminate the reconstruction phase by identifying exactly which code paths and variable values were present at the time of the failure.
- Validate in One Session: Move from a hypothesis to a confirmed root cause in minutes, effectively bypassing the 3-cycle redeployment loop.
- Decouple Investigation from Deployment: Capture the evidence you need without modifying the application, triggering a redeployment, or introducing performance overhead.
Reliability is a function of certainty. By moving from inferred topology to confirmed runtime evidence, SRE teams can stop guessing the scope of an incident and start resolving it with precision.
FAQ
Blast radius is the range of impact when a production failure occurs, measured by how far consequences travel across services, users, and transactions before they are contained. It has two dimensions: user impact (how many users or transactions are affected) and service propagation (how many upstream and downstream services are pulled in). Both determine who to page, whether to roll back, and how to scope compliance reporting.
Structural blast radius is the architectural impact zone visible from dependency graphs and alert correlation within minutes of a P1. The execution blast radius is what actually ran within each affected service: which code paths executed, which variable values were present, and where the failure was genuinely contained. The execution blast radius requires runtime evidence from within running services, which pre-configured telemetry cannot provide for novel failure modes.
Microservice complexity means that failures in one upstream service can propagate silently to downstream consumers that appear healthy on the dashboard but are processing requests with incorrect data. AI-accelerated deployment velocity means code ships faster into more complex dependency graphs, giving bad changes more surface area to damage before any alert fires.
AI SRE tools operate on pre-captured telemetry. When the execution-level signal explaining propagation was never captured, AI correlation reaches the same boundary as the available logs and stalls. The problem is not the quality of the reasoning; it is the absence of execution-level evidence that the reasoning needs to operate on.
A runtime sensor operates within running services, generating execution-level evidence on demand at any code path under real traffic, without redeployment. Propagation paths, variable states, and failure boundaries can be confirmed in a single session rather than across multiple redeployment cycles, thanks to the Lightrun Sandbox’s patented read-only environment, which leaves the running service completely untouched.