Top 5 Continuous Monitoring Tools and Why Runtime Context Is the Layer They Are Missing
Apr 07, 2026 / Updated: May 11, 2026


Continuous monitoring tools track system health, performance, and behavior in real time across production environments. For a deeper understanding of how this fits into modern DevOps practices, see this guide on continuous monitoring and its impact on DevOps. They collect logs, metrics, and distributed traces across the infrastructure and application layers, giving engineering teams visibility into how their systems are running, where anomalies occur, and when something needs immediate attention. For engineering teams running distributed systems at scale, they are foundational infrastructure, not optional tooling.
- Continuous monitoring tools track system health through logs, metrics, and traces, but the data is frequently preconfigured, sampled, and often incomplete when it matters most.
- Traditional monitoring tells you what happened and where, but rarely why a specific code path executed or which variable triggered the failure.
- When the exact runtime signal is missing, engineers are forced to infer behavior, redeploy code, or wait for the next failure to reproduce conditions.
- The right continuous monitoring tool depends on your stack, team size, and what visibility gaps matter most to your engineering team.
- Runtime context fills the gap that monitoring tools leave behind, and platforms like Lightrun with AI-native, runtime-grounded reliability across the full SDLC.
It is 2 AM. An on-call engineer gets paged. Payment failures are spiking. Dashboards light up as error rates climb, latency spikes in the checkout service, and traces show failures across three downstream dependencies. The monitoring stack is working perfectly. The data is all there. And yet, hours later, the team cannot identify the cause of the system failure.
Logs show what happened. Metrics show where it slowed down. But neither tells you which variable produced the bad value, which code branch executed under real traffic, or how a third-party dependency responded at the exact moment things went wrong.
This blog covers the top five continuous monitoring tools engineering teams rely on today, what each one does well, where each one falls short, and what the layer beyond static monitoring actually looks like.
What to Look for in a Continuous Monitoring Tool
Not every monitoring tool is built the same way. Before evaluating options, engineering teams need to be clear on what they actually need from a monitoring platform. The right tool for a three-person startup looks very different from what an enterprise running hundreds of microservices across multiple cloud environments requires.
When evaluating continuous monitoring tools, the key criteria to consider are:
- Coverage: Does it monitor infrastructure, applications, logs, and traces in one place, or does it require multiple tools working together?
- Scalability: Can it handle the volume and complexity of your production environment without degrading signal quality?
- Integration: Does it fit into your existing stack, CI/CD pipelines, and alerting workflows without heavy configuration overhead?
- Alerting: How intelligent is the alerting layer? Does it reduce noise or add to it?
- Visibility depth: Does it surface service-level data only, or can it get closer to execution-level behavior?
With those criteria in mind, here are the five continuous monitoring tools that engineering teams rely on most across production environments today.
The Top 5 Continuous Monitoring Tools
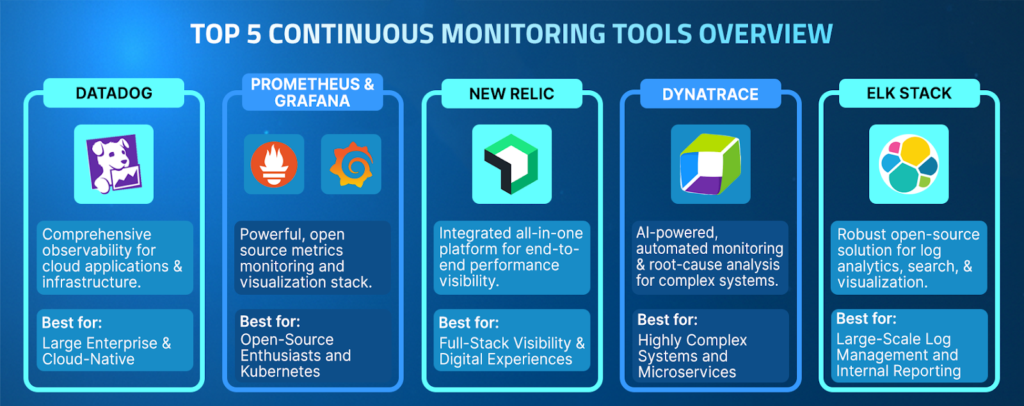
1. Datadog
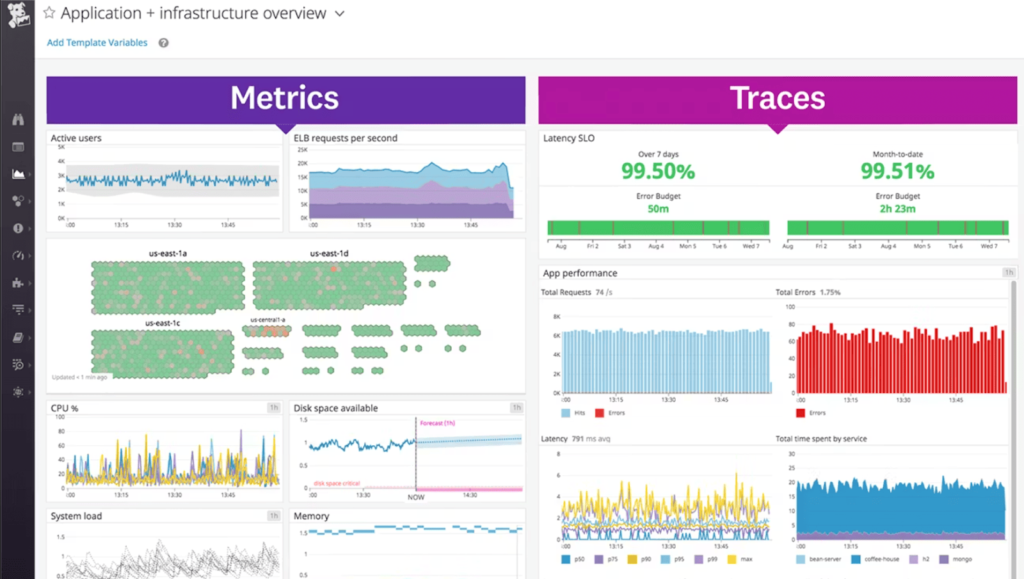
Datadog is one of the most widely adopted continuous monitoring platforms for enterprise engineering teams. It brings infrastructure monitoring, APM, log management, and distributed tracing together on a single, unified platform, giving teams a consolidated view of their entire production environment without stitching together multiple tools.
Key Features
- Full-stack observability across infrastructure, applications, and logs
- Distributed tracing with end-to-end request visibility across microservices
- AI-powered anomaly detection and intelligent alerting
- 600-plus int
- egrations covering most modern cloud and DevOps toolchains
- Real user monitoring and synthetic testing for frontend visibility
What Datadog Does Well
Datadog excels at giving engineering teams a single pane of glass across their entire production stack. For teams running complex, multi-cloud environments, the ability to correlate infrastructure metrics, application traces, and log data in one place significantly reduces the time it takes to identify where something is going wrong.
Best For
Enterprise engineering teams and mid-to-large organizations running complex, multi-cloud distributed systems that need consolidated full-stack observability in a single platform.
2. Prometheus and Grafana
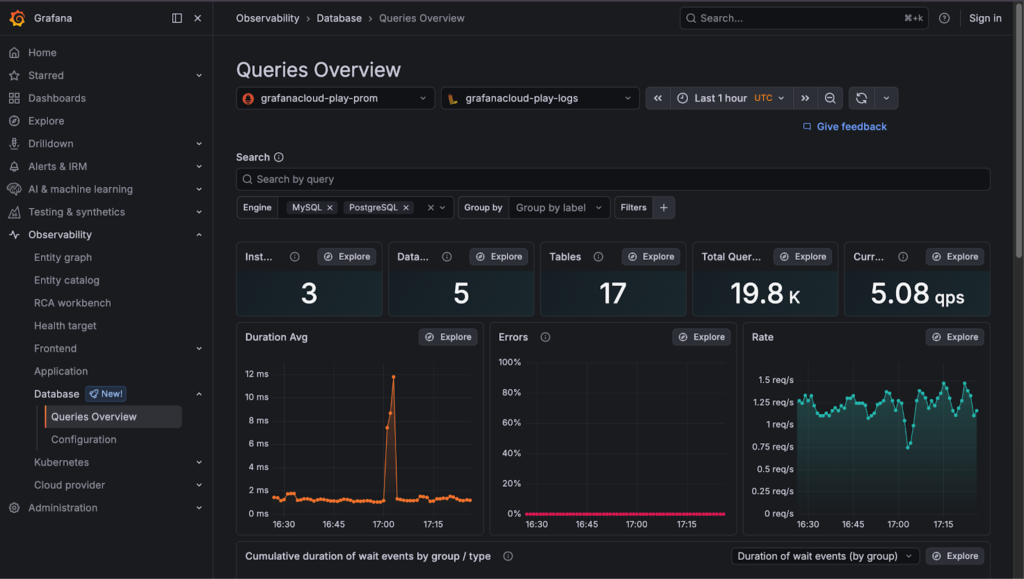
Prometheus and Grafana are the most widely used open-source monitoring stacks in modern engineering environments. Prometheus handles metrics collection and storage, while Grafana provides the visualization and dashboarding layer on top. Together, they form a highly flexible, deeply customizable monitoring foundation that engineering teams can tailor to their exact needs.
Key Features
- Powerful time-series metrics collection and storage with Prometheus
- Highly customizable dashboards and visualization with Grafana
- Strong Kubernetes and container-native monitoring support
- Large open-source ecosystem with extensive community-built integrations
- AlertManager for flexible, rule-based alerting workflows
What Prometheus and Grafana Do Well
The Prometheus and Grafana stack gives engineering teams complete control over their monitoring setup. For teams that want flexibility and are comfortable managing their own infrastructure, this combination offers depth and customizability that few commercial tools can match, especially for Kubernetes-native environments.
Best For
Engineering teams that prefer open-source tooling need deep Kubernetes and container monitoring and have the technical capacity to manage and maintain their own monitoring infrastructure.
3. New Relic
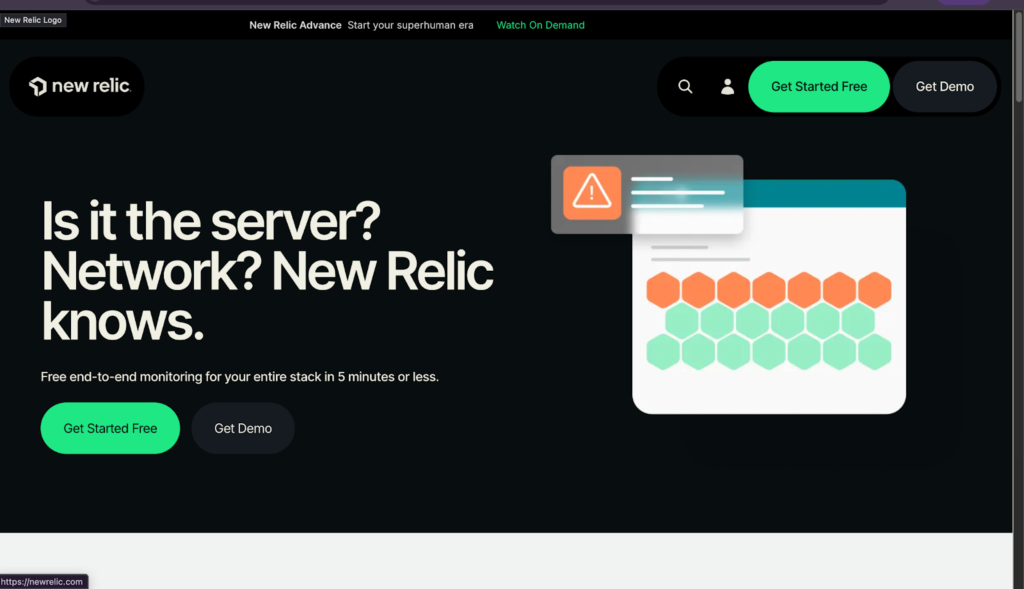
New Relic is a full-stack observability platform that combines application performance monitoring, infrastructure monitoring, log management, and distributed tracing under a single unified data platform. Its strength lies in making complex telemetry data accessible and actionable, particularly for teams that need fast onboarding and clear, readable dashboards without heavy configuration overhead.
Key Features
- Unified telemetry data platform combining metrics, events, logs, and traces
- APM with code-level performance visibility and transaction tracing
- Infrastructure monitoring across cloud, on-premise, and hybrid environments
- AI-assisted anomaly detection and intelligent alert correlation
- Developer-friendly onboarding with broad language and framework support
What New Relic Does Well
New Relic strikes a strong balance between depth and usability. Teams get comprehensive observability coverage without the configuration overhead that more flexible tools like Prometheus require. The unified data platform makes it easier to correlate signals across different layers of the stack during incident investigations.
Best For
Engineering teams that need full-stack observability with fast onboarding, clear dashboards, and strong APM capabilities without heavy infrastructure management overhead.
4. Dynatrace
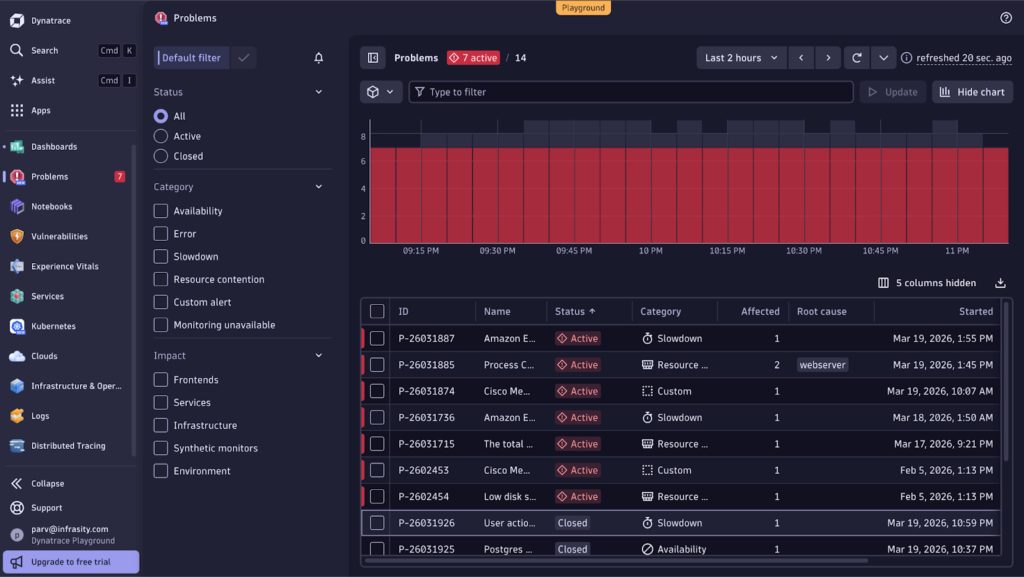
Dynatrace is an AI-powered observability platform built for large-scale enterprise environments. It uses its proprietary AI engine, Davis, to automatically detect anomalies, identify root causes, and reduce alert noise across complex distributed systems. Where most monitoring tools require engineers to manually correlate signals during an incident, Dynatrace aims to do that correlation automatically.
Key Features
- AI-powered root cause analysis with the Davis AI engine
- Automatic discovery and mapping of distributed system dependencies
- Full-stack observability across applications, infrastructure, and cloud environments
- Real user monitoring and digital experience management
- Strong support for hybrid and multi-cloud enterprise environments
What Dynatrace Does Well
Dynatrace stands out for its automated intelligence layer. For large enterprise teams managing hundreds of services across complex environments, the ability to automatically discover dependencies, correlate anomalies, and surface probable root causes significantly reduces the manual triage burden on engineering and SRE teams.
Best For
Large enterprise engineering and SRE teams managing complex, multi-cloud, distributed systems that require automated anomaly detection and AI-assisted root-cause correlation at scale.
5. ELK Stack (Elasticsearch, Logstash, Kibana)
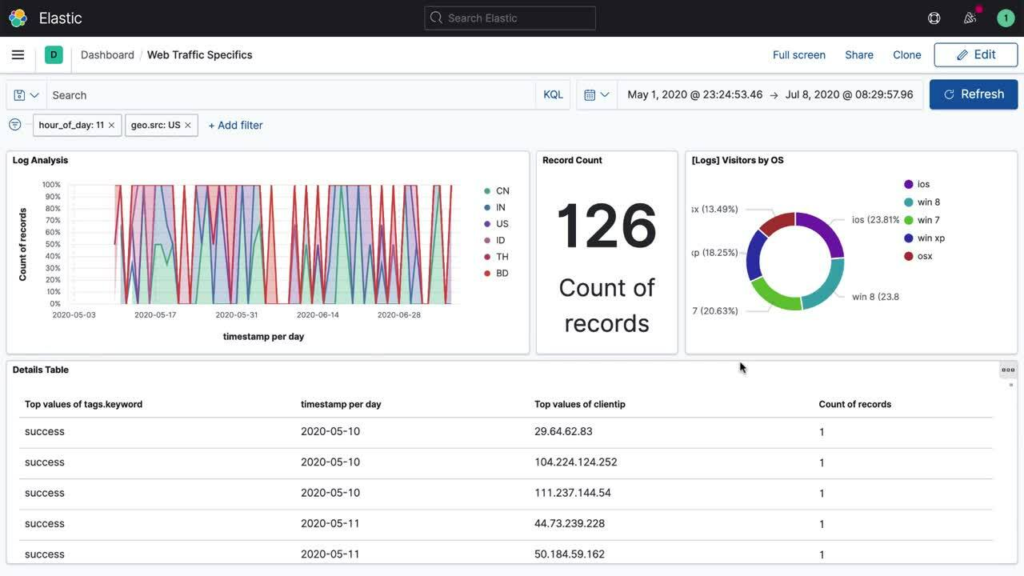
The ELK Stack is the most widely used open-source log aggregation and search platform in production engineering environments. Elasticsearch handles data indexing and search, Logstash manages data ingestion and transformation, and Kibana provides the visualization and dashboard layer. Together, they give engineering teams a powerful, flexible foundation for centralized log management across distributed systems.
Key Features
- Centralized log aggregation and indexing across distributed services
- Powerful full-text search and filtering across large volumes of log data
- Flexible data ingestion pipeline with Logstash for parsing and transformation
- Customizable dashboards and visualizations with Kibana
- Beats lightweight data shippers for collecting logs from multiple sources
What the ELK Stack Does Well
The ELK Stack gives engineering teams deep visibility into log data at scale. For organizations that generate large volumes of log output across many services, the ability to centralize, search, and visualize that data in one place makes incident investigation significantly faster than sifting through distributed log files across individual services.
Best For
Engineering teams that need centralized, searchable log management at scale, particularly organizations generating high log volumes across many distributed services, who want an open-source, flexible solution.
How These Tools Compare
Every engineering team’s monitoring stack looks different. Some teams need full-stack commercial coverage out of the box. Others prefer open-source flexibility that they can shape to their exact environment. The table below maps the five tools across the criteria that matter most when making that decision.
| Capability | Datadog | Prometheus and Grafana | New Relic | Dynatrace | ELK Stack |
| Coverage | Full-stack | Metrics focused | Full-stack | Full-stack | Log focused |
| Alerting Intelligence | AI-powered | Rule-based | AI-assisted | AI-automated | Rule-based |
| Open Source | No | Yes | No | No | Yes |
| Kubernetes Support | Strong | Native | Strong | Strong | Moderate |
| Ease of Setup | Fast | Complex | Fast | Moderate | Complex |
| Best For | Enterprise teams | DevOps teams | Mid to large teams | Large enterprise | Log-heavy teams |
Each of these tools does its job well within the boundaries of what monitoring is designed to do. They capture what is happening across your production environment, surface anomalies, and alert the right people when something goes wrong. But knowing something is wrong is only half the problem.
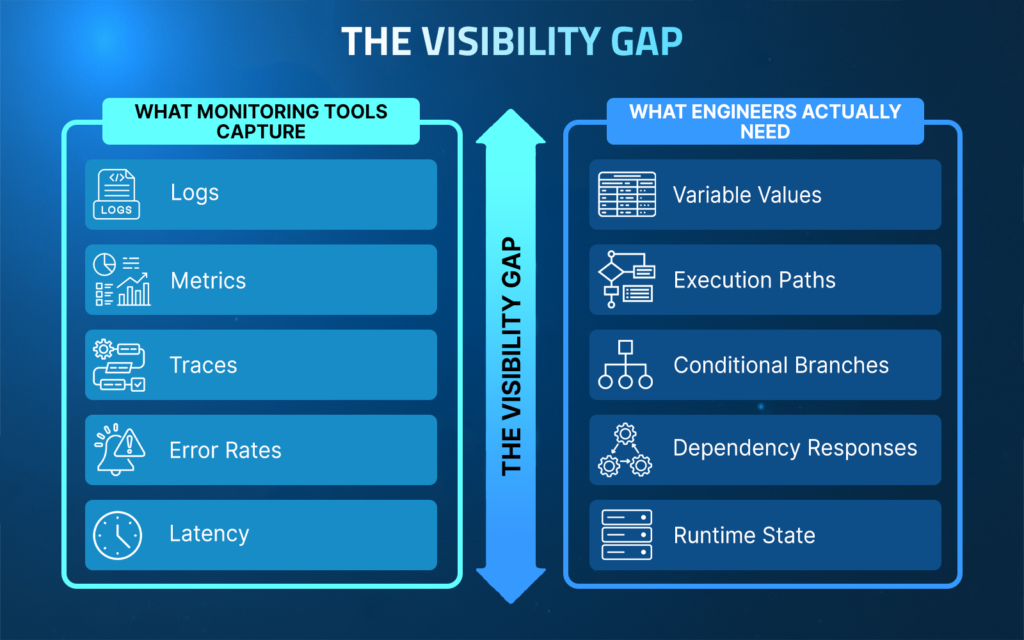
Why Traditional Monitoring Tools Are Not Enough
Every tool in this list shares the same fundamental limitation. The data they collect is preconfigured before an incident occurs. They capture what engineers anticipated might be useful, using expensive just-in-case logging. They are not dynamic and cannot respond in real time to capture new data when something goes wrong.
When a checkout service starts failing at a retail enterprise during peak traffic, Datadog tells you error rates are climbing. Distributed traces show the request failing after hitting the pricing service. Logs confirm errors are being generated. But none of it tells you which variable produced the bad value, which conditional branch executed under that specific traffic pattern, or how the downstream payment gateway responded at the exact moment of failure.
That gap, between what monitoring tools capture and what engineers actually need to know, is where most enterprise debugging time gets lost.
When the exact runtime signal is missing, engineering teams fall into the redeploy loop:
- Identify a likely failure point from existing telemetry
- Add new logging or instrumentation to the codebase
- Redeploy the service to production
- Wait for the failure to reproduce under real traffic
- Analyze the new logs, and often repeat the entire cycle
For enterprises running regulated workloads, whether a trading platform, a healthcare system, or a payment processor, each redeployment entails change-management overhead, compliance reviews, and operational risk. Each cycle adds hours to MTTR. And each hour of uncertainty compounds business and compliance exposure.
The limitation is architectural. Monitoring tools observe systems from the outside. They cannot see inside the running service at the execution level. And that is precisely the visibility that modern distributed systems, running AI-accelerated development cycles, increasingly require.
Why Your Monitoring Stack Needs a Runtime Layer
Lightrun is not a continuous monitoring tool. It is the layer that sits beyond monitoring, addressing the visibility gap left by every monitoring tool on this list.
Lightrun is an AI-native engineering reliability platform that enables engineering teams and AI agents to prevent and remediate software issues autonomously across the entire SDLC, from the moment code is written to the moment it runs in production. Rather than relying on preconfigured telemetry, Lightrun generates missing runtime evidence on demand, grounding every AI-driven decision in live execution behavior rather than inference.
The difference is architectural. Monitoring tools sit outside your application and observe what it reports. Lightrun operates inside the running service, capturing execution paths, variable values, and dependency responses directly from live code, under real traffic, without redeployments or rollbacks.
How Lightrun Complements Your Monitoring Stack
Lightrun complements each of the tools on this list. Datadog tells you error rates are climbing. Distributed traces show you which service is involved. Lightrun tells you exactly what happened inside that service at the execution level.
Beyond visibility, Lightrun introduces a critical capability that traditional monitoring tools lack: safe, runtime-grounded validation. Through its sandboxed environment, engineering teams can not only observe live execution behavior but also test and validate fixes against real runtime conditions before deploying them to users. This means that once a root cause is identified, teams can verify whether a fix actually resolves the issue using the same production context that caused it, without risking regressions or requiring redeployments.
This closes the loop that monitoring tools leave open. Instead of moving from detection to guesswork to redeployments, teams move from detection to evidence to validated resolution in a continuous, controlled workflow.
| Capability | Traditional Monitoring Tools | Lightrun |
| Data sources | Logs, metrics, traces | Telemetry + live runtime context |
| Visibility | Service-level | Execution-level |
| Debugging approach | Pattern inference | Direct runtime inspection |
| Instrumentation | Requires redeployment | Dynamic, zero redeploy |
| Incident response | Reactive | Evidence-driven, continuous |
Two Pathways for Continuous Reliability
Most reliability tools are built for one moment: the incident. They activate when something breaks, help teams triage faster, and go quiet until the next alert fires. Lightrun operates differently because production reliability begins before an incident hits. It begins the moment engineers write the code that will eventually run there.
Lightrun delivers runtime context across two distinct pathways, one focused on preventing failures before they reach production, and one focused on resolving them fast when they do.
MCP: Runtime Context for Build Time
When engineers and AI coding assistants work on new features or modify existing services, they reason about static code without visibility into how that code will behave in real production conditions.
Lightrun’s MCP interface changes this by feeding live runtime context directly into AI coding assistants and development workflows, allowing engineers to validate assumptions against real execution behavior before a single line of code ships to production.
In practice, this means an engineer modifying pricing logic at a retail enterprise can observe how similar execution paths behave under live traffic patterns before merging the change.
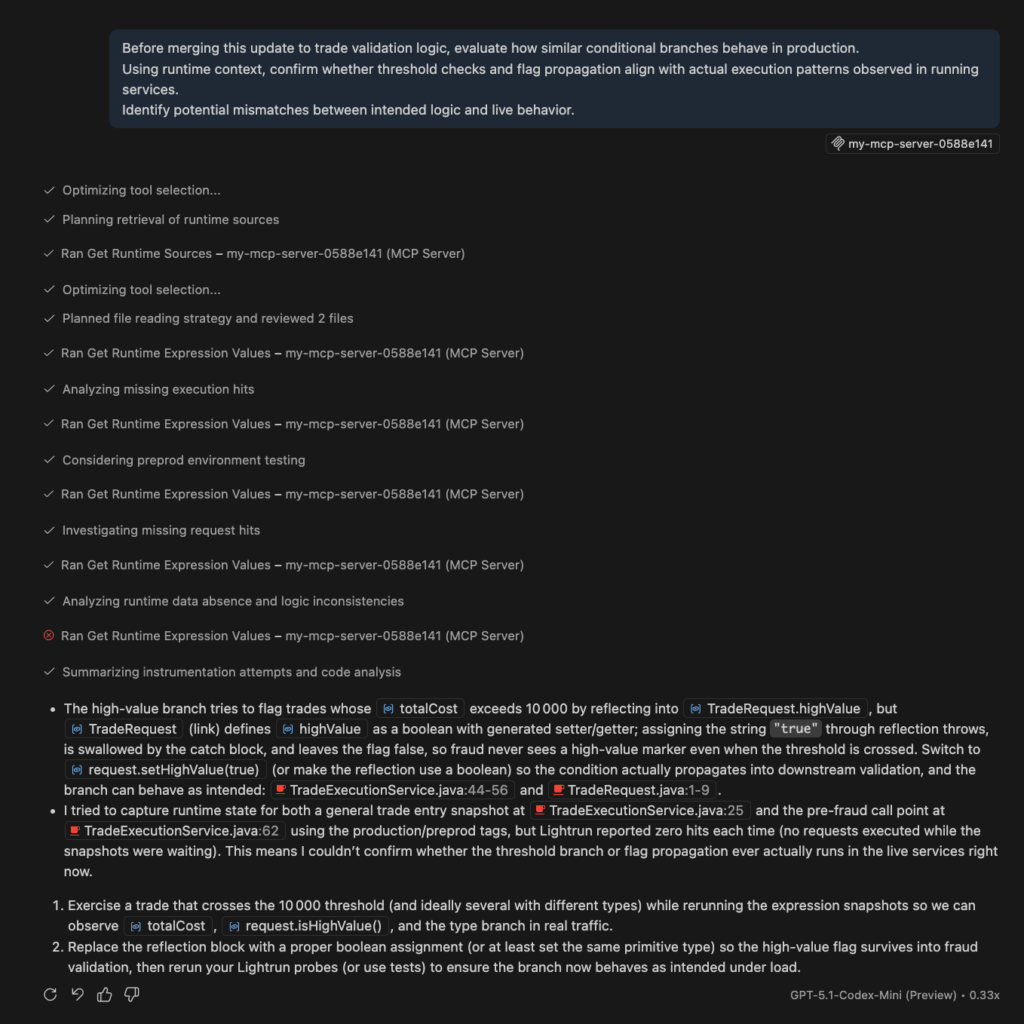
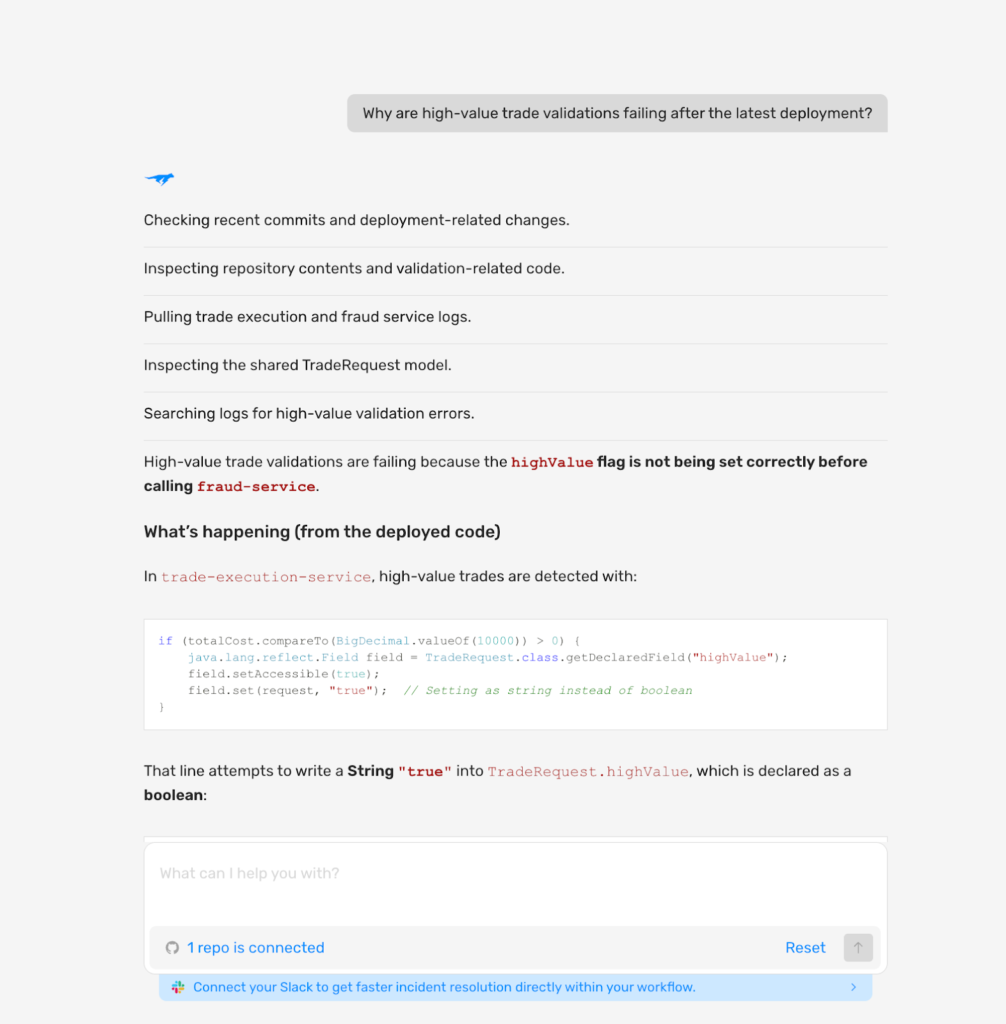
An AI coding assistant working on trade validation logic at a financial platform can reason about real variable states and dependency responses rather than inferring behavior from static analysis alone. Incorrect assumptions get caught at build time, not at 2 AM during a production incident.
AI SRE: Runtime-Grounded Reliability During Incidents
When something breaks in production, Lightrun’s AI SRE generates missing runtime evidence on demand, directly inside the running service, under the exact traffic conditions that produced the failure.
Unlike traditional AI SRE tools that are bound by the telemetry preconfigured before the incident, Lightrun AI SRE does not wait for the right logs to exist. It generates the evidence it needs, precisely when it needs it.
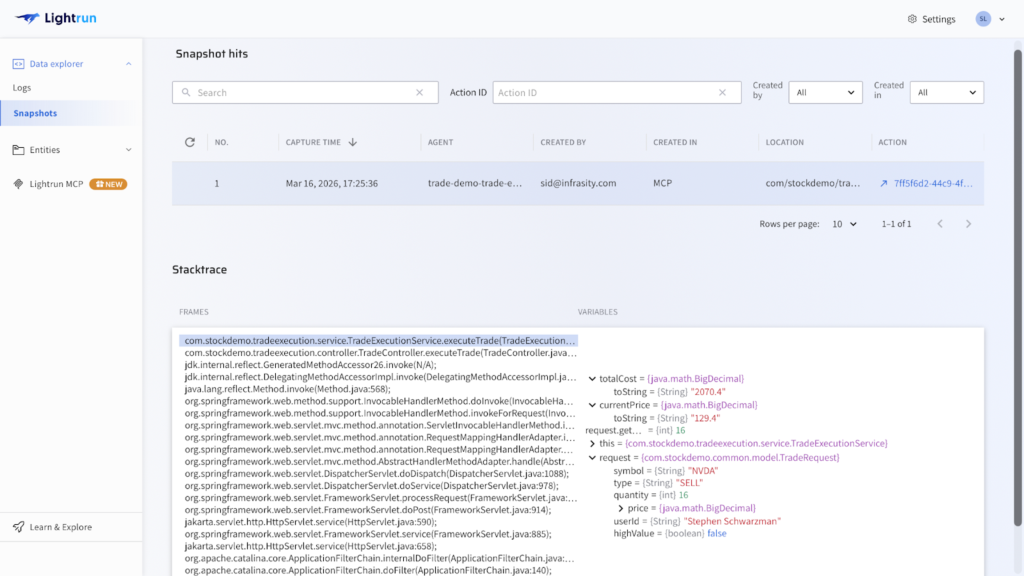
For an on-call SRE managing a live payment processing failure at a financial enterprise, this means:
- Moving from alert to confirmed root cause in minutes rather than hours
- Every finding is grounded in real execution behavior, not inferred from incomplete signals
- Every fix is validated in Lightrun’s sandbox before it touches users
- Every investigative action is fully auditable for compliance review
Getting Ahead of Incidents Before They Happen
Most monitoring tools are reactive by design. They alert after something breaks. But some of the most expensive production failures are not sudden crashes. They are slow, unusual patterns that build up in live systems and go unnoticed until it is too late.
This is where Lightrun AI SRE’s Deep Code Research capability changes the equation. Rather than waiting for an incident to occur in order to investigate unexpected symptoms , engineers can proactively review live system behavior, inspect how the code executes at the line-level under real traffic, and surface unusual patterns before they escalate into incidents.
Think of it as a continuous code-level review of your production systems. An SRE team at a payments provider at a large enterprise can query how a specific transaction validation workflow is behaving across thousands of live requests, spot an edge case that is silently producing incorrect results, and address it before a single customer is impacted. No alert needed. No incident occurred. No postmortem written.
This proactive visibility layer sits between peacetime development and wartime incident response, enabling engineering teams to stay ahead of failures rather than simply respond to them faster.
Trusted by global enterprises, Lightrun cuts MTTR from hours to minutes by eliminating the redeploy loop entirely. For enterprises operating under compliance frameworks like PCI-DSS or SOC 2, auditability is not a nice-to-have. It is a requirement.
Conclusion: The Right Monitoring Stack Goes Beyond Monitoring
Datadog, Prometheus, Grafana, New Relic, Dynatrace, and the ELK Stack are all strong tools that serve real engineering needs across different team sizes, stack configurations, and visibility requirements. Choosing the right one depends on your environment, your team’s technical capacity, and the specific gaps you need to close.
But regardless of which monitoring tool you choose, the visibility gap remains. Monitoring tools tell you something is wrong and roughly where to look. They do not tell you why the code behaved the way it did at the execution level, and in modern distributed systems running AI-accelerated development cycles, that distinction is where the most expensive failures live.
Runtime context is the missing layer. And for engineering teams that are serious about moving from reactive incident response to continuous, evidence-driven reliability, that layer is no longer optional.
Frequently asked questions about continuous monitoring tools
Platforms that continuously track system health, performance, and behavior across production environments by collecting logs, metrics, and distributed traces. They give engineering teams real-time visibility into anomalies, service failures, and latency issues across distributed systems.
Monitoring data is preconfigured before incidents occur. When failures depend on specific variable values, conditional logic, or dependency responses under real production traffic, traditional telemetry does not have the execution-level detail required to explain them.
Lightrun is an AI-native engineering reliability platform that generates missing runtime evidence on demand, directly inside running services, without redeployments. Where monitoring tools observe systems from the outside, Lightrun operates inside the running service at the execution level, filling the visibility gap that every monitoring tool leaves behind.