Why Alert Fatigue Solutions Still Miss the Root Cause
May 11, 2026 / Updated: May 14, 2026


Alert fatigue solutions have never been better, but on-call engineers are still burning out. Threshold tuning, AI triage, and alert correlation reduce the noise, but every alert that clears filtering lands with the same incomplete telemetry and triggers the same manual investigation cycle. This post explains why the evidence gap survives every fix, and how runtime context changes that.
Key Takeaways
- The real problem: Alert fatigue is an evidence gap. Alerts that pass filtering still arrive without an execution context.
- Where every fix stops: Alert management systems rely on incomplete, pre-captured telemetry. They reduce noise but cannot confirm why an alert fired.
- The bottleneck: According to Lightrun’s State of AI-Powered Engineering 2026 Report, 60% of engineering leaders identify a lack of understanding of system behavior under live production conditions as the primary bottleneck in incident resolution
- The cost: The same report found that 38% of weekly engineering capacity is consumed by debugging, verification, and environment-specific troubleshooting. This is the equivalent of two full working days every week
- The fix: The runtime sensor generates missing execution evidence at the exact point of failure. It provides the necessary context to resolve issues without redeployments and without touching the live service
This post examines why threshold tuning, AIOps correlation, and AI-driven triage all fail at the investigation layer rather than the volume layer — and shows how Runtime Context shifts the debugging workflow from hypothesis-driven reconstruction to evidence-driven confirmation.
Consider what this looks like in practice. At 14:13, a schema update ships to a financial trading platform. At 14:14, high-value trades start bypassing fraud validation silently, no exception, no alert, no stack trace. The error is swallowed at the field-set level. For the next four minutes, the service appears completely healthy based on all available telemetry signals. A trader named Richard Mason submits a trade of $12,746.92, which exceeds the $10,000 threshold, but it is processed without being flagged.
Threshold tuning, alert correlation, and AI triage are all in place, and none of them fire. This is the incident that runs through every section of this blog, and it is the clearest example of why alert fatigue is an evidence, not a volume problem.
What Is Alert Fatigue?
Alert fatigue in SRE teams is the state of exhaustion and desensitization that occurs when engineers are overwhelmed by a high volume of frequent, redundant, or low-signal notifications. It leads to missed critical incidents and slower response times, and burnout that compounds across shifts.
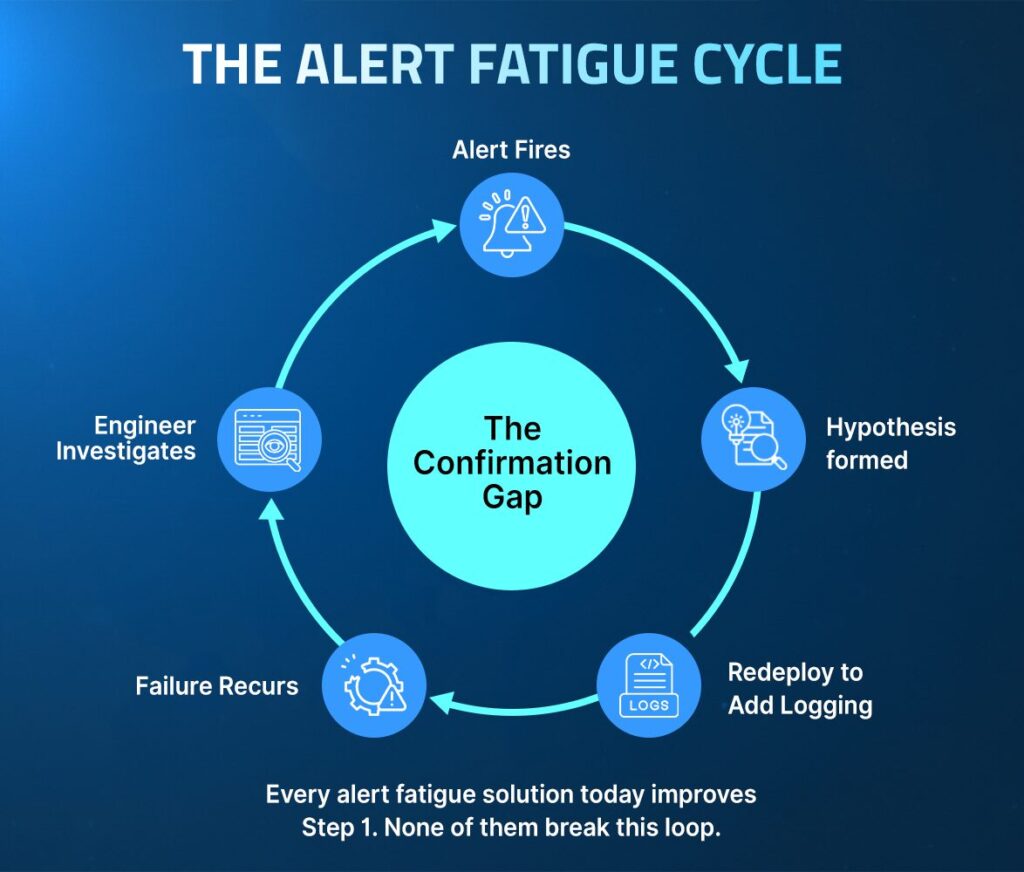
The standard definition points at the symptom, not the cause. Threshold tuning and deduplication reduce the page count, but the moment an alert clears filtering and lands, the investigation cycle is identical to before: scan logs, form a hypothesis, hit the same wall where the required signal was never instrumented.
The real problem is not volume, but rather the evidence each alert carries when it arrives.
Alert fatigue accumulates when that pattern repeats over weeks and months:
- How it starts: As systems grow more distributed, a single deployment can trigger alerts across five dependent services simultaneously. Each one appears to be a potential root cause and requires investigation to rule out.
The volume of incoming pages outpaces the capacity to close them.
- Why noise reduction alone does not fix it: Threshold tuning and alert deduplication reduce the number of pages but not the effort behind each one.
The alert that clears filtering still lands with the same incomplete telemetry, and the investigation still stalls at the same point: the signal that would explain the failure was never captured.
- The human cost: According to Lightrun’s State of AI-Powered Engineering 2026 Report, 54% of high-severity incidents are still resolved using tribal knowledge rather than documented diagnostic evidence.
The same engineers get pulled into every critical incident, carry context in their heads rather than in a system, and burn out not from the volume of alerts but from the weight of investigations that cannot be closed.
- What makes it structural: An alert that fires without the execution context needed to explain the failure demands a full manual investigation regardless of how well it was routed, correlated, or ranked.
Ask any on-call engineer what a bad week looks like, and the answer is rarely “too many alerts.” It is:
- Alerts that fire without enough context to act on, leaving the engineer guessing at a starting point.
- Investigations that stall after 20 minutes of log-scanning, with no evidence to confirm or eliminate the leading hypothesis.
- Hypotheses that require redeployment to tests, meaning the investigation depends on a future failure to explain the current one.
- Shift handoffs where the next engineer inherits an open question rather than a closed answer.
Alert fatigue accumulates not from the number of alerts that arrive, but from the weight of investigations that cannot be closed.
The Four Alert Fatigue Solutions Every Team has Already Tried
The four most common alert fatigue solutions are threshold tuning, alert correlation, AI triage, and on-call coordination. Each improves the signal layer without touching the evidence layer beneath it. Most SRE teams have invested in some combination of all four. However, each has the same structural limitation.
- Threshold tuning and filtering stops pages that don’t need human attention. A latency spike fires only when the error rate is elevated, cutting alerts that self-resolve before anyone looks at them.
But filtering only works with signals that already exist; it cannot tell the engineer what caused the spike, only that the spike met the threshold.
- Alert correlation and deduplication collapses a bad deployment that spans five pages across five teams into a single incident view. Useful, but correlation is a timing observation, not a proof.
Knowing that fraud validation degraded 47 seconds after a schema deployment narrows the search. But it cannot tell the engineer which field broke or what value it carries at runtime.
- AI-driven triage automatically routes each incident to the team best placed to resolve it, based on historical patterns.
The problem is the data that the AI operates on: when the signal that would explain the failure was never instrumented, AI triage surfaces a ranked hypothesis rather than a confirmed answer.
- On-call and incident coordination handles sequencing and channel selection. Coordination is the last step before the investigation begins. None of what came before changes what the engineer finds when they open their first dashboard. While the alert is better routed, the evidence behind it is exactly the same
All four layers have improved meaningfully over the past decade. The constraint they share is architectural: better routing cannot fix a missing evidence layer.
Alert fatigue is in many ways not an alert volume problem, but it is an evidence one. That distinction is what every solution on the market either addresses or misses entirely, and it is the reason teams that have invested in every available tool are still burning out.
Why Alert Noise Reduction and AI Triage Do Not Resolve the Context Gap
Alert noise reduction makes the on-call experience significantly less chaotic, but the engineer still has to understand why the service degraded. They frequently must do this without execution context for why the service failed. That answer requires visibility into what the code was doing at the moment of failure, which no amount of threshold tuning or deduplication can provide.
A well-filtered alert and a noisy one tell the engineer exactly the same thing: something is wrong.
The investigation burden per alert is unchanged. Alert noise reduction reduces the count of investigations; it does not reduce the effort behind each one. Teams that have invested heavily in filtering report the same stall point: the signal that would explain the failure was never captured, so the investigation reconstructs system behavior from incomplete telemetry rather than reading it from evidence.
Why AI Triage Accelerates Routing, Not Resolution
AI triage can surface the most likely root cause faster than any human could manually sort through the same signals, and it routes the incident to the right team without requiring an on-call manager to get involved.
But the effectiveness of AI tools is directly connected to the quality of the data they reason over.
When the signal that would explain the failure was never captured, the AI has nothing to reason from and surfaces its best guess rather than a confirmed answer. This is particularly dangerous when scoping the severity. AI triage relies on external symptoms, error rates, or latency spikes to determine priority.
But symptoms can be misleading. A system can appear healthy with low error rates while a silent failure bypasses a critical security check, or appear critical due to a harmless spike in a background process.
AI triage gets engineers to the right incident faster. It does not get them past the point where the evidence runs out. Moving from a “likely” severity to a “confirmed” impact still requires the live execution data that pre-captured telemetry cannot provide.
5 Alert Fatigue Challenges SRE Teams Still Face in Production
Alert fatigue in SRE teams persists because each of the five challenges below occurs at the investigation layer, after every filtering, routing, and triage tool has already completed its work.
At 14:13, a schema update deploys to production on a financial trading platform, changing how the highValue flag is set in TradeExecutionService.java. The update uses field.set(request, “true”) to write a String into a field defined as private boolean highValue. The change passes all tests in staging.
At 14:14, the first regression appears in production logs: Can not set boolean field com.stockdemo.common.model.TradeRequest.highValue to java.lang.String.
The error is swallowed at the field-set level. High-value trades above $10,000 are no longer correctly identified prior to fraud validation. Three dependent services are degraded, and no exception reaches the on-call engineer.
1. Lack of Execution Context at the Time of Failure
The alert fires with everything except the evidence needed to act on it. The engineer sees the service name, the affected region, and the correlated deployment from 14:13.
What they cannot see is why the highValue flag is broken, because the error is swallowed at the field-set level, and no exception surfaces in the fraud validation handler.
| Signal | Status |
| Service name and affected region | Visible |
| Correlated schema deployment from 14:13 | Visible |
| High-value trade validation failures in US-EAST-1 | Visible |
| highValue field value, its runtime type, and why the boolean assignment failed | Not captured |
The engineer checks distributed traces that show requests completing, scans application logs that show the highValue error only in deployment startup output rather than per-request, and confirms trades are being mishandled without being able to see what the field actually contains at the moment each trade is evaluated.
2. Correlation Without Causation
By 14:25, the on-call tool groups five related alerts into one incident and surfaces the 14:13 schema deployment as the most likely correlated event. That narrows the investigation significantly but immediately reveals its own limitation: knowing that fraud validation broke 47 seconds after a deployment is a timing observation, not a root cause.
No correlation tool can tell the engineer which field the deployment broke, what value it is carrying at runtime, or why the per-request logs show nothing when the startup logs show the error.
- Schema deployment at 14:13 correlated with failure: confirmed
- Hypothesis formed (highValue String vs boolean mismatch): plausible
- Hypothesis confirmed: not possible with available telemetry
3. AI Systems Limited by Missing Data
AI triage ranks the incident and surfaces the 14:13 schema deployment as the most likely root cause based on temporal correlation. Alert ranking has improved significantly with modern AI SRE tools. The prioritized alert still arrives without execution evidence at the field-set line.
The startup-level error in the logs does not reveal the per-request state needed to confirm the hypothesis. The log entry shows that something failed. It does not show what value was present, which request triggered it, or whether the condition is reproducible under current traffic.
This is an architectural constraint, not a reflection on the quality of the AI model in use. Industry data shows that 44% of AI SRE investigations fail to reach a confirmed root cause because the required evidence was never captured. The AI can only reason from what exists. When the execution-level signal was never recorded, no model can generate it from nonexistent data.
4. High Cognitive Load on On-Call Engineers
Even after correlation and AI ranking focus the investigation on the right service and deployment window, the engineer and AI agent still reconstruct system behavior from incomplete telemetry. They form hypotheses and rule them out when signals do not confirm them, starting over when a hypothesis collapses.
This cycle compounds because the evidence required to break it was never captured at runtime. 54% of high-severity incidents are still resolved using tribal knowledge rather than automated diagnostic evidence. This means the most critical investigations depend on institutional memory rather than on the tools purchased to eliminate that dependency.
5. Lack of Reliable Fix Validation
Once the hypothesis is formed, that highValue is being written as String “true” instead of boolean true, causing the fraud threshold check to misidentify high-value trades.
The engineer has no way to confirm it at the per-request level without:
- Adding logging to the field-set call,
- Opening a pull request,
- Getting it reviewed and merged,
- Deploying it
- Waiting for another trade like Richard Mason’s $12,746.92 order to reproduce the failure.
This is the confirmation gap: detection done, correlation done, hypothesis formed, but the execution evidence needed to close the investigation is missing.
Why Alert Fatigue Solutions Stop Where the Investigation Starts
All current alert management and observability categories share one dependency: telemetry collected in advance, based on what the team expected to need when the instrumentation was written.
When the required signal was never instrumented, it cannot be retrieved after the fact.
- Engineers must modify the code to add the missing signals
- A pull request, review, and deployment cycle follows
- The failure must recur under the same production conditions
- The investigation depends on a future failure to explain a past one
This is not a gap that better AI or smarter routing can close, it is the fundamental limitation of pre-captured of telemetry.
Understanding how to reduce alert fatigue requires separating the volume problem, which existing tools solve well, from the evidence problem, which none of them address.
A review of the leading continuous monitoring tools, site reliability engineering challenges, and AI observability approaches reveals this same constraint across the entire category. Closing it requires moving beyond pre-captured telemetry to runtime context.
How to Reduce Alert Fatigue in SRE Teams: The Missing Layer
To genuinely reduce alert fatigue for SRE teams, the fix must operate at the evidence layer, not just the routing layer. Every alert that clears filtering must arrive confirmable, with the execution context needed to close the investigation already present.
Runtime context is the structural fix. Using this data changes what each alert that clears filtering carries when it arrives. Instead of triggering a manual reconstruction cycle, the alert arrives with the execution evidence, making investigation a process of confirmation from the first moment.
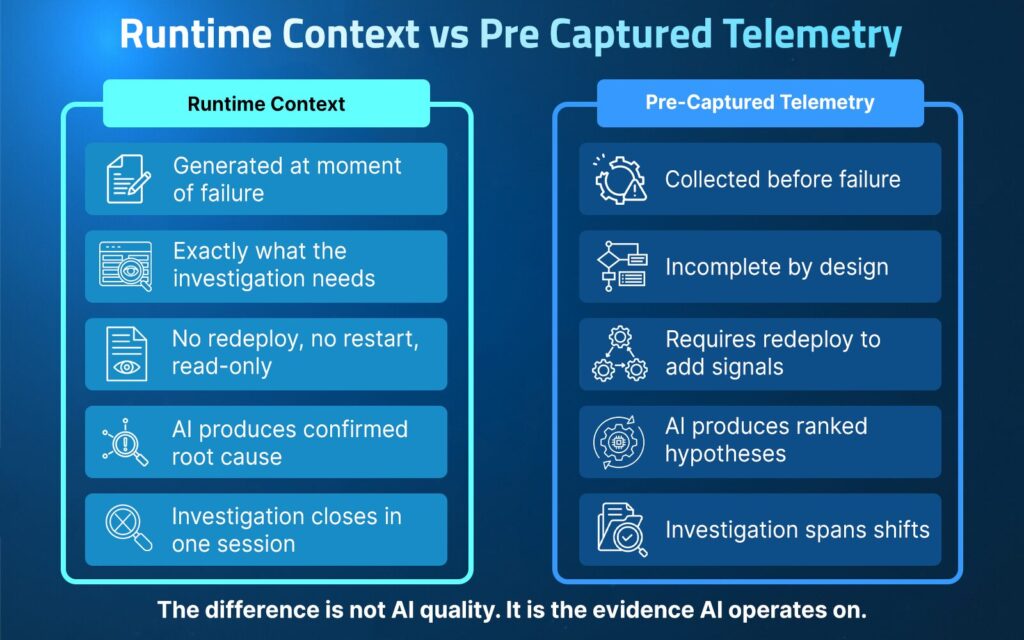
The table below shows the distinction between reasoning over pre-captured telemetry and generating runtime context on demand:
| Dimension | Runtime Context | Pre-Captured Telemetry |
| When evidence is collected | Generated at the moment of failure | Collected before the failure |
| Coverage | Exactly what the investigation needs | Incomplete by design |
| Code change required? | No redeploy, no restart, read-only | Requires redeploy to add signals |
| AI output | Confirmed root cause | Ranked hypotheses |
| Investigation scope | Closes in one session | Spans multiple shifts |
The difference is not AI quality. It is the evidence AI operates on.
Lightrun delivers runtime context by generating missing execution evidence inside live services at the moment of failure. It integrates with the alert routing, correlation, and on-call tools already in place, adding the evidence layer beneath them rather than replacing them.
Where other platforms route and rank alerts, Lightrun makes those alerts confirmable.
Runtime Context as the Source of Truth
AI is not the source of truth. The actual behavior of code executing under real traffic is the only layer that can answer what ran, at this exact line, for this specific request, at the moment of failure.
Every alert fatigue solution that stops short of that layer inherits the same investigation gap regardless of how well it routes the alert.
When the engineer’s hypothesis about highValue being set to a String cannot be confirmed at the per-request level by any available signal, the question is not which AI model would reason more accurately. It is which tool can generate the missing per-request evidence directly within the live service.
That distinction defines the difference between a tool that routes investigations and a tool that closes them.
Generating Missing Evidence on Demand Without a Redeploy
Rather than waiting for a new deployment to add per-request logging, Lightrun’s Runtime Sensor generates the missing evidence directly within the running service.
For the TradeExecutionService.java scenario, the engineer can inspect what highValue actually contains at the field-set line for each individual trade request while the incident is still active, without touching the live service or triggering a restart, because all instrumentation runs through the Lightrun Sandbox in a read-only environment.
- highValue: “true” (type: String, expected: boolean) captured at the field-set line, confirming the type mismatch per request
- field.set(request, “true”) observed writing a String into private boolean highValue, the exact line the deployment broke
- Trade amount visible: Richard Mason’s order at $12,746.92 hits this error at 14:17:03, above the $10,000 threshold
- No code change, no restart, no redeploy required
The investigation that would have taken hours and multiple deployment cycles collapses to minutes because the evidence is generated at runtime rather than waiting to be instrumented into the next deployment.
Validating the Fix in the Same Session
The engineer formed the hypothesis that highValue was being set as a String at 14:17. With runtime evidence available at the fraud validation line, that hypothesis is confirmed in the same session, without opening a pull request, without waiting for a review, and without a deployment that depends on another high-value trade reproducing the failure.
The three-redeploy-cycle average that normally compounds on-call time across shifts drops to zero. The same mechanism is covered in depth inHow to Reduce MTTR with AI-Powered Runtime Diagnosis.
AI Grounded in Live Execution
Traditional AI SRE tools reason about what probably happened based on available telemetry. Lightrun AI SRE reasons about what actually happened by grounding its analysis in the runtime evidence generated at the failure line.
For the trading scenario, that means tracing the highValue String assignment back to the exact line in the schema deployment at 14:13, confirming US-EAST-1 is affected and EU-WEST-1 is not, and delivering a fix proposal to revert the field-set to field.set(request, true) with the boolean literal, or convert the String to a boolean before assignment, with rollback guidance in the same session.
Fix Validation and Full Auditability Inside the Lightrun Sandbox
Before a fix ships, it needs to be validated against the conditions that actually caused the failure, not reproduced in a staging environment that never fully matches production.
The Lightrun Sandbox captures the complete evidence trail from the investigation, including every runtime query, log, and snapshot, and validates proposed fixes against the exact traffic and state that triggered the incident.
For teams in financial services or healthcare where every incident action must be logged and auditable, every step Lightrun takes is inspectable and reversible, which is a requirement most AI-driven incident tools cannot meet.
How to Investigate an Alert With Lightrun: A Real Incident Walkthrough
The following walkthrough shows how an engineer uses Lightrun to investigate the TradeExecutionService.java incident from the moment the alert fires to a confirmed root cause: three steps, one session, no redeployment.
Step 1: Ask Lightrun AI SRE in Slack when the alert fires.
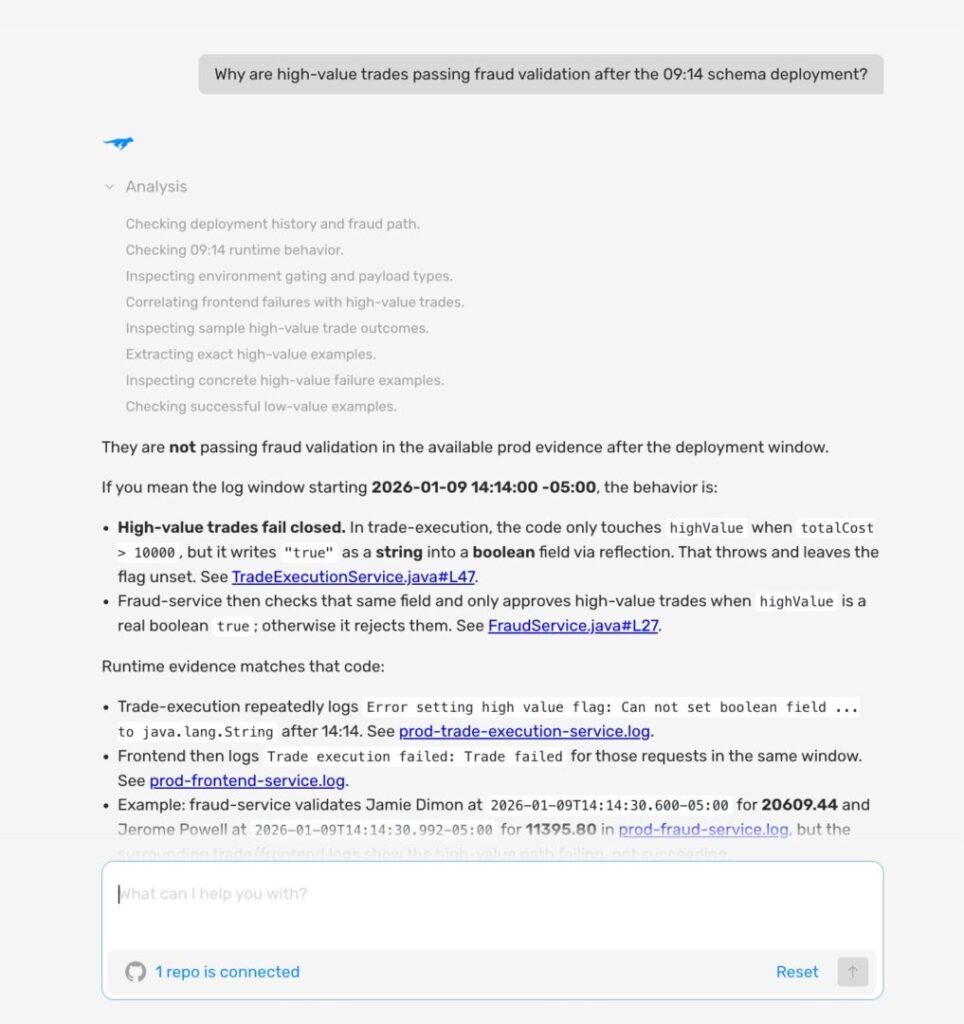
When the P1 alert lands, open Lightrun AI SRE in your incident channel and ask one natural language question about the failure:
“Why are high-value trades passing fraud validation after the 14:13 schema deployment?”
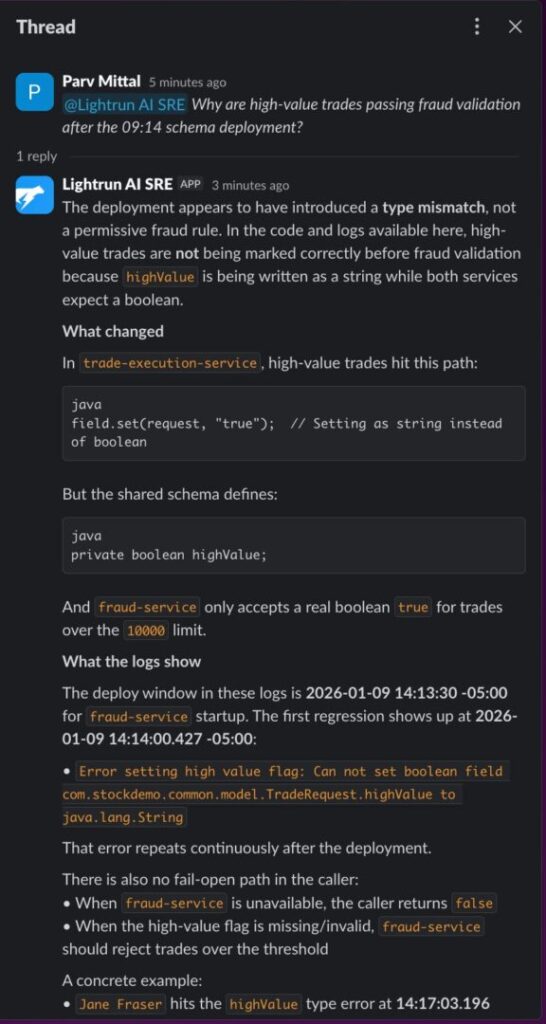
Lightrun AI SRE identifies the field.set(request, “true”) String-to-boolean mismatch as the most likely cause, cites Richard Mason’s $12,746.92 trade as a confirmed instance, and lists the exact next checks needed — all from a single question in Slack.
The response is a complete investigation in conversational form: what changed, what the logs show, a concrete trade example, the bottom line, and what evidence would close the loop.
Step 2: Capture per-request evidence at the failure line using the Lightrun Sandbox.
With the hypothesis grounded in the Slack investigation, the Lightrun Runtime Sensor captures the missing per-request evidence directly inside the live TradeExecutionService.java service, no code change, no restart, no redeploy.
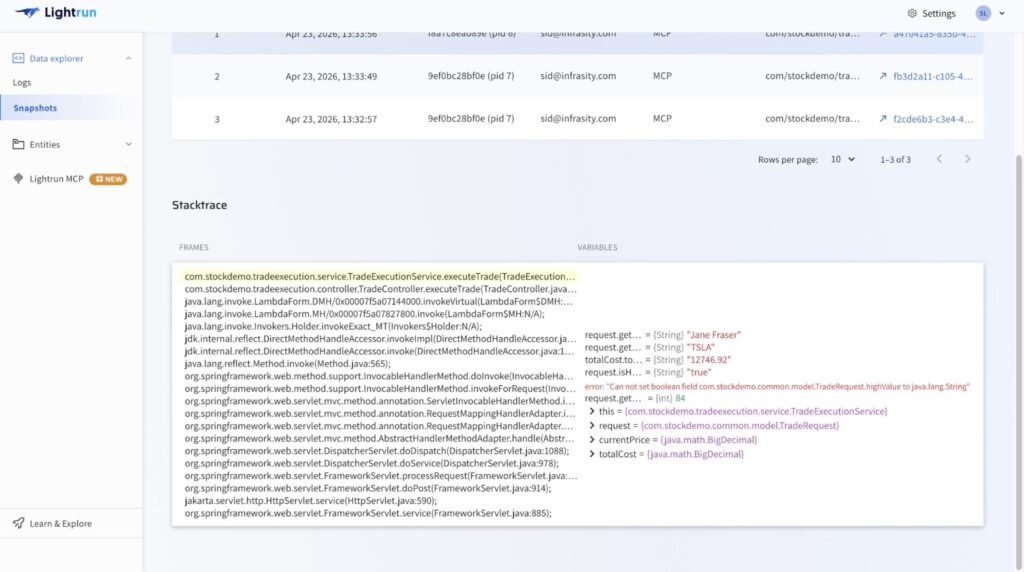
- highValue is captured as String “true” at the field-set line, where boolean true was expected, confirming the type mismatch per request
- field.set(request, “true”) observed writing the wrong type without adding a single line of logging code or triggering a redeployment
- Trade amount: Richard Mason’s order at $12,746.92 hits this error at 14:17:03, proving that every high-value trade above $10,000 is arriving at fraud validation with a broken flag that the threshold check cannot evaluate correctly
- No code change, no restart, no redeploy required.
The investigation that would have taken hours and multiple deployment cycles collapses to minutes because the evidence is generated at runtime at the next deployment.
Step 3: Open Lightrun AI SRE for the full RCA, fix proposal, and audit trail.
With the type mismatch confirmed in the Sandbox, open the Lightrun AI SRE to get a structured root-cause analysis, fix options, and a complete investigation record.
- The complete investigation from the first question to confirmed root cause to fix proposal is captured in a single chat thread at app.lightrun.com, with runtime evidence snapshots and commit attribution visible inline, giving the team a full record without any manual documentation
- The chat stays open, and the context is preserved, so any engineer can continue asking questions, request a postmortem, or get Lightrun AI SRE to explain any finding in more detail, and the audit trail panel logs every action for compliance review and shift handoff
The TradeExecutionService.java investigation went from an unanswered P1 alert at 14:17 to a confirmed root cause, a concrete fix proposal, and a complete audit trail. All this happened in one session, across three interfaces, without a single redeployment.
How Lightrun Closes the Confirmation Gap
| Alert Fatigue Challenge | How Lightrun Resolves It |
| Alerts fire without execution context | Lightrun AI SRE surfaces blast radius and top hypothesis before the engineer opens a dashboard |
| Correlation narrows scope but cannot prove cause | Runtime Sensor traces the exact field, line, and commit confirmed on a live trade instance |
| AI triage is limited by missing per-request data | Sandboxed instrumentation captures the exact runtime state at the field-set line, no redeploy required |
| Open hypotheses compound across shifts | Investigations close with confirmed evidence in the same session, findings captured in the audit trail |
| Fix validation requires a redeploy cycle | Sandbox validates fixes against the exact runtime conditions that produced the failure before shipping |
| Audit gaps in regulated environments | Every runtime query, evidence artifact, and AI action is fully inspectable, auditable, and reversible |
Lightrun does not replace alert routing, correlation, or on-call coordination. It adds the runtime context layer beneath them, so every alert that passes filtering is resolvable.
Here is what changed at each stage of the TradeExecutionService.java investigation compared to where the same incident stalled without Runtime Context.
1. From No Execution Context to Immediate Clarity
Without runtime context, the first 15 minutes are spent confirming that distributed traces and empty logs already failed to explain the failure.
Lightrun AI SRE surfaces the blast radius and the top hypothesis the moment the alert fires, so the engineer knows the failure point and the likely mechanism before opening a single dashboard.
2. From Correlation to Confirmed Cause
Correlation told the engineer that the 14:13 deployment was the most likely cause, but it couldn’t say which line broke, which variable carried the wrong type, or why US-EAST-1 was affected, and EU-WEST-1 was not.
Lightrun traces the highValue String assignment to the exact field-set call with commit-level attribution and confirms it on Richard Mason’s $12,746.92 trade as a live instance, so the investigation closes with a proven mechanism rather than a shortlist the next shift has to keep eliminating.
3. From AI Guesswork to Evidence-Backed Answers
AI triage surfaces the 14:13 deployment as the most likely cause, but the ranked alert still arrives without per-request evidence showing what highValue actually contains at the field-set line.
The Lightrun runtime sensor generates the missing signal directly inside the live service through the Lightrun Sandbox, capturing highValue: “true” (type: String, expected: boolean) at the exact point of failure, so the AI is no longer reasoning from the best available telemetry but from the exact runtime state that produced the failure.
4. From Open Hypotheses to Closed Investigations
Every alert that ends without confirmed evidence arrives at the next shift as an open hypothesis, a partial timeline, and the overhead of reconstructing context that the previous engineer carried in their head rather than in a system.
When the investigation closes with confirmed runtime evidence in the same session, the findings are recorded in the audit trail rather than in one engineer’s memory.
5. From Redeploy Cycles to Same-Session Validation
Confirming the highValue mismatch the traditional way meant adding per-request logging to the field-set call, opening a PR, getting it reviewed, deploying it, and waiting for another trade above $10,000 to reproduce the failure.
The Lightrun Runtime Sensor validates the hypothesis against the exact runtime state that produced the failure highValue: “true” (type: String, expected: boolean), confirmed on Richard Mason’s live trade without a single additional deployment.
The fix is validated before it ships.
Alert Fatigue Solutions Are Only as Strong as the Evidence They Carry
SRE teams today are not limited by a lack of tools, but by the evidence those tools can produce before an alert reaches an engineer.
Every alert fatigue solution in the category improves the signal layer and still leaves the investigation starting in the same place: a hypothesis that cannot be confirmed by the telemetry collected before the failure.
The quality of any AI-driven investigation is bound by the evidence available when it begins. Pre-captured telemetry is blind by design to the conditions that were never instrumented in advance. That makes the investigation gap an architectural constraint rather than a tooling preference.
This is why teams that have invested in every available alert-fatigue solution are still burning two full engineering days a week on investigations that cannot be closed.
Runtime context is the structural fix. Lightrun AI SRE delivers it by generating missing execution evidence inside live services at the moment of failure, grounding AI investigation in what actually ran rather than what was instrumented in advance, and closing the investigation in the same session rather than compounding it across shifts.
Ready to eliminate alert fatigue?
Frequently asked questions about alert fatigue solutions
The most effective alert fatigue solutions combine noise reduction at the signal layer with evidence generation at the execution layer. Reducing alert volume without closing the evidence gap leaves every surviving alert in the same investigation cycle. Runtime context paired with alert management is where the real reduction in on-call burden comes from.
Alert noise reduction reduces the number of investigations but does not reduce the effort behind each one. Once a filtered alert lands, the engineer still faces incomplete telemetry and the same manual reconstruction cycle. The signal that would explain the failure was never captured, and no amount of threshold tuning or deduplication can recover it afterward.
AI-driven triage operates on pre-captured telemetry. When the required signal was never instrumented, it produces a ranked list of possibilities rather than a confirmed answer. 44% of AI SRE investigations fail to identify a confirmed root cause because the required evidence was never captured, a constraint that applies regardless of the AI model’s capabilities.
The confirmation gap is the point at which detection and correlation are complete, and a hypothesis has been formed, but the execution evidence needed to confirm it was never captured. Every alert that ends there adds redeploy cycles and on-call time that the next shift inherits. It is the structural reason why alert fatigue persists even after teams invest in every available routing and triage tool.
Runtime context is live execution-level evidence captured from inside running services on demand, including variable values and execution paths at the exact line where the alert fired, without redeploying or waiting for the failure to recur. It changes the investigation from reconstruction to evidence-driven confirmation, closing the loop in the same session rather than compounding it across shifts.
Lightrun’s Runtime Sensor adds the runtime context to engineering systems. It integrates with Datadog, PagerDuty, Slack, Jira, and other management platforms to route, rank, and confirm the cause of incoming alerts by generating the missing runtime context directly inside live services.