Why Your Agentic Workflow Succeeds and Still Gets It Wrong
Jun 12, 2026 / Updated: Jun 12, 2026


Agentic workflows are reshaping how engineering teams operate, fetching context, synthesizing decisions, and shipping results across systems without human intervention. But the same design that makes them powerful adds risk in production. Agents do not crash when they hit bad data; they synthesize around it, substituting a stale value, an empty page, or a missing field for the result they were supposed to capture. The failure is semantic, not structural, and nothing in your trace stack was designed to catch it.
Key Takeaways
- Agentic workflows fail silently: wrong pagination offsets, stale cache values, and empty API responses produce green exit codes with broken output, and no trace or log captures the divergence
- 97% of engineering leaders report significant AI agent visibility issues in live execution state in production, and 44% of AI SRE investigations fail because execution-level data was never captured at the right moment.
- Lightrun MCP connects AI coding assistants directly to live runtime state at build time, so agents can validate assumptions against real execution before code ships
- The Lightrun Error Remediation Automation Skill is a fully agentic process: an error fires, the skill activates automatically, places snapshots, captures runtime evidence, diagnoses the root cause, and raises a PR with a fix without a developer involved until review.
This blog walks through a real agentic standup workflow, a real silent production failure, and how the Lightrun Error Remediation Automation Skill and Lightrun MCP close the gap: one captures the bug live from a running Java process without redeploying, the other gives your AI coding assistant the same runtime visibility at build time before the bug ships.
How Can a Workflow Succeed and Still Deliver the Wrong Result?
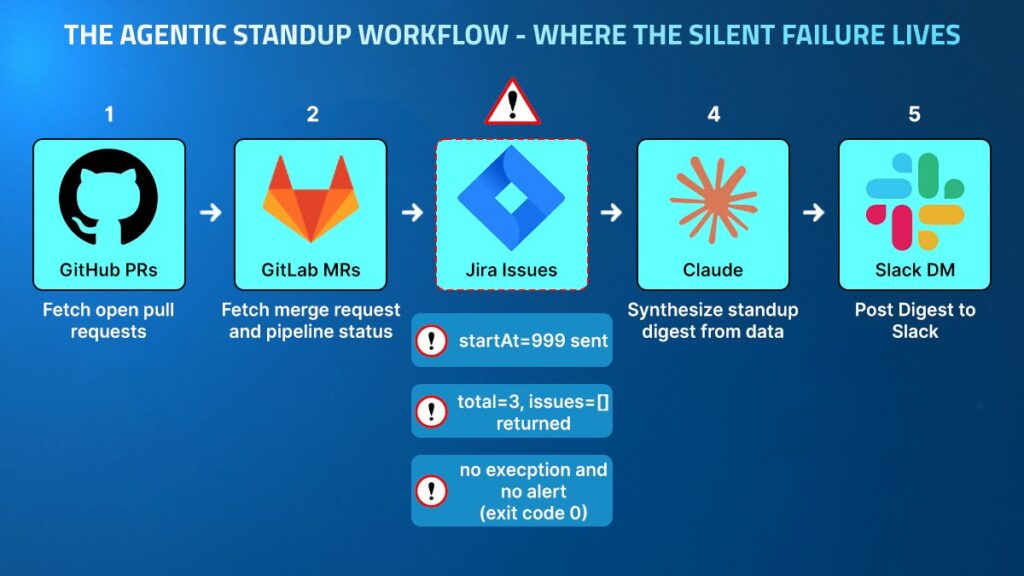
The standup agent is a five-step agentic workflow that runs in a Spring Boot @Scheduled loop every 60 seconds. It fetches each engineer’s open GitHub pull requests, GitLab merge requests with pipeline status, and in-progress Jira issues, passes everything to Claude to synthesize a standup digest, and posts the result to Slack. The workflow touches four external APIs and makes eleven HTTP calls per cycle.
On the day of the incident, the agent completed every step:
- GitHub returned 10 open pull requests
- GitLab returned 1 merge request with a failed pipeline
- Jira returned zero in-progress issues
- Claude synthesized a digest from the data it received
- Slack confirmed delivery with ok: true and a timestamp
The engineer opened Slack and saw a digest with no Jira data. The P1 blocker TRADE-891: High-value trades rejected by fraud service — the highValue flag was not set. It had been open for three days, and the engineer did not know.
The cause was a stale pagination cursor. The Jira API call was constructed with startAt=999, a value past the end of any real result set. The API responded correctly with:
| {“total”: 3, “startAt”: 999, “issues”: []} |
The agent read issues: [] and treated it as the complete result. No exception fired because the API call succeeded, and no alert triggered because the workflow completed. No log captured the divergence between total=3 and issues.size()=0 because nobody had written that log.
The workflow succeeded, and the output was wrong. The engineer started their on-call rotation without visibility into the most critical open ticket in the queue.
Why Agentic Workflows Produce This Failure Class
Why fetchJiraIssues() Cannot Tell a Wrong Page from an Empty Result
Traditional service failures are detectable because a service either returns an error code, fails a health check, or produces output that is invalid according to a schema validator. Agentic workflows do none of these things when they encounter stale or missing data, because the agent’s job is to synthesize a result from whatever it receives, and an empty list is a valid input that produces a valid output.
When StandupWorkflow.fetchJiraIssues() returns an empty list, buildDigest() renders “Jira Issues: none found.” That is not an error state from the workflow’s perspective; it is a correctly handled edge case. The agent cannot distinguish between:
- Zero Jira issues because the engineer genuinely has no in-progress work
- Zero Jira issues because the API silently returned the wrong page
That distinction lives in startAt, total, and issues.size() at the moment the HTTP response was parsed, and that state is gone by the time anyone investigates.
Traces Show Success Where the Failure Lives
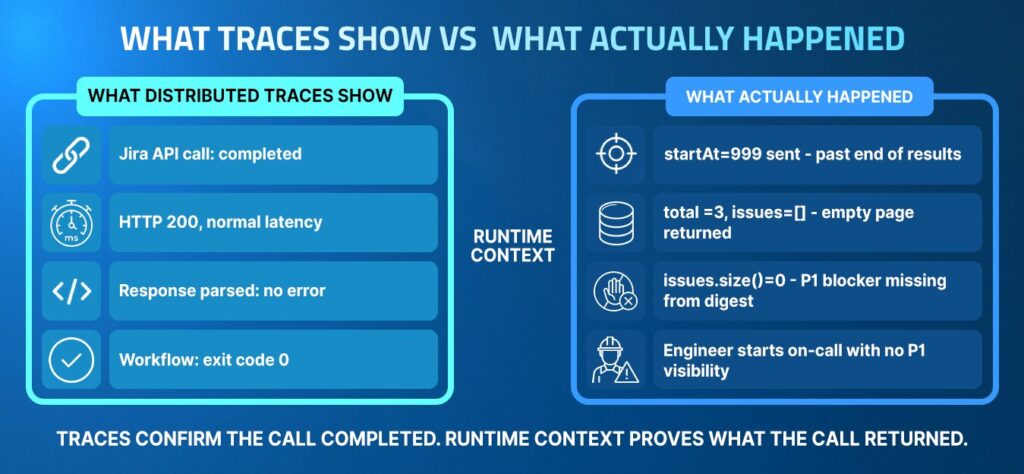
Distributed tracing records the API call to Jira as successful: HTTP 200, normal latency, response parsed without errors. LangSmith, Langfuse, and Datadog LLM Observability all surface a completed tool invocation with a valid response. What none of them surface is that total=3 and issues=[] are contradictory, and that contradiction is evidence of a bug rather than a legitimate empty state.
A trace records that an action was completed, not whether the values involved were correct. The evidence of correctness lives at the variable level within the executing process, and traces were never designed to capture variable state.
According to the State of AI-Powered Engineering 2026 Report by Lightrun, 44% of AI SRE investigations fail specifically because execution-level data was never captured. For agentic workflows, this reflects a structural problem: the existing telemetry was designed to detect service failures, not semantic failures within an agent’s decision-making path.
The Three Debugging Challenges Specific to Agentic Workflows
1. Correct Execution, Wrong Values
The standup agent’s Jira step executed exactly as written:
- The HTTP client sent the request
- The response came back with HTTP 200
- The body was parsed without throwing an exception
- issues: [] was returned as the result
The bug lived in the value of startAt at the moment the request was constructed, determined four lines earlier by: final int startAt = bugMode ? 999 : 0. No mechanism verified that the offset sent matched the page intended, and no downstream check compared the returned total against the length of the returned issues list.
This is the dominant failure mode in agentic workflows. Agents are built to handle edge cases gracefully rather than fail loudly on semantically incorrect inputs. The engineering decision that makes agents robust in production is the same decision that makes bugs invisible: graceful degradation swallows the signal.
2. Evidence Disappears at the Process Boundary
By the time the engineer noticed the missing Jira data, the standup agent had already run three more cycles.The local variable startAt, the JiraSearchResult object containing total=3 and issues=[], and the HTTP response body had all been discarded from memory by the runtime. The evidence was gone.
To reconstruct what happened, the engineer would need to:
- Add logging to capture startAt, result.getTotal(), and result.getIssues().size()
- Rebuild and redeploy the service
- Wait for the next scheduled execution
- Verify that the new logs captured the right values
According to the Lightrun State of AI-Powered Engineering 2026 Report, the average production fix requires three manual redeploy cycles to verify. For a bug that manifests every 60 seconds and produces no error signal, it means the wrong digest continues to reach the engineer on every cycle during the entire investigation window, assuming the bug reproduces immediately with real credentials, which it may not.
3. The Agent Has No Runtime Self-Awareness
When fetchJiraIssues() returns an empty list, the agent cannot ask itself: did I receive zero issues because the engineer has nothing in progress, or because I sent a request with a wrong offset? Answering that question requires observing startAt, total, and issues.size() at the moment the HTTP response was parsed. The agent has no access to that state from within its own execution.
This is what the Lightrun State of AI-Powered Engineering 2026 Report identifies as the primary production bottleneck: 60% of engineering leaders cite a lack of understanding of live production system behavior as their primary challenge in incident resolution.
For agentic workflows, this bottleneck is structurally worse than for traditional services because the workflow’s output is designed to look correct even when the inputs were wrong.
What Runtime Context Changes
The Lightrun Runtime Sensor operates inside the running process, not outside it.
Rather than waiting for observability platforms to surface an issue, it allows engineers and AI agents to place conditional snapshots at any executable line of code and capture the exact variable state at that point in the execution, under real traffic, without stopping the process or adding a single line of application code.
For the standup agent, this means:
- Snapshot placed at StandupWorkflow.java:60, the line where jiraResult and issues are both in scope
- Snapshot fires on the next @Scheduled execution
- Captures jiraResult.getTotal(), jiraResult.getStartAt(), issues.size(), bugMode, runCount
- Reports values to the Lightrun platform while the agent continues to run, post digests, and serve requests
No redeployment. No added logging. No process restart.
Lightrun MCP: Runtime Context at Build Time
Lightrun MCP connects AI coding assistants to the Lightrun Runtime Sensor at build time, enabling the assistant to query the live execution state while the engineer writes or reviews code. Compatible with Cursor, Claude Code, and GitHub Copilot.
A developer using Cursor or Claude Code with Lightrun MCP connected can ask:
What is the runtime state of startAt, jiraResult.getTotal(), and issues.size() inside fetchJiraIssues when the agent is running in production right now?
Lightrun MCP places a snapshot at the target line, waits for the next execution cycle, retrieves the captured values, and returns them directly in the IDE context. The developer sees startAt=999, total=3, issues.size()=0 without:
- Switching to a monitoring dashboard
- Opening a separate observability tool
- Waiting for a redeploy to add logging
- Reproducing the issue in a staging environment
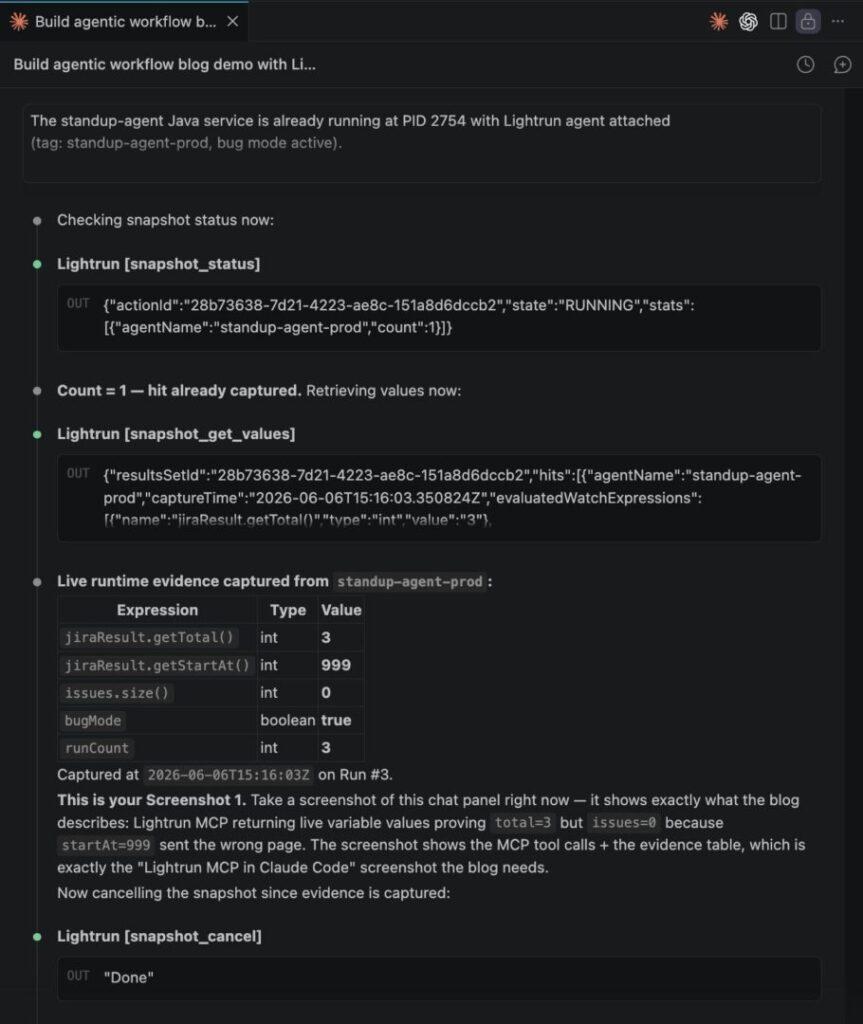
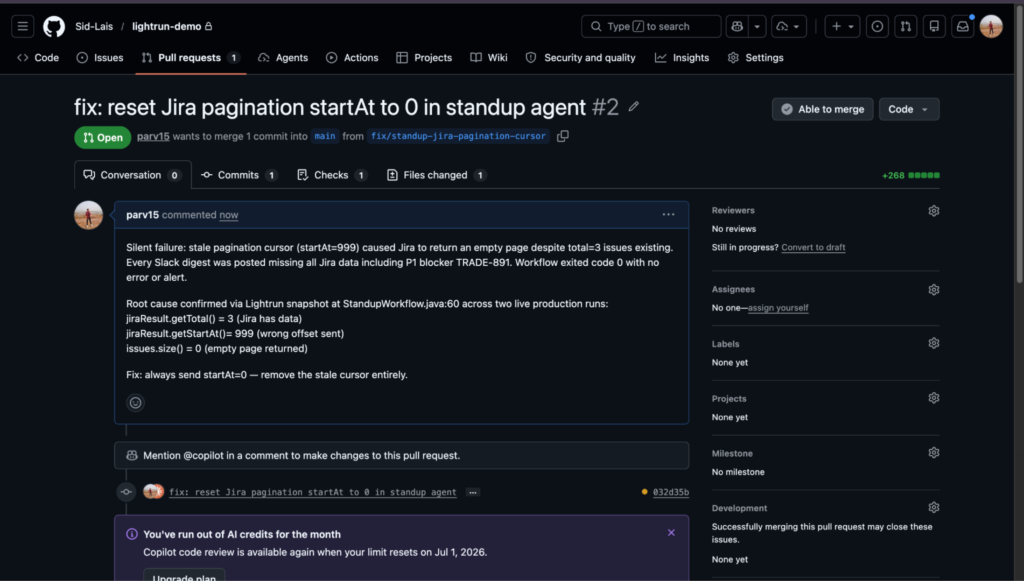
As you can see in the screenshot above:
- jiraResult.getTotal()=3 alongside jiraResult.getStartAt()=999 confirms the request was sent with an offset past the end of the result set
- issues.size()=0 at the same execution point proves the empty list was not a legitimate empty state, but a wrong-page response captured from the live process, without a single line of added logging or a redeploy.
This is the peacetime pathway for runtime context for AI coding agents: before the bug causes repeated missed digests across the team, the developer has the execution-level evidence to understand what the code is actually doing under real conditions.
The Lightrun Error Remediation Automation Skill: From Error to PR, Autonomously
When an error fires in production, the Lightrun Error Remediation Automation Skill does not wait for an engineer to open a dashboard, write a prompt, or start an investigation. It activates on its own, and the sequence runs end to end without human intervention.
1. Error triggers the skill
The moment a qualifying error is captured by a connected monitoring source Sentry, Datadog, New Relic, Dynatrace, or Splunk the skill picks it up and begins working. No developer prompt required, no dashboard to open, no ticket to file.
2. The agent starts the investigation autonomously
Before touching any runtime tool, the agent frames the investigation question, generates a hypothesis matrix, and checks run history for any prior investigation of this error class. If this error has appeared before, the context is already there.
3. A snapshot is placed on the live process
The agent maps the code path and identifies the exact line where the relevant variables are in scope. It places a conditional snapshot directly on the running process through Lightrun MCP no redeploy, no restart, no added logging.
4. Runtime evidence is captured
The snapshot fires on the next natural execution cycle. Variable values come back from the live process, and the agent verifies the evidence satisfies the result gate before drawing any conclusions.
5. Diagnosis is made from evidence, not assumption
With snapshot hits in hand, the agent confirms or rules out each hypothesis one by one. Every conclusion is tied to a captured runtime value not a guess, not a stack trace, not a log line someone happened to add.
6. A PR is raised with the fix and the full investigation record
The agent applies the fix and raises a pull request backed by real production evidence. The diff is one line. The description is a complete investigation record of the hypothesis matrix, which hypotheses were ruled out and why, the snapshot values captured from the live process, and the exact code path that produced the failure. Your engineers are not starting an investigation. They are reviewing a conclusion.
This is not a human workflow that happens to use AI and the engineer’s only involvement is the final review before merging the PR.
As Lightrun positions it: “Lightrun MCP provides capability. Lightrun AI Skills guarantee method.”
The 9-Phase Investigation: What the Skill Actually Does
Phase 1: Problem Framing
The skill defines the investigation question in one sentence before any tool is called: “Why does the standup agent post a digest to Slack with no Jira issues, despite Jira containing 3 open issues assigned to the engineer?”
Phase 2 and 3: Known Check and Hypothesis Matrix
The skill checks the persistent state for any prior investigation of this problem. New problem confirmed. Three hypotheses generated with confirming and falsifying signals before touching any runtime tool:
| Hypothesis | Confirms when | Rules out when |
| H1: Stale pagination cursor | startAt=999, total>0, issues.size()=0 | startAt=0 at runtime |
| H2: JQL syntax is wrong | total=0 | total>0 |
| H3: Auth scope failure | HTTP non-200, empty body | 200 with total population |
Phase 4: Preflight
| get_runtime_sources → Default Agent Pool → standup-agent-prod ✓ |
Agent is confirmed live, and the investigation proceeds.
Phase 5: Code Path Mapping
The full execution path is mapped before any snapshot is placed:
| StandupWorkflow.run() :47 fetchJiraIssues() :113 mockJiraResult() :163 bugMode=true → startAt=999 set return result:181 issues = jiraResult.getIssues() :56 log.info total/startAt/size:60 ← snapshot placed here buildDigest(prs, issues) :72 ← issues=[] enters digest postToSlack(digest) :75 |
Line 60 is selected as the snapshot target: both jiraResult and issues are in scope, and it executes on every cycle.
Phase 6 and 7: Evidence Collection and Result Gate
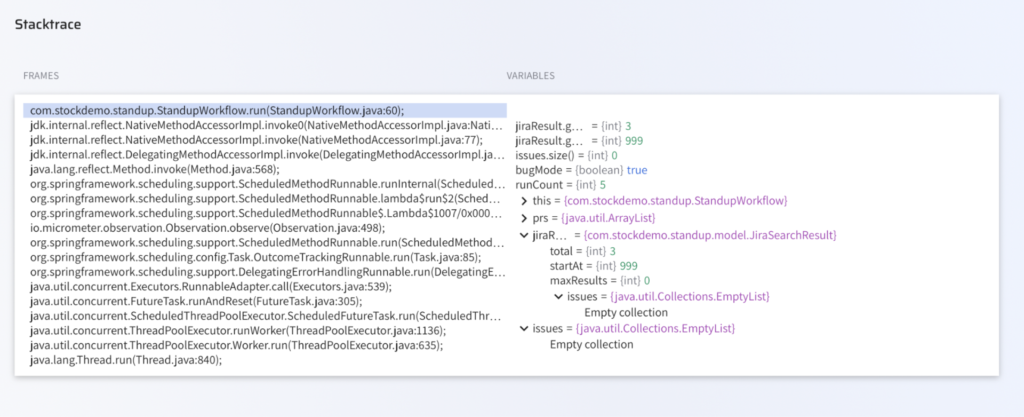
As you can see in the screenshot above:
- jiraResult.getTotal()=3 alongside issues.size()=0 proves this is not a legitimate empty state but a wrong-page API response
- The call stack confirms a real Spring @Scheduled execution path, not a test harness or synthetic trace
Two hits retrieved across consecutive runs, both producing identical values. The mandatory result gate is satisfied before any diagnosis is made.
Phase 8: Diagnosis
Evidence from the two snapshot hits eliminates two hypotheses immediately:
- H2 ruled out: total=3 confirms Jira has data. The JQL query is correct.
- H3 ruled out: Same reason. The API call was authenticated and returned a valid response.
- H1 confirmed with high confidence: startAt=999 proves the wrong offset was sent. The mismatch between total=3 and issues.size()=0 is the direct evidence of an empty-page response.
Root cause: final int startAt = bugMode ? 999 : 0 at StandupWorkflow.java:127.
In production, the wrong branch is active.
Phase 9: Fix and PR Delivery
With the diagnosis conclusive, the skill applies the fix and opens a pull request.
The fix is in the one line:
| // Before — stale pagination cursorfinal int startAt = bugMode ? 999 : 0; // After — always start from page zerofinal int startAt = 0; |
The PR raised by the agent contains more than a diff. The description includes the full investigation record: the hypothesis matrix, each hypothesis that was ruled out and the evidence that ruled it out, the snapshot values as a table (startAt=999, total=3, issues.size()=0), and the identified root cause.
The reviewer does not need to re-investigate. They read the evidence, verify the fix makes sense, and approve.
How the Two Lightrun Pathways Address Each Agentic Workflow Challenge
| Challenge | Lightrun Capability | What Gets Captured |
| Silent value error (stale offset, empty page) | MCP snapshot at the decision point | Variable values at the exact execution moment |
| Evidence disappears at the process boundary | Runtime Sensor: no redeploy needed | Live state captured from the running process |
| The agent has no runtime self-awareness | Lightrun MCP in IDE | Live values returned to the AI assistant context |
| Hypothesis testing without evidence | Error Remediation Automation Skill | 9-phase evidence-first investigation |
| Fix delivered without proof | Skill Phase 9: PR with snapshot evidence | Runtime values embedded in PR description |
| Reproducing requires redeployment | Conditional snapshot on @Scheduled code | Captures on the next natural execution cycle |
| Investigation starts from scratch each time | Run history stored across sessions | Prior investigation context available for recurring errors |
What Traces Cannot Tell You About Your Agentic Workflow?
The engineering cost of the standup agent failure was not in the fix. The fix is one line. The cost was in every minute between the first wrong digest and the moment the variable values were captured, because agentic workflows that produce correct-looking output silently are the worst possible environment for blind investigation.
Traces confirm that actions were completed. They cannot prove what values were involved. When the failure is semantic, the evidence lives in a variable state that trace tools were never designed to capture.
The Lightrun Error Remediation Automation Skill changes the response model entirely. The error fires. The skill runs. The snapshot goes in. The evidence comes back. The PR goes up. The engineer reviews.
No one needs to notice something is wrong. No one opens an investigation, adds logging, redeploys, or waits. The full investigation outputs every hypothesis, every piece of evidence, every conclusion is stored in run history. Recurring errors carry prior context. The cycle does not start from zero again.
Lightrun delivers runtime context across two pathways: MCP for build-time validation before code ships, and AI SRE for runtime-grounded diagnosis when things break. Both are grounded in the same principle: AI is not the source of truth, but the runtime context is.
FAQ
A Lightrun AI Skill is a structured, repeatable investigation workflow that defines phases, evidence gates, and output requirements, not just a goal. Unlike a prompt, a skill enforces the method, so every investigation follows the same sequence from hypothesis matrix through snapshot capture to PR delivery, regardless of which model runs it.
Agents are built to synthesize a result from whatever they receive, so empty lists and unexpected API responses are treated as valid inputs rather than failures. Bugs that produce semantically incorrect inputs, wrong offsets, stale values, or missing fields generate correct-looking output with a green exit code and no error path triggered.
Runtime context is the execution-level state captured at a specific line of code: variable values, call stacks, and execution counts at the exact moment an instruction runs. Tracing records that an action was completed; logging captures what the developer chose to print; runtime context captures what was actually in memory, without a redeploy.
Lightrun MCP connects AI coding assistants such as Cursor, Claude Code, and GitHub Copilot to the Lightrun Runtime Sensor. The assistant places a conditional snapshot at the target line, polls for hits, and returns the captured variable values directly in the IDE context, with no tool switch and no redeployment.
No. The skill connects to error monitoring sources such as Sentry, Datadog, New Relic, Dynatrace, and Splunk. When a qualifying error is captured, the skill activates autonomously and the agent begins the investigation without a developer prompt. Teams can also configure schedule-based triggers or severity filters to control which errors the agent processes.
Those tools capture what the agent called, in what order, and with what latency. Lightrun captures the variable state within the code that processed each response, the exact value of startAt when the Jira request was built, and the total, along with issues.size() when the response was parsed. The trace tools confirm the call completed, but Lightrun proves what the call returned.