Why Observability Isn’t Enough for AI Coding Agents
Jun 29, 2026 / Updated: Jun 29, 2026


Observability platforms collect pre-instrumented logs, metrics, and distributed traces to monitor production systems and surface failures to human engineers. The adoption of AI into engineering has led observability providers to offer those same signals to agents. This is often packaged as AI observability, but the signals themselves were designed around a human investigation loop. AI coding agents work faster, consume data differently, and need feedback as they work rather than after deployment. A new development loop requires a new approach to investigation.
Key Takeaways
- Observability was designed around a human investigation loop: signal, alert, dashboard, hypothesis, redeploy. Every step assumes human attention and familiarity with the codebase.
- AI coding agents have increased code volume by 180% relative to the pre-agent baseline (NBER, May 2026), outpacing any human-paced investigation cycle.
- AI-generated code contains 1.7x as many bugs as human-written code (State of AI vs Human Code Generation, 2025), and many of those failures hit edge cases that produce no telemetry signal at all.
- Telemetry describes what the system was pre-configured to report. It cannot capture variable values, conditional branches, or dependency responses that were never instrumented.
- Runtime Context generates missing evidence on demand from the live running system (at the exact failure line, without a code change or redeployment), closing the gap that observability was never designed to close.
What Is AI Observability?
AI observability has two distinct meanings. In the LLM tooling market, it refers to tracing prompt inputs, outputs, token usage, and model behavior across inference pipelines. In the context of production engineering, it describes routing traditional monitoring signals (logs, metrics, distributed traces) to AI coding agents via MCP so they can reason about system failures. This article addresses the second definition.
These monitoring signals may reveal that request latency increased in a checkout service, that a payment API returned errors, or that a particular microservice experienced an abnormal load. But the data is retrospective. It is the starting point of every incident investigation, and the question that always follows is whether the behavior can be reproduced to understand why it happened.
Why Observability Was Built for Human Investigation Cycles
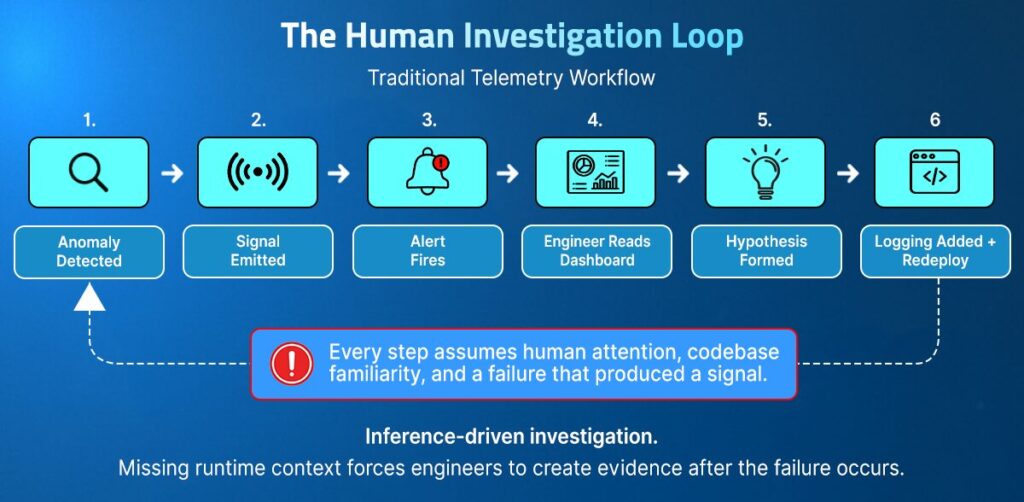
Observability was designed around a specific investigation model: a system emits signals, those signals trigger an alert, a human engineer reads the alert, interprets the dashboard, forms a hypothesis, and digs deeper. Every step in that chain assumes a human in the middle.
Dashboards are designed for human reading: visual, aggregated, organized for interpretation. Alerts are calibrated to human attention, filtered to avoid noise fatigue and batched for readability. Even distributed traces are structured for a human to follow a request path and reason about which hop introduced the latency or error.
This architecture works when the engineer investigating the incident is the same person who wrote the service, or has enough codebase context to interpret a stack trace and form a hypothesis about root cause. It works at a pace where reading three dashboards and issuing a few log queries is a reasonable first step.
The investigation loop observability was built for looks like this:
- Anomaly produces a signal
- Signal triggers an alert
- Engineer reads dashboard and locates the failing component
- Engineer forms a hypothesis about root cause
- Engineer adds logging, redeploys, waits for reproduction
- Engineer confirms or revises the hypothesis
Every step assumes available human attention, codebase familiarity, and a failure mode that produced a signal in the first place. Failures that produced no alert never enter the loop at all.
How AI Coding Agents Break That Assumption
AI coding agents don’t read dashboards, don’t have familiarity with the codebase, and don’t form hypotheses by correlating three telemetry sources with years of experience with a specific service. They’re also shipping code at a scale the human-paced investigation loop was never built to absorb.
A May 2026 study from the National Bureau of Economic Research, which analyzed more than 100,000 GitHub developers, found that autonomous coding agents increased code volume by 180% relative to the pre-agent baseline. According to a survey of 15,000 developers by The Pragmatic Engineer, 95% of engineering teams now use AI tools at least weekly, with 55% regularly using AI agents, up from near-zero 18 months earlier. That code isn’t being written by engineers who understand its production implications. It’s being generated by agents reasoning over static context: the codebase, the ticket, the tests. None of them has ever seen the service run.
The quality gap is already showing up in production. In Google Dora’s 2025 Report, AI adoption is associated with a meaningful increase in software delivery instability of almost 10%. This is because the pace and volume of code generation have outpaced validation.
The observability loop breaks under these conditions for four reasons:
- Unfamiliar code ships faster than context accumulates. An engineer debugging a service they didn’t write, containing logic generated by an agent they didn’t configure, cannot form a hypothesis from a stack trace alone.
- More deployments mean more novel failure modes. Observability catches patterns. Novel failures, especially from AI-generated logic hitting edge cases, produce no historical pattern to match against.
- Silent failures don’t trigger alerts. If the observability stack never fires, the human investigation loop never starts, and neither does an agent’s.
- The direction of need has inverted. Observability was designed for after-the-fact investigation: something breaks, engineers pull the data, and they work backward. AI agents need this data before-the-fact, as an active input into probability-based engineering decisions.
Observability was designed for a world where humans wrote the code, knew the system, and had time to investigate. But now with agents writing code, validating a fix, or planning a deployment, they need to know how the system behaves right now, not how it behaved the last time something went wrong.
What Telemetry Cannot See During Execution
When static telemetry works as intended (alert fires, the engineer investigates, traces the load), it describes what the system reported externally. It does not describe what the system did internally.
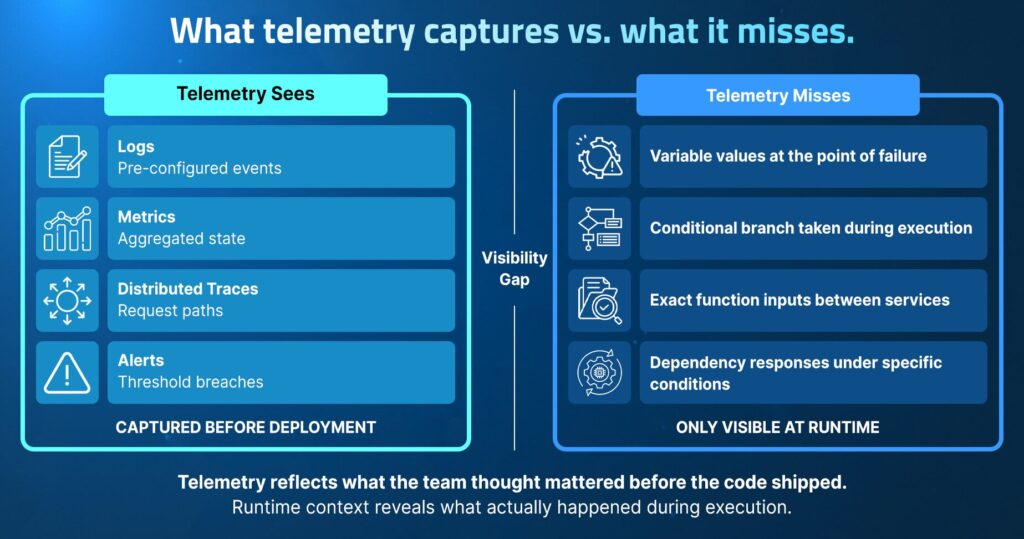
Logs are records of events the application is configured to record; metrics are aggregations of measurable state; and distributed traces are request paths through instrumented service boundaries. All three reflect decisions made during development about what to capture. Anything outside those decisions is invisible.
This creates a fundamental pre-configuration problem. To capture telemetry from a failure site, the site must be identified and instrumented before deployment. Engineers have to anticipate where failures might occur and add logging accordingly.
Any failure mode that wasn’t considered during development produces no signal, and because logging has a real cost (excessive instrumentation slows the system and drives up data ingestion costs), engineers make deliberate tradeoffs about what to capture.
The result is a telemetry coverage map that reflects what the team thought mattered before the code shipped, not what an agent or human engineer needs when something unexpected breaks in production.
In practice, that means telemetry routinely misses the execution details that explain why a failure occurred:
- Variable values at the point of failure. If a pricing calculation produced an invalid result because a specific combination of promotional rules and cart totals triggered an overflow, that value is not in any trace. It was never logged.
- Conditional branch taken during execution. If a feature flag activated an alternate code path that a coding agent introduced last Tuesday, telemetry shows the error. It doesn’t show which branch ran or why.
- Function inputs are passed between services. The exact payload that reached a payment gateway (including any field that was quietly malformed) doesn’t live in a distributed trace unless someone explicitly instrumented it.
- Dependency responses under specific conditions. A downstream fraud detection API that returns a non-standard response format for high-value transactions under load won’t surface that response in metrics. It’ll show a latency spike and an error rate.
The iterative debugging loop that results (add logging, redeploy, wait for the issue to reproduce, check the new logs, repeat) was acceptable when engineers had time to run it. However, it’s not compatible with the pace at which AI agents work, acting as a brake on the productivity gains AI-engineering is meant to deliver.
Why AI Agents Need a Live Feedback Loop, Not a Retrospective Record
AI agents do not simply automate human engineering processes. They operate entirely differently, and as a result, the stakes of retrospective data are higher. At every stage of the SDLC (writing code, reviewing a PR, validating a fix, planning a deployment), an agent makes probabilistic decisions, producing outputs that reflect the most likely answer given its context.
A human engineer reading static telemetry can apply judgment and experience to compensate for what’s missing. An agent cannot. Without live runtime conditions to validate against, it can optimize for the wrong runtime state, with no signal that its context is stale or incomplete, and without a mechanism to know it should proceed differently.
This is the feedback loop problem. Agents need to validate their decisions against live runtime conditions as they work, not against a historical snapshot or a post-deploy validation.
Every decision the agent makes about a system state it cannot observe directly is an assumption. Those assumptions may be correct. When they aren’t, the result is code that is structurally sound (it compiles, tests pass, the logic is internally consistent) but behaviorally wrong under the specific runtime conditions of the live system.
These are the hardest failures to catch: no exception is thrown, no alert fires, the system continues running while producing incorrect outcomes until a downstream failure, a data discrepancy, or a customer report makes the problem finally visible.
Passive Observation vs. On-Demand Interrogation
Passive observation, whether surfaced to humans or agents, is bounded by what was configured to be captured before the incident. An always-on function-level sensor captures invocation counts, durations, exceptions, and call graphs: valuable data that still cannot answer questions the sensor was never designed to ask.
On-demand interrogation is different. Instead of reading from a pre-existing data stream, it generates new evidence directly from the running system, at the specific line, specific service, under the exact conditions of the failing request, live.
For those failures, static telemetry produces a signal that says something is wrong. On-demand interrogation produces evidence that explains what happened.
| Capability | Static Telemetry | On-Demand Runtime Context |
| Data source | Pre-instrumented signals | Generated at the failure line, on demand |
| Scope | What was configured to capture | Any variable, call path, or execution state in the live service |
| Silent failures | Not visible (no signal = no data) | Accessible without a pre-existing alert |
| Agent compatibility | Requires a structured output format | Native via MCP; agents ask questions, get answers |
| Redeploy required | Yes, to collect new signals | No |
| New evidence on demand | No | Yes |
How Runtime Context Closes the Loop for AI Agents
Lightrun’s inline Runtime Sensor enables AI coding agents to interrogate a live production service directly, capturing variable values, execution paths, function inputs, and dependency responses at the exact point of failure, without modifying application code or redeploying.
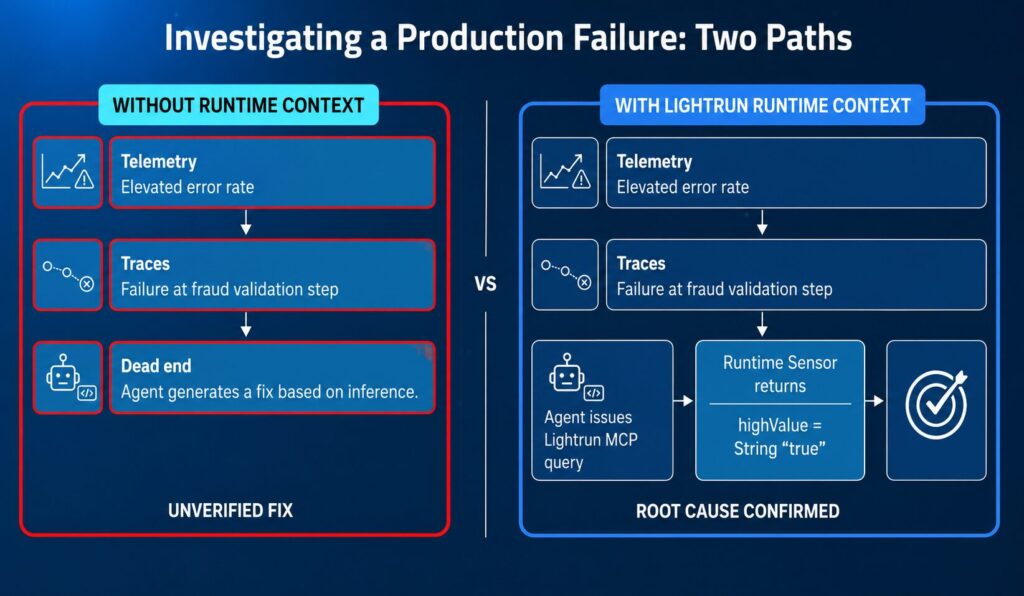
Take an agent investigating a trade validation failure in a financial platform. Telemetry shows elevated error rates in the trade execution service. Distributed traces show that failing requests consistently pass through the high-value trade detection step before reaching the fraud service. The agent knows where the failure occurs, but with the data that it has, it does not know why.
At this point the agent knows where the failure occurs but not why. Confirming the root cause requires inspecting execution details that telemetry never captured:
- The discount value calculated during checkout processing
- The conditional logic applied inside the pricing service
- The exact request payload sent to the payment gateway
- The response returned by the external payment provider
Without Runtime Context, the agent has two options: generate a fix based on static code inspection and hope it’s right, or surface the gap to a human engineer and wait. Neither is compatible with the velocity at which AI agents are expected to operate.
Lightrun captures variable values and logpoints directly inside the live service no code modification, no restart, no impact on production traffic.
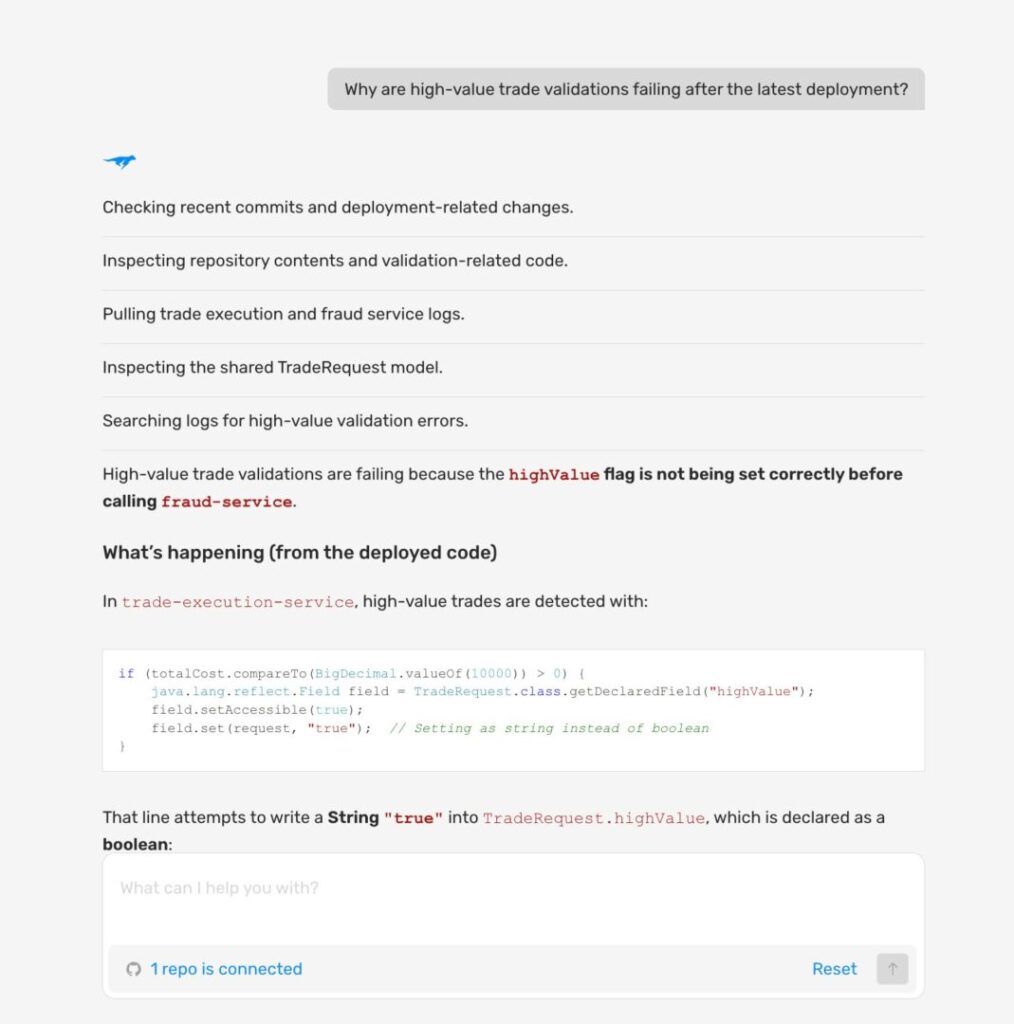
The coding agent such as Claude Code, Cursor or Codex uses the Lightrun MCP to issue a targeted instrumentation request: capture the value of the highValue flag at the point of assignment in TradeRequest inside trade-execution-service on the next qualifying request.
The Runtime Sensor executes the capture within the live service using secure, read-only Sandboxed Instrumentation. The value comes back: String “true”written into a boolean field using reflection, a type mismatch that silently bypasses fraud validation for every high-value trade above $10,000. Staging never caught it because the reflection path only activates under real high-value traffic conditions.
The agent now has evidence instead of inference, a fix grounded in what production actually did rather than what the code was supposed to do. This closes the investigation loop for AI agents in the same way that real-time debugging closes it for human engineers: not by adding more telemetry to reason over, but by generating the specific evidence the investigation requires, on demand, in the live system.
Learn more about Runtime Context
The full investigation stack from anomaly detection through to confirmed fix runs across four layers that each do a distinct job:
| Investigation Layer | Role in Incident Analysis |
| Telemetry signals | Detect anomalies and identify affected services |
| Runtime context | Reveal execution behavior, such as variables and conditional logic |
| Code analysis | Connect runtime behavior to specific code paths |
| AI-assisted reasoning | Correlate signals and highlight likely failure conditions |
Lightrun AI SRE correlates runtime signals, logs, and code paths to identify the root cause, moving the agent from hypothesis to confirmed fix in the same session. It identifies that highValue is being set as a String instead of a boolean, the exact runtime condition causing high-value trades to bypass fraud validation silently, confirmed without redeployment.
Observability handles the first layer, runtime Context provides the second, and Lightrun Deep Code Research connects the third and fourth.
The Investigation Loop Has to Match the Development Loop
Observability was built for a development pace and context where human investigation was the bottleneck. It isn’t anymore, and the mismatch runs deeper than speed. The code ships with more novel failure modes than pattern-matching can handle, requires before-the-fact validation rather than after-the-fact investigation, and produces silent failures that a signal-based system never surfaces at all.
Runtime Context doesn’t replace observability. Telemetry still detects anomalies and localizes failures; that part of the loop works. What Runtime Context provides is the evidence layer that was always missing: the ability to ask production a question it has never been asked and get the answer from the live system, closing the gap between “where did this fail” and “why.”
When the development loop runs at machine speed, the investigation loop has to as well.
FAQs
AI observability has two distinct meanings. In the LLM tooling market it refers to tracing prompt inputs, outputs, and model behavior across inference pipelines. In production engineering it describes routing traditional monitoring signals (logs, metrics, distributed traces) to AI coding agents via MCP. The signals remain pre-instrumented and retrospective; the recipient changed, but the underlying architecture did not.
Observability tools fail with AI coding agents because they were designed for after-the-fact investigation, not before-the-fact validation. Human engineers can read a dashboard, interpret a stack trace, and form hypotheses from experience. AI coding agents cannot — they make probabilistic decisions with no mechanism to know when their assumptions about production are wrong, and observability only confirms what broke after it broke.
Observability cannot detect many AI-generated code failures because it requires failure sites to be instrumented in advance of deployment. Any failure mode nobody anticipated produces no signal, and the cost of excessive instrumentation (performance degradation, data ingestion costs) means teams cannot instrument everything. AI-generated code introduces more novel failure modes than human-written code; logic that is structurally sound and passes tests can be behaviorally wrong under specific live runtime conditions. Those failures produce no exceptions and fire no alerts.
Observability captures what the system was pre-configured to report: logs, metrics, and traces collected before the incident. Runtime Context generates new evidence on demand from the live system (variable values, execution paths, function inputs, and dependency responses) at the exact point of failure, without code changes or redeployments.
Lightrun’s Runtime Sensor connects to live production services via MCP, allowing AI coding agents to capture specific runtime evidence on demand (variable values, conditional logic, function outputs) at the exact point of failure. The capture uses Sandboxed Instrumentation, which means no code changes, no redeployment, and no impact on production traffic. Agents receive evidence grounded in actual production behavior rather than inferences from static code or pre-existing telemetry.