Why Does MTTD Stay High Despite Observability Tools Running?
May 04, 2026 / Updated: Jun 14, 2026


Monitoring coverage, anomaly detection, and SLO-based alerting have significantly narrowed detection windows for most failure types, but MTTD remains stubbornly high for a specific silent failure. This blog covers why type mismatches, swallowed exceptions, and values that pass validation without occurring without triggering errors, and what changes when your monitoring stack can generate those signals without waiting for a failure to surface them.
Key Takeaways
- The real problem: Silent failures produce no exception, no error log, and no anomalous metric. The service keeps running, requests complete with HTTP 200, and standard observability sees nothing because it was built to detect failed output, not wrong output.
- Where every fix stops: Every alert in your stack was written for a failure you already knew to expect. The failures that keep MTTD high are the ones nobody anticipated, and you cannot write an alert for something you did not know was coming.
- The bottleneck: According to the State of AI-Powered Engineering 2026 Report, 60% of engineering leaders identify a lack of understanding of system behavior under live production conditions as the primary bottleneck in incident resolution.
- The cost: The same report found that 38% of weekly engineering capacity is consumed by debugging, verification, and environment-specific troubleshooting, the equivalent of two full working days every week.
- The fix: The runtime sensor generates the missing signal at the exact failure line on demand, closing the detection gap without redeployment.
This blog walks through why MTTD remains elevated for silent failures, even in teams with threshold tuning, log aggregation, distributed tracing, and AI triage in place; the five production scenarios where all of those tools miss the failure entirely; and how the runtime sensor closes this gap.
Here is what a silent failure looks like in production.
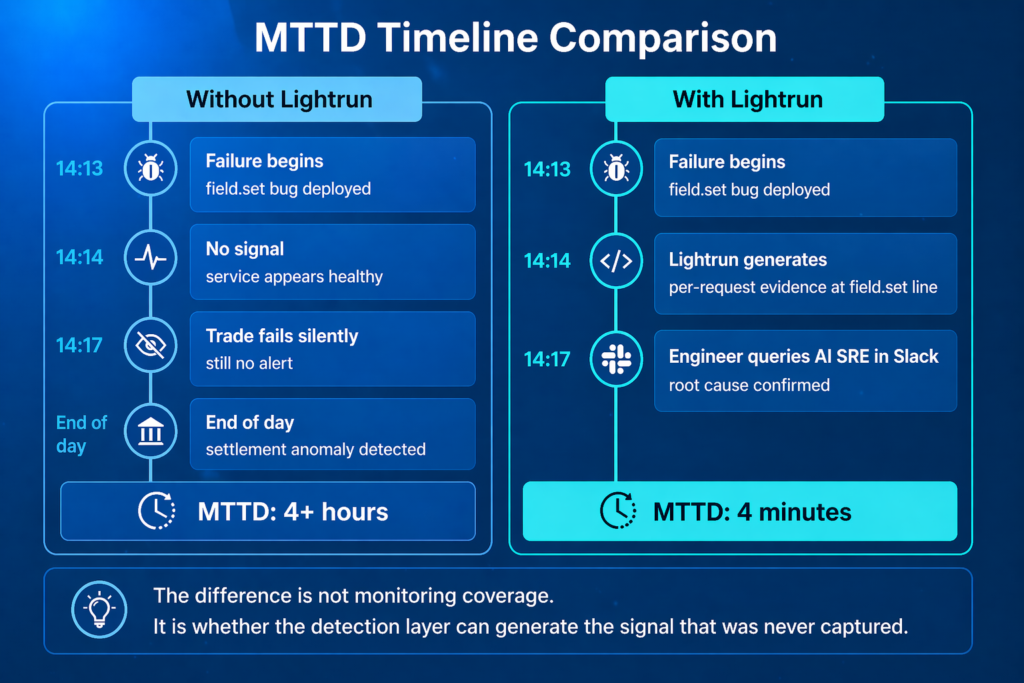
- At 14:13, a schema update deploys to a financial trading platform.
- At 14:14, high-value trades start bypassing fraud validation silently, with no exception, alert, or change in any metric.
- For the next four minutes, the service appears completely healthy.
- Yet at the same time, a user’s trade valued at $12,746.92 processes without being flagged. This is despite a $10,000 threshold for the tuning process being in place. And log aggregation, SLO-based alerting, and distributed tracing are all set up and active.
This incident anchors the hands-on walkthrough later in this blog and illustrates the detection problem every section builds on.
What Is MTTD?
MTTD measures the average time it takes from a failure’s emergence to its detection. MTTR measures how long it takes to fix this failure after it is detected.
In the trading platform incident above, the failure started at 14:13 when the deployment went out. It was not detected until settlement data surfaced, showing the incorrect trades hours later. Despite everything being in place, the fraud check was silently failing the entire time.
Issue resolution until it is detected, so a four-minute failure turned into an hours-long incident.
Most SRE teams have at least one tool covering each of the four detection layers below. Here is exactly where each one failed.
Threshold and anomaly detection
This fires when a monitored metric, such as p99 latency, error rate, or request completion rate, exceeds a configured threshold
In the trading platform incident, p99 was stable at 14:14, the error rate was 0%, and the request completion was 100%. The field.set(request,”true”) threw an IllegalArgumentException that was swallowed in the call stack, leaving highValue at its Java default of false rather than being set to true.
No metric moved because no request failed; no boundary was crossed, so no alert was triggered.
Log-based detection
This surfaces exceptions and errors written to service logs, stdout, Log4j, or whatever ships to your log aggregation platform and fires when a matching pattern appears.
In the trading platform incident, the highValue type error appeared once in the startup logs at 14:13:30 when TradeExecutionService initialized, but never again in per-request logs because field.set swallowed the error at the assignment line.
Every trade after 14:13:30 executed silently; nothing was flagged in the logs, so the aggregation platform was not alerted
SLO-based alerting
This activates when the ratio of failed requests to total requests exceeds the threshold defined in your SLO, for example, more than 0.1% errors in a 30-minute window
In the trading platform incident, every request after 14:14 returned HTTP 200 with a 0% error rate. No request failed, no budget was consumed, and the burn rate stayed flat.
Every number pointed to a healthy service, while every trade above $10,000 bypassed fraud validation.
Distributed tracing
This highlights latency spikes and errors in the request path by recording each hop a request takes through the system from the entry point through every downstream service call and back.
In the trading platform incident, Jane Fraser’s trade produced a complete, successful trace. The request was received, fraud validation was called, and a response was returned. Every hop completed without error or latency spike, the trace showed a working system.
Yet in reality, the system was simultaneously processing fraudulent trades.
Each mechanism above covers a real failure mode well, but they all share one limitation: they can only detect potential issues that were pre-instrumented. As a result, failures that escape detection the longest are concerning because they involve unknown unknowns.
The next section explains exactly what that class of failures looks like and why it consistently slips through every layer of a standard continuous monitoring stack.
Why Silent Failures Defeat Standard Detection
The trading platform incident makes this concrete: every detection layer above was watching at 14:14, and none of them saw anything wrong in the field.set(request, “true”).No tool produced an anomalous metric, an exception, or a failed request; only an incorrect output was processed.
A broken highValue flag that caused the fraud check to silently evaluate as false while every trade above the $10,000 threshold continued processing as if nothing had gone wrong.
The Instrumentation Gap Standard Observability Cannot Close
When the engineering team wrote the monitoring for TradeExecutionService.java, they instrumented the things they expected to need: latency thresholds, error rates, exception alerts, and SLO burn rates.
Nobody considered writing a monitor for “alert when highValue is a String instead of a boolean” because nobody anticipated that failure mode. This is not a gap in monitoring quality but a gap in monitoring scope. You cannot write an alert for a failure you did not anticipate.
The same logic applies to every scenario in the next section. A feature flag evaluation bug, a null API field, a wrong WHERE clause, a misconfigured TTL: nobody writes a metric for these before they happen. They fall outside the instrumentation model by definition, which is why MTTD for these failures is measured in hours or days rather than minutes.
What AI Triage Does and Does Not Fix in Time to Detection
If you add an AI tool at this challenge, it can tell you that the 14:13 deployment is temporally correlated with the 14:14 regression. This is genuinely useful, as it narrows the investigation. But the AI cannot tell you which field broke, what value it is carrying, or why the fraud check is silently returning false, if that evidence was never captured.
It’s important to remember that 44% of AI SRE investigations fail to reach a confirmed root cause because the required evidence was never captured at the detection layer. AI reasoning is only as good as the data it can access.
Five Production Scenarios Where MTTD Breaks Down
Every scenario below follows the same pattern: the failure begins, the service continues to run normally based on all observable signals, and detection depends on a downstream consequence rather than on the root cause. The first scenario comes from a real incident on a trading platform that you will see in the hands-on walkthrough. The other four are failure types any SRE will recognize from their own stack.
1. Type Contract Broken by a Schema Update
In the TradeExecutionService.java incident, field.set(request, “true”) throws IllegalArgumentException on a primitive boolean field. The exception is swallowed at the call site, highValue defaults to false, and the fraud check silently returns false for every trade above $10,000.
The service processes every trade normally: requests are complete, latency is stable, and the error rate is zero. No threshold fires and no exception surfaces. The instrumentation layer was never written to watch for a swallowed exception on a boolean field assignment, so MTTD is effectively infinite until a downstream business consequence catches it.
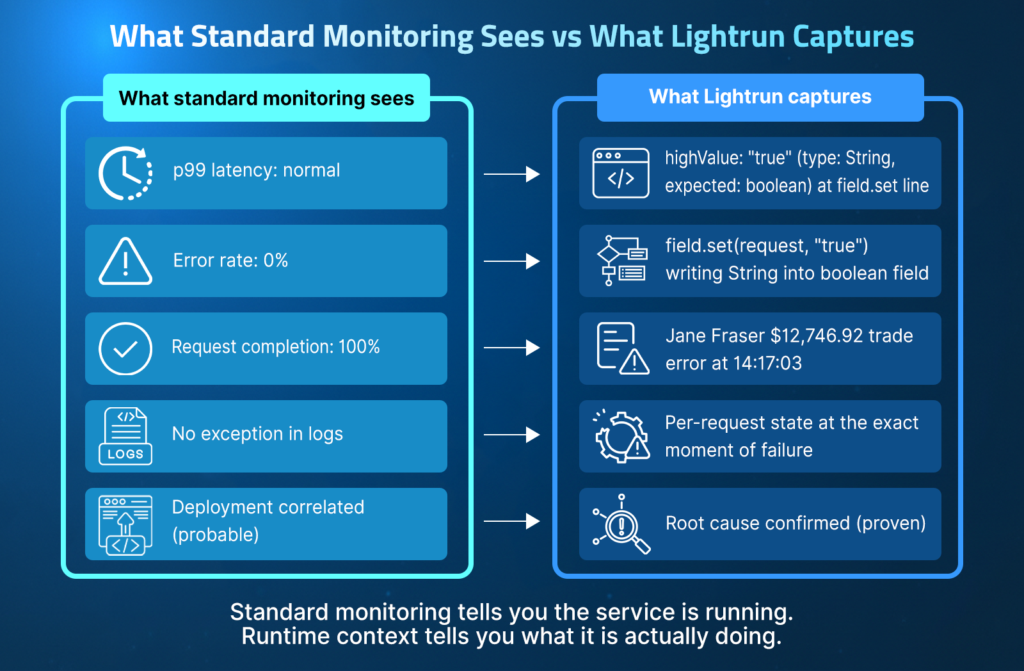
| Visible to monitoring | Not captured |
| Service name and deployment correlation | highValue runtime value per request |
| Validation failures in US-EAST-1 | Why the boolean assignment failed |
| HTTP 200 responses completing normally | Execution state at the field.set line |
2. Feature Flag Evaluated Against the Wrong Audience
A feature flag configured to roll out to 10% of users has a bug in the audience evaluation logic that causes it to activate for 100% of users.
| // Audience evaluation — bug introduced in config update boolean isInRollout = audienceService.evaluate( userId, flagConfig ); // audienceConfig.percentage parsed as 100 instead of 10 // every userId evaluates to true featureFlag.activate(userId, isInRollout); |
The flag evaluation completes without error, the feature ships to every user, and the service returns HTTP 200 on every request. No latency spike, no error rate increase, and no SLO burn. The only signal is a business anomaly: activation metrics show 100% instead of 10%, which a product manager notices the next morning, and MTTD for this is overnight.
With Lightrun, the engineer or AI coding agent can add a conditional snapshot at the flag evaluation line and inspect the audience result per request in the live service, confirming that the evaluation logic matches all users rather than 10%, without touching the running code.
3. Third-Party API Returns an Unexpected Response Format
A payment gateway API silently changes a response field from an integer 0 to null for zero-value transactions.
| int amount = response.getAmount() != null ? response.getAmount() : 0; // null coerced to 0 silently processTransaction(amount); |
The client service parses null as 0 through a default and completes the transaction. No exceptions, no failed requests, and no latency changes. Every metric points to a healthy service. Detection depends entirely on when reconciliation runs and on whether it catches the incorrect amounts.
With Lightrun, the engineer or AI coding agent inspects the parsed response value at the client parsing line, seeing null before it gets coerced into 0, without a redeployment. MTTD closes in minutes rather than at the next reconciliation run.
4. Database Query Returns Empty Results Silently
A refactor introduces an incorrect WHERE clause into a user preferences query.
| // Wrong parameter order after refactor String query = “SELECT * FROM preferences ” + “WHERE tenant_id = ? AND user_id = ?”; // tenant_id and user_id swapped at call site // query returns zero rows for every user List<Preference> prefs = db.execute(query, userId, tenantId); |
The query runs, returns zero rows, and the application falls back to default preferences silently. Every user gets default settings instead of their saved ones. The database query completes successfully, response times are normal, and no error is logged because returning zero rows is not an error.
Detection depends on users reporting wrong behavior or a spike in support tickets, and MTTD for this can be hours to days.
With Lightrun, the engineer or AI coding agent captures the query result set size and the WHERE clause parameter values at the query execution line, confirming the clause is filtering out all rows rather than returning user-specific results, without adding a log statement or redeploying.
5. Stale Cache Data Served After a TTL Misconfiguration
A caching layer TTL is changed from 5 minutes to 6 hours during a configuration update.
| // TTL misconfigured during config update cache.put(priceKey, price, Duration.ofHours(6)); // was Duration.ofMinutes(5) before update // every user receives 6-hour-old price return cache.get(priceKey); |
The pricing service has been serving stale prices to every user for 6 hours. Cache hit rate is 100%, response times drop because everything is cached, and no errors occur because the cache returns valid data. The monitoring stack sees better-than-normal performance.
Detection depends on a user reporting a wrong price or a pricing team noticing revenue anomalies. MTTD: hours, with every metric pointing in the wrong direction.
With Lightrun, the engineer captures the cached value and its insertion timestamp at the cache retrieval line, seeing that the timestamp is 6 hours old before the business consequence manifests, while standard monitoring continues to report a healthy, fast service.
Agent Overhead
Lightrun’s agent adds less than 1% CPU and memory overhead at the JVM level. Snapshots are rate-limited to once per second at the instrumented line, not on every request, and evidence is collected asynchronously without blocking the request thread.
PII and Redaction
Capturing runtime values in a production service means capturing whatever is in those variables: trade amounts, user IDs, and account numbers. Lightrun’s blocklist lets you define fields that are never captured, regardless of where a snapshot is placed. Blocklisted values are redacted before they leave the JVM.
Captured data is returned directly to the engineer’s session and is not stored on Lightrun’s servers.
60% of engineering leaders identify lack of runtime visibility as the primary bottleneck in incident resolution, not alert volume, not routing speed, but visibility into what live systems are actually doing.
Each of these five scenarios describes a failure that standard monitoring was never built to detect, and the next section explains why adding more observability coverage does not change this.
Why Adding More Monitoring Is Not Enough to Improve Silent Failure Detection Rates
The instinct when MTTD stays high is to add more instrumentation: more metrics, more log verbosity, more tracing spans. For the trading demo incident, that instinct leads here:
| // Add logging before the field.set call to capture the value log.debug(“Setting highValue field: value={}, type={}”, value, value.getClass().getName()); field.set(request, value); |
The engineer opens a PR, gets it reviewed, deploys it to production, and waits for another high-value trade above $10,000 to reproduce the failure.
If the account holder, in this case Jane Fraser, is the only affected user in the next 30 minutes, the investigation stalls again. This is the redeployment cycle that compounds on-call time: every hypothesis about a silent failure requires a deployment to confirm, and every deployment waits on a specific production condition to recur.
The same problem applies to every scenario in the previous section. The feature flag audience bug requires adding logging to the evaluation function and redeploying. The null API field requires adding response inspection and redeploying. The wrong WHERE clause requires adding query logging and redeploying.
In every case, you have to add instrumentation after the failure to address a condition you did not anticipate beforehand. Closing the ticket requires generating the missing signal without the redeployment cycle.
What Changes When the Detection Layer Can Generate Missing Signals
Access to runtime sensor means adding the ability to generate missing signals on demand within the live service, at the exact line, for the exact request, at the exact moment the failure occurs. All of this does not require preinstrumentation in advance.
The trading demo walkthrough in the next section uses Scenario 1 to show this in practice. But the same shift applies to every scenario above: the feature flag evaluation, the API response format, the empty query result, the stale cache value.
In every case, the missing evidence lives on a single line in the running service, and the runtime sensor is the only layer that can generate it on demand.
What the Engineer Sees Instead
Instead of opening a PR to add logging and waiting for a redeployment, the engineer opens Lightrun AI SRE and inspects highValue directly in the field.set line in the live TradeExecutionService.java service. What comes back is not a log line from the next deployment. It is the per-request value from the trade that is failing right now:
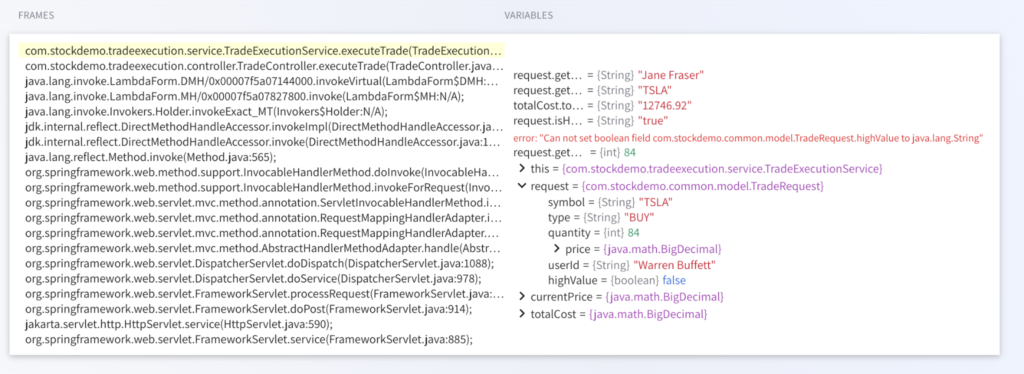
That is runtime sensor: live execution evidence captured from inside the running service, without touching the code, without redeploying, and without waiting for the failure to recur.
The detection window, which would have taken hours, closes the moment the output appears. And once that evidence exists, Lightrun AI SRE can do something that AI triage without runtime evidence cannot: it grounds its analysis in what the code actually did rather than what the deployment timeline suggests.
It traces the swallowed IllegalArgumentException back to the exact field.set call in the 14:13 deployment, confirming highValue defaulted to false on every trade above $10,000, confirms US-EAST-1 is affected, and EU-WEST-1 is not, and delivers a fix proposal in the same session where the detection gap closed, as covered in depth in How to Reduce MTTR with AI-Powered Runtime Diagnosis.
How to Detect a Silent Failure With Lightrun: A Real Incident Walkthrough
This walkthrough has one goal: to show how an engineer goes from zero actionable signal to confirmed root cause in the same session without adding a single log statement, opening a PR, or waiting for a redeployment.
The trading platform incident is the vehicle because it represents the hardest class of silent failure: the JVM rejected the bad assignment, the exception was swallowed, highValue defaulted to false, and every trade above $10,000 bypassed fraud validation, while every metric, trace, and log showed a perfectly healthy service.
At 14:17, the on-call engineer has exactly one signal: a startup log from the 14:13 deployment showing:
| Can not set boolean field com.stockdemo.common.model.TradeRequest.highValue to java.lang.String |
Startup logs fire once at initialization, not per request. This error appeared at 14:13:30 and went silent. The engineer cannot tell whether it is actively breaking live trades right now or whether it resolved itself, and confirming either way requires adding logging to the field.set call and redeploying.
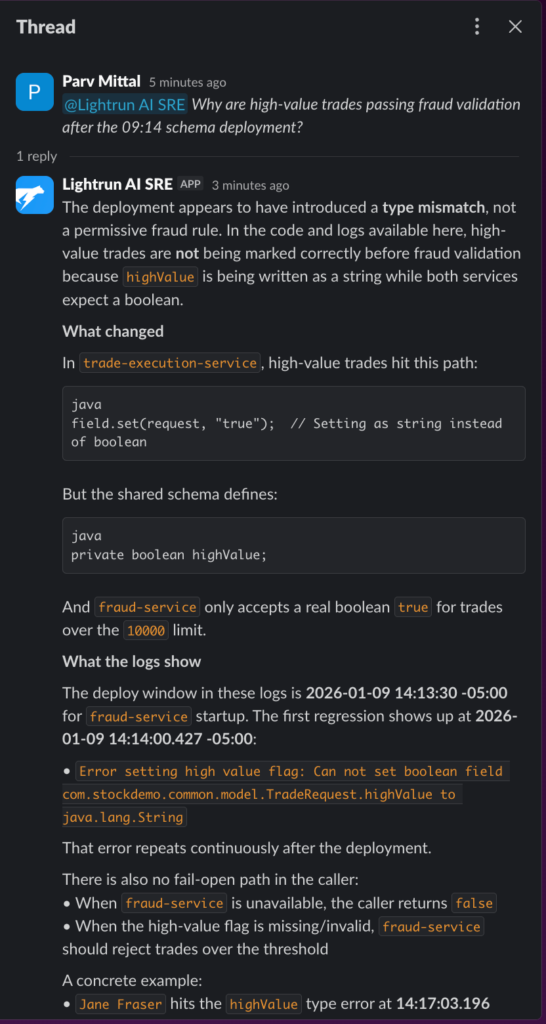
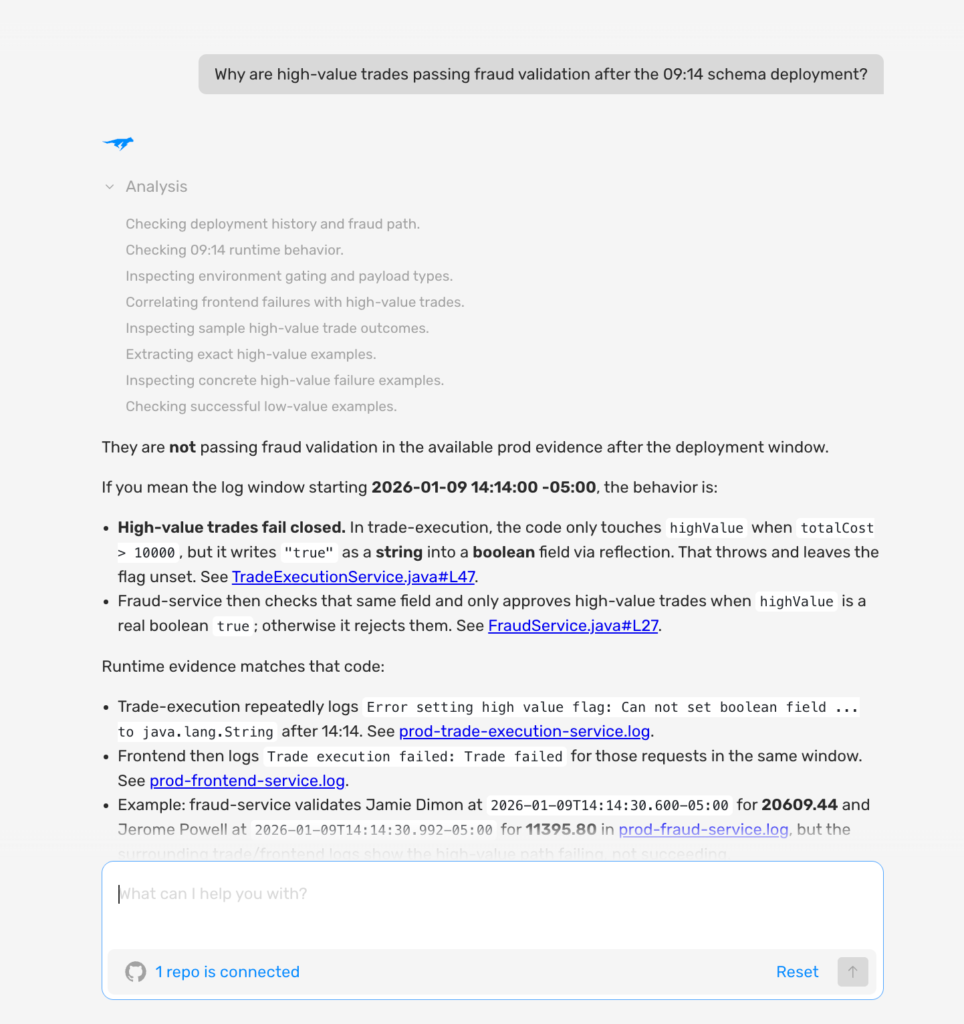
Step 1: Ask Lightrun AI SRE in Slack when no alert has fired: At 14:17, with startup-level logs confirming a type error but no per-request evidence showing which trades are affected, the engineer opens Lightrun AI SRE in Slack and asks one question:
“Why are high-value trades passing fraud validation after the 14:13 deployment?”
As you can see in the screenshot above:
- Lightrun AI SRE identifies the field.set(request, “true”) String-to-boolean mismatch as the most likely cause, cites Jane Fraser’s $12,746.92 trade as a concrete, confirmed instance, and lists exactly what to check next, all from a single question four minutes after the silent failure began
- The response names the missing evidence that would close the detection loop: query completed orders after 14:14:00 with a total value above $10,000 and correlate to fraud requests for the same user and timestamp
Step 2: Capture per-request evidence at the failure line using the Lightrun Sandbox. With the hypothesis grounded, the Lightrun Runtime Sensor captures the missing per-request evidence directly inside the live TradeExecutionService.java service, with no code change, no restart, and no redeploy.
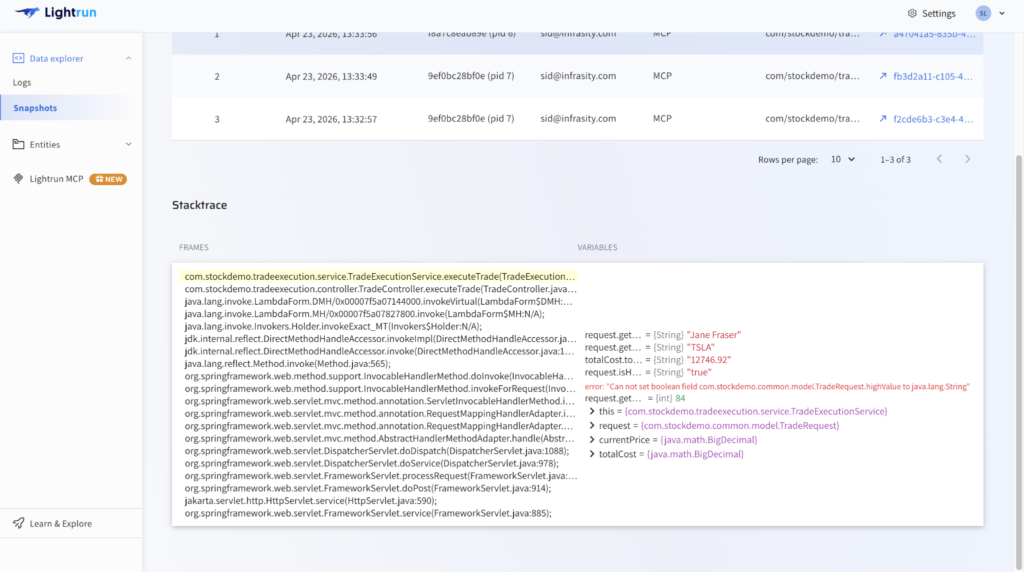
As you can see in the screenshot above:
- highValue is captured as false in the field.set line the IllegalArgumentException was swallowed, the assignment never completed, and the fraud check silently evaluated false for every trade above $10,000, confirming per-request that the 14:13 deployment is writing the wrong type, without adding a single line of instrumentation code or triggering a redeployment
- Jane Fraser’s $12,746.92 trade hits the error at 14:17:03, and the missing signal that standard monitoring never generated is now available at the exact failure line, closing MTTD at the root cause rather than at a downstream consequence
Step 3: Open Lightrun AI SRE for the full RCA, fix proposal, and audit trail: With the type mismatch confirmed in the Sandbox, the engineer opens the Lightrun AI SRE interface to perform the structured root cause analysis, review fix options, and complete the investigation record.
As you can see in the screenshot above:
- The complete investigation, from undetected silent failure at 14:13 to confirmed root cause and fix proposal, is captured in a single session light run AI SRE, with runtime evidence snapshots and commit attribution visible inline
- MTTD on the highValue silent failure: four minutes from failure start to confirmed root cause with Lightrun, compared to hours or end-of-day discovery via downstream business anomaly without it
The detection gap in TradeExecutionService.java was closed in a single session across three interfaces, without a single redeployment. The section below maps each detection failure stage to the specific Lightrun capability that resolved it.
How Lightrun Closes the Detection Gap
Here is what changed at each MTTD failure stage compared to standard observability.
1. From No Signal to Per-Request Evidence
In the five production scenarios detailed above, standard monitoring produced no actionable signal: trades processed normally, feature flags evaluated without error, API responses returned HTTP 200, queries completed successfully, and the cache returned valid data. Every metric looked fine because every metric was designed to catch a different kind of failure.
Lightrun does not add another metric; it captures the per-request value at the failure line on demand for the currently failing request. For the trading demo, that means highValue: false (default, expected: true — IllegalArgumentException swallowed at field.set call site)at 14:17:03.
- For the feature flag scenario, it means audienceMatch: true for a user who should have been excluded.
- In the cache scenario, this means a cached price with an insertion timestamp of 6 hours ago.
In both cases, evidence that was previously unattainable is generated in minutes rather than discovered in hours.
2. From Downstream Discovery to Root Cause Detection
In the trading platform incident, detection relied on settlement data surfacing incorrect trade hours after highValue defaulted to false, and every trade above $10,000 bypassed fraud validation. While the root cause had arisen four minutes before the failure, it took many hours later for it to be detected.
With Lightrun, the engineer inspects highValue at the field.set line in the live service at 14:17 before settlement runs, before a product manager opens a dashboard, before a support ticket is filed. Detection occurs at the failure line, not at whichever downstream system first notices the wrong result.
3. From Probable Cause to Confirmed Cause
AI triage narrows down the investigation. It can tell you the 14:13 deployment is correlated with the 14:14 regression, that the feature flag config change happened two hours before the activation anomaly, or that the cache TTL change preceded the pricing reports.
What it cannot tell you is which field broke, what value it is carrying, and which specific request triggered the failure, because that evidence was never in the telemetry.
For the trading example, Lightrun grounds the AI hypothesis in highValue: false (default, expected: true — IllegalArgumentException swallowed at field.set call site) confirmed per request at 14:17:03.
For the other four scenarios, the same shift applies: the runtime value at the failure line is the confirmation, not the deployment timeline. The investigation moves from “the 14:13 deployment is probably the cause” to “here is the exact line, the exact value, and the exact request that proves it.”
4. From Multi-Shift Investigation to Same-Session Closure
Every scenario that ends without confirmed evidence carries over to the next shift. The engineer hands off an open hypothesis, a partial timeline, and the cognitive overhead of reconstructing context they were not there for.
In this trading example, this means the next engineer inherits “we think it is the highValue field, but we have not confirmed it,” and starts from the same point with the same missing evidence.
With Lightrun, detection, investigation, and root cause confirmation all happen in the same session. The findings are recorded in the audit trail rather than in one engineer’s memory, and the next incident starts from a documented pattern rather than a blank slate.
5. From One-Off Incident to Documented Pattern
Each investigation using Lightrun creates a record: the field that was captured, the value it contained, the line it came from, and the request that confirmed it. The feature flag audience bug, the null API field, the wrong WHERE clause, and the 6-hour TTL: each one becomes a signed and timestamped evidence artifact.
When the same class of failure recurs, and for most teams running schema migrations and API integrations, some version of it will, the investigation closes faster because the failure signature is already documented. The engineer does not start from zero. They start from the last time this happened.
How Each MTTD Challenge Is Solved by a Lightrun Capability
MTTD Challenge
How Lightrun Resolves It
Silent failures produce no telemetry signal
Runtime Sensor generates per-request evidence at the failure line on demand
Detection triggered by downstream symptom, not root cause
An engineer or an AI agent inspects the exact value at the moment it is wrong, before downstream consequences surface
Hypothesis confirmation requires a redeployment cycle
Lightrun Sandbox validates the hypothesis against the live service without a PR, review, or redeploy
Manual investigation extends MTTD across shifts
Root cause confirmed in the same session, findings captured in the audit trail, not in one engineer’s memory
Audit gaps in regulated environments
Every runtime query, evidence artifact, and AI action is fully inspectable and reversible
Lightrun adds the runtime evidence layer that closes the detection gap that monitoring and observability tools cannot reach.
MTTD Stays High Until You Can See the Failure Line
MTTD stays high not because monitoring is slow, but because silent failures fall outside what telemetry was ever designed to capture. Every tool in the five scenarios above was correctly configured and actively watching.
None of them fired because the failures produced no signal that those tools were built to detect. Adding more observability to that stack does not close the gap; it instruments more of the same class of expected failures while leaving the unexpected ones invisible.
In the trading platform incident, the detection gap closed in four minutes instead of 8 hours, not because a new alert fired, but because the engineer inspected highValue at the field.set line in the live service before the settlement data surfaced the wrong trades.
This access to production context through Lightrun’s inline runtime sensor is the only way to end these silent failures.
MTTD measures the time between when a production failure begins and when the engineering team detects it. Lower MTTD means less time the failure runs undetected, less damage to users, and a shorter overall incident timeline from failure to fix. Standard observability detects failures that produce anomalous signals. Silent failures, such as type mismatches and swallowed validation errors, produce no anomalous signal at all, so detection depends on a downstream consequence rather than the root cause, which can be hours later. MTTD measures how quickly a failure is detected; MTTR measures how quickly it is resolved once detected. Reducing MTTD compresses the entire incident timeline because every downstream phase, triage, investigation, and fix, starts from a known root cause rather than an open hypothesis. Silent failures are production failures that produce no exceptions, no error logs, and no anomalous metrics. This is because they produce wrong output rather than failed output. Standard monitoring cannot detect them because there is no signal to watch for, and detection depends on something downstream catching the wrong result. The runtime sensor generates the missing per-request evidence at the exact failure line on demand, inside the live service, without a redeployment. Instead of waiting for a downstream consequence to trigger detection, MTTD closes at the root cause the moment the evidence is generated.FAQ