Top Root Cause Analysis Tools Built for Runtime Context
Mar 24, 2026 / Updated: May 17, 2026


Root cause analysis tools are designed to help engineering teams understand why failures happen in production and other remote environments. As modern systems become more distributed and input-dependent, many incidents cannot be reproduced outside live environments. The stakes are significant: high-impact IT outages cost organizations amedian of $2 million per hour, with annual downtime costs reaching $76 million per organization.
- Most production issues surface under live conditions. Failures tied to real traffic, tenant data, or specific inputs often cannot be reproduced in staging, forcing teams to investigate directly in production systems.
- Redeploy-driven Root Cause Analysis (RCA) adds hours of delay. Single incidents turn into multiple investigation iterations, with each new question requiring another log change, build, and rollout cycle.
- Most AI SRE tools accelerate reasoning, but their investigations rely on existing telemetry without the ability to create targeted evidence. Platforms like Resolve AI, Traversal, and Cleric correlate signals across hundreds of alerts and services, but they can only reason over existing data.
- Runtime context removes guesswork. Tools that inspect live execution paths, variables, and conditions allow engineers to validate or reject hypotheses immediately rather than waiting for the next failure.
- Effective RCA stacks combine approaches. Teams need to pair AI-assisted triage and coordination with live systems investigations to cut investigation time, reduce repeat incidents, and move from inference-based RCA to evidence-based resolution.
This article breaks down the Root Cause Analysis tools engineers use today, explains where redeploy-driven approaches fall short, and compares AI SRE tools that can review system data, others that observe production context, and incident coordination systems.
What are Root Cause Analysis Tools?
Root cause analysis tools help engineering teams trace visible symptoms such as errors, incorrect outputs, or latency spikes back to the specific execution path, data condition, or runtime state that triggered the failure.
Rather than simply reporting that something broke, these tools help establish a clear causal chain explaining why it broke under real operating conditions.
In software systems, this means enabling engineers to connect logs, metrics, traces, and runtime context to the exact behavior that produced the incident.
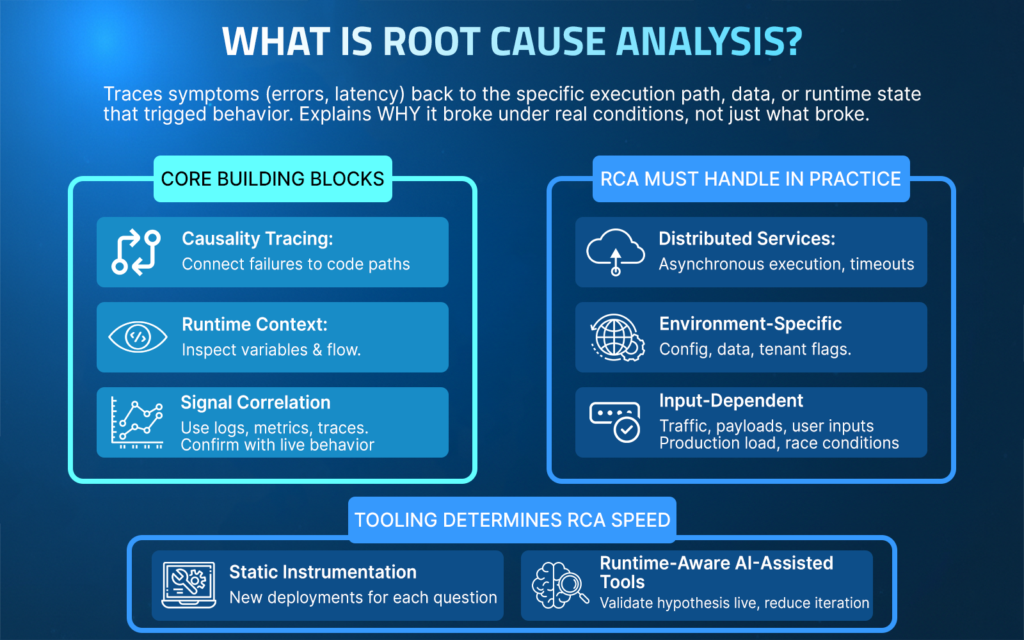
Core Building Blocks of Root Cause Analysis
- Causality tracing: Connect failures to specific code paths and executed conditions.
- Signal correlation: Use logs, metrics, and traces to narrow the investigation scope.
- Runtime context: Inspect variable values, branch outcomes, and execution flow at the exact point of failure under production conditions.
- Hypothesis validation: Confirm or reject the explanation using live behavior.
What Root Cause Analysis Must Handle in Practice?
Distributed services and asynchronous execution
A checkout request intermittently fails because a downstream inventory service times out only during traffic spikes. Traces show latency, but RCA requires identifying which retry path executed and which timeout threshold was crossed in that specific request flow.
Environment-specific configuration and data
A feature works in staging but fails in production because a configuration flag is enabled only for a subset of tenants. RCA depends on observing how runtime configuration and tenant-specific data influence code paths during execution.
Input and traffic-dependent behavior
An API returns incorrect results only for certain payload sizes or user inputs. The issue does not appear in tests because the failing input shape occurs only under real customer usage. RCA requires inspecting live variable values and branch decisions tied to those inputs.
Failures that cannot be reproduced locally
A memory spike or race condition occurs only under production load. Reproducing it locally is impractical, and adding static logs would require multiple redeployments. RCA depends on observing execution behavior directly in the running system.
Tooling determines RCA speed
When an investigation relies on static instrumentation, each new question can trigger another deployment cycle. Tools that provide live runtime inspection enable teams to quickly validate hypotheses against real execution behavior, reducing iteration time when failures occur in live conditions.
Top Root Cause Analysis Tools
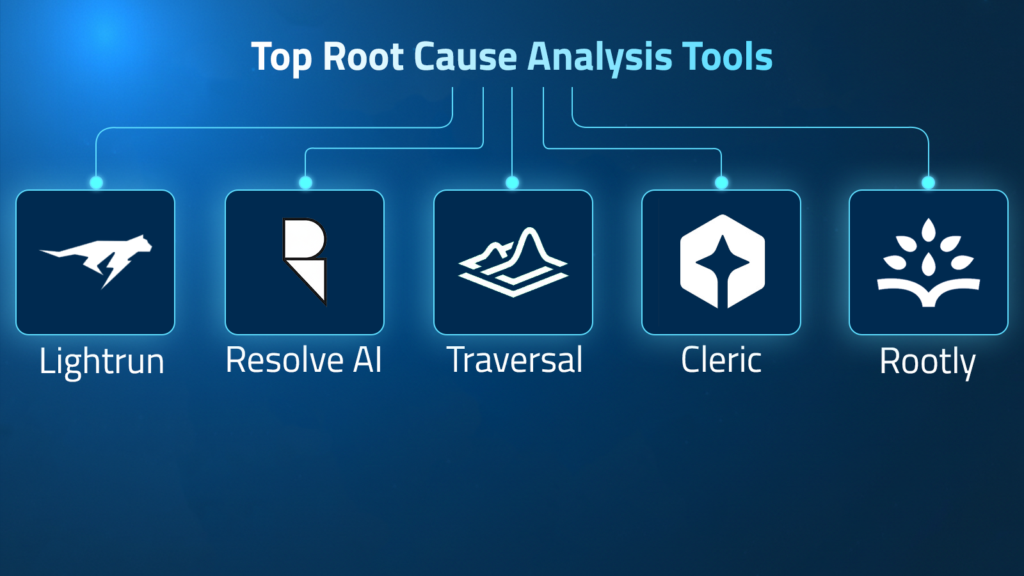
1. Lightrun AI SRE: AI-Native Reliability Engineering Across the SDLC Built on Live Runtime Context
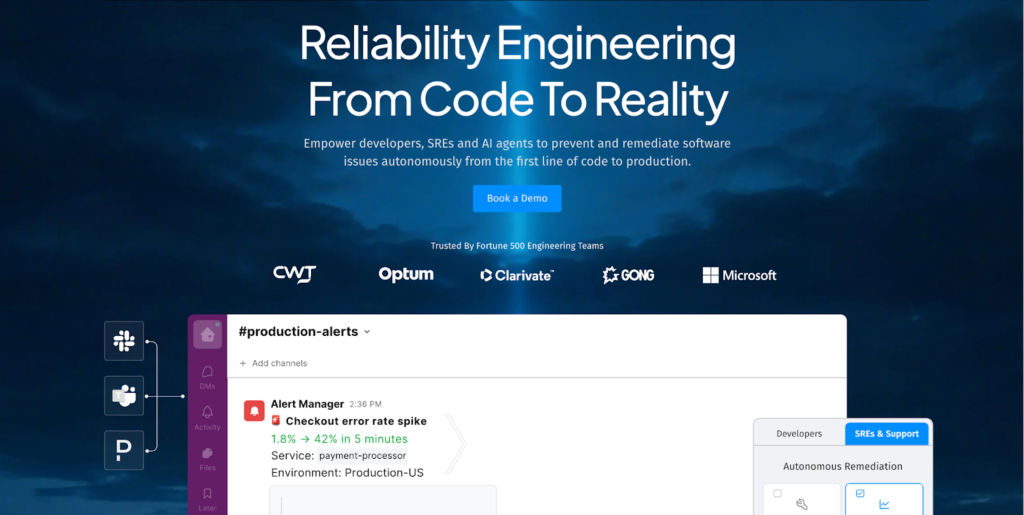
Lightrun brings Root Cause Analysis into the runtime.
Lightrun is an AI-native reliability engineering platform that enables engineers and SRE teams to diagnose and remediate software issues using live, in-line runtime context.
Instead of relying on preconfigured logs or inferred telemetry, Lightrun generates the missing runtime evidence needed to prove root causes against real execution behavior.
Lightrun’s AI SRE applies AI-driven diagnosis and remediation workflows across the SDLC from code design to production incidents, combining automated reasoning with direct observation of how code behaves under real traffic to accelerate the process of root cause analysis to verified remediation.
How Lightrun Integrates into the Engineering Workflow?
Lightrun adds production-safe, code-level visibility to running services through an attached agent and IDE plugins.
Lightrun supports flexible deployment models to match enterprise requirements:
- SaaS (Lightrun Cloud)
- On-Premises deployments
- Runtime deployments
To use Lightrun Runtime Context:
- Create a Lightrun account (Cloud or On-Prem deployment)
- Install the Lightrun IDE extension (for supported IDEs)
- Install the required Lightrun agent in the target service
To use Lightrun AI SRE
- Connect your tech stack (telemetry, source code, infra, and additional organization knowledge base tools)
- Install Lightrun agent as your telemetry provider
Lightrun can be accessed directly from IDEs, AI code agents, Slack, WebUI and other supported interfaces.
How Engineers Use Lightrun During Root Cause Analysis?
Runtime inspection starts directly from the code.
During a manual, automatic, or autonomous investigation, engineers, connected AI agents, and Lightrun AI SRE insert dynamic logs, snapshots, or metrics into running services at specific lines of code. These actions execute immediately against live traffic.
- Logs are emitted in real time from the selected execution path
- Snapshots capture the variable state and execution context
- Metrics are introduced on demand to observe behavior over time
All results are visible immediately, without rebuilding, redeploying, or restarting the application, and can be used to provide an evidence-based root cause determination
Production Safety and the Lightrun Sandbox
Lightrun enforces production-safe execution through a patented, secure, read-only sandbox.
Inserted actions run inside a sandboxed environment that:
- Enforces read-only behavior
- Prevents modification of application state
- Does not alter control flow
- Ensures inserted observability logic cannot mutate production data
This allows AI agents and engineers to generate runtime evidence safely during incidents without introducing side effects, altering application behavior, or creating meaningful performance overhead.
What Sets Lightrun Apart?
- On-demand runtime evidence: Gathers the necessary runtime information when a question arises, without paying the operational cost of pre-instrumenting everything upfront. This can be accessed by Lightrun AI SRE and other connected AI agents.
- Live behavior inspection: Observes execution paths, variables, and conditions under real runtime conditions
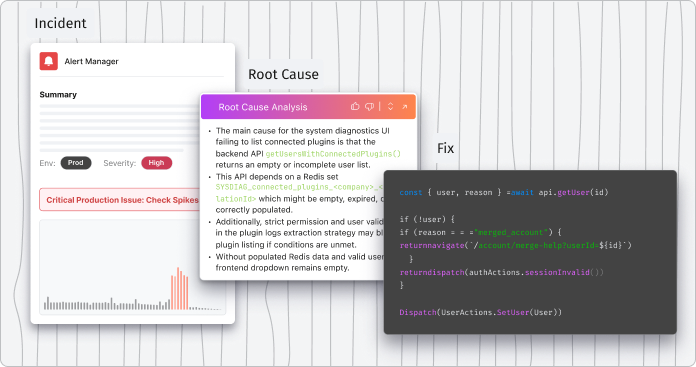
- Autonomous alert triage: When an incident occurs, Lightrun AI SRE gathers system data from telemetry, infrastructure, and codebase, and collects runtime context from the incident site to score issues by severity and determine team ownership.
- Proven Root causes: Lightrun analyzes data from connected tools, generates runtime evidence from running applications to verify the cause of the incident.
- Runtime-verified remediation: Lightrun proposes and validates fixes against live traffic. This ensures a code change will solve the problem and will not negatively impact downstream dependencies before it is committed to the repository.
- Zero redeploy loops: Eliminates rebuild–deploy cycles and supports a true shift-left workflow by allowing developers to investigate issues directly from their IDE and get immediate results.
- IDE, AI, and Slack-accessible workflows: Investigate from the environments engineers already use
- Safe production operation: Inspects running services without disrupting users
How Runtime Context Supports Engineering Reliability?
Runtime context replaces inference with evidence.
By grounding analysis in live execution behavior, Lightrun enables engineers and AI workflows to:
- Validate hypotheses against real runtime conditions
- Prove root causes with evidence instead of inferring them from incomplete telemetry
- Confirm fixes against live behavior before rollout
This approach shortens RCA cycles, reduces the number of repeat incidents, and shifts reliability work from reactive guesswork to evidence-based engineering.
How MCP Extends Lightrun’s Runtime Context?
Lightrun also exposes runtime context through the Model Context Protocol (MCP).
By making live execution data available via MCP, Lightrun allows AI code assistants and agents to reason over the same runtime evidence engineers use during investigations.
This enables:
- AI agents to ground recommendations in real execution behavior, not static code alone
- Safer AI-assisted diagnosis and remediation during incidents
- Shared context between engineers, AI SRE workflows, and AI coding tools
MCP does not replace human investigation. It extends runtime context for AI systems, ensuring that automated reasoning is anchored in what actually happened within the running application.
2. Resolve AI: AI-Driven Incident Triage and Root Cause Analysis
Resolve AI acts as an always-on AI Site Reliability Engineer for production systems.
Resolve AI is an agentic platform that autonomously triages alerts, investigates incidents, and drives Root Cause Analysis using real production context across code, infrastructure, and telemetry.
Rather than being a passive dashboard or manual query tool, Resolve AI continuously monitors systems, correlates signals, and generates evidence-backed explanations of incidents in minutes.
How Resolve AI supports Root Cause Analysis
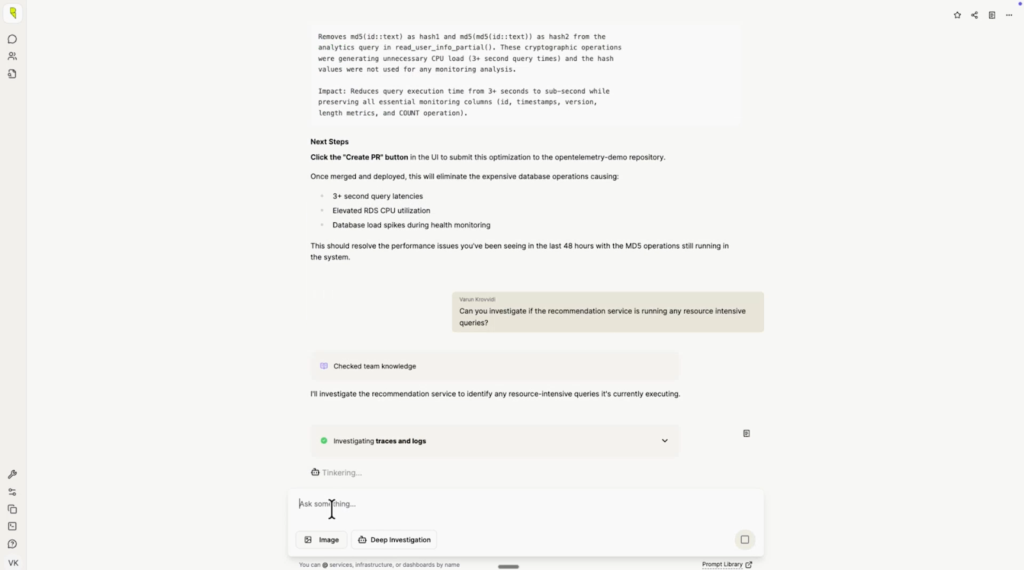
- Autonomous alert triage: Resolve AI ingests alerts from telemetry, correlates related signals, clusters noise, and ranks issues by severity and business impact without manual filtering.
- Parallel hypothesis investigation: The platform plans investigations by reasoning over code, infrastructure state, and observability signals, pursuing multiple hypotheses simultaneously.
- Evidence-backed RCA: Resolve AI analyzes data from connected tools, constructs production context, and surfaces root causes with timelines and supporting evidence.
- Knowledge graph and continuous learning: By building an internal representation of system relationships and past incidents, Resolve AI refines its understanding over time, reducing toil and accelerating future incident resolution.
- Remediation recommendations: The platform can recommend specific fixes based on findings, including code or configuration changes to address the identified root issues.
Where Resolve AI is Less Effective for RCA
- No direct live runtime instrumentation: Resolve AI does not attach to application runtimes to capture variable state or execution paths, as runtime-aware platforms do.
- Root Cause Analysis leverages existing telemetry only: Its root cause narratives and evidence depend on logs, traces, infrastructure state, and integrated telemetry rather than injecting new context into running services.
Resolve AI is well-suited for teams that need to reduce incident noise, automate early triage, and rapidly narrow down likely causes across large, distributed environments. It excels at making sense of diverse signals and surfacing actionable root cause explanations faster than manual investigation alone.
3. Traversal: Automated Signal Correlation for Root Cause Analysis
Traversal acts as an AI SRE agent that surfaces probable causes of incidents.
Traversal uses machine learning to correlate signals across complex telemetry sources and guide engineering teams toward likely points of failure. It emphasizes autonomous incident investigation outcomes by reducing alert noise and highlighting patterns that indicate how issues propagate across services.
How Traversal Supports Root Cause Analysis?
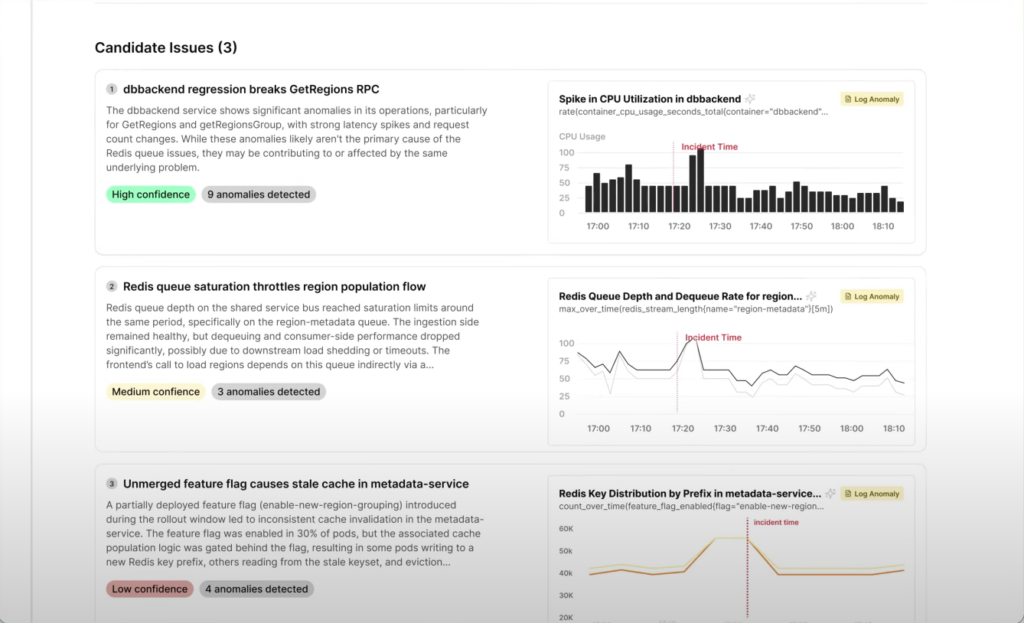
- Alert noise reduction: Traversal automatically clusters and filters alerts so teams spend less time sifting through unrelated signals.
- Cross-signal correlation: The platform correlates logs, metrics, traces, and incident data to identify relationships between symptoms and potential root causes.
- Dependency awareness: Traversal surfaces how issues can cascade across services and components in distributed environments, helping teams understand how failures propagate.
- Confidence-ranked insights: AI workflows help prioritize likely root causes so engineers can focus first on the most probable explanations.
Where Traversal is Less Effective for RCA
- Telemetry-driven diagnosis: RCA insights depend on the quality and coverage of pre-existing observability signals; missing or sparse telemetry limits conclusions.
- No direct runtime code inspection: Traversal does not attach to running application code to capture live execution state or variable values directly as the runtime context changes.
Traversal is well-suited for teams that manage large, distributed systems with heterogeneous telemetry sources and need faster, AI-assisted RCA that reduces noise and guides investigation paths. It helps prioritize where engineers should look, but for root causes tied to specific code execution details, runtime inspection tools may still be needed.
4. Cleric: Knowledge-Driven Incident Investigation
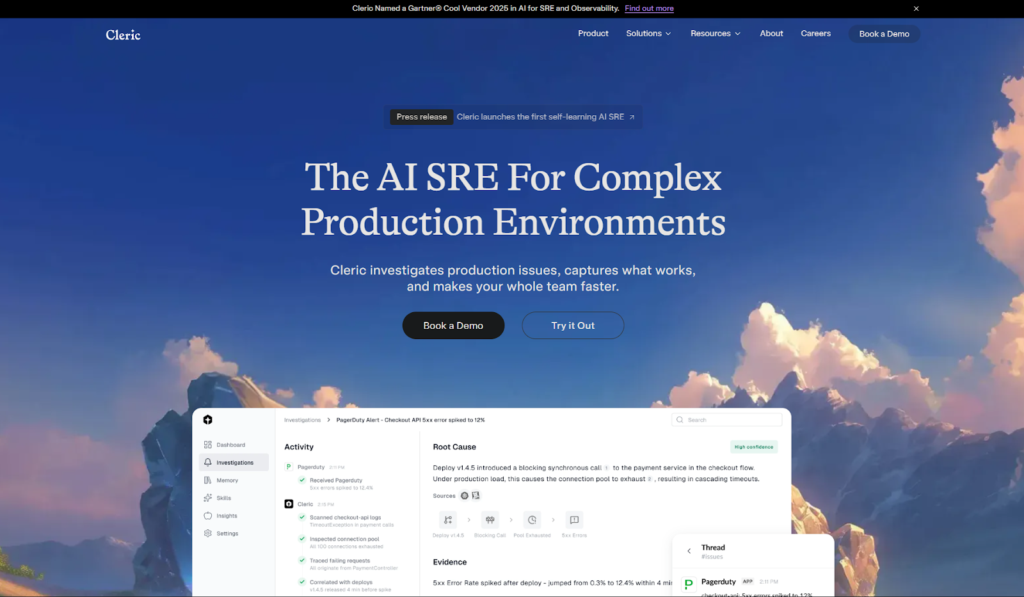
Cleric acts as an autonomous AI site reliability engineer that reasons like an experienced practitioner.
Cleric continuously investigates alerts and incidents across production systems, correlating telemetry, infrastructure state, and historical context to diagnose root causes. It delivers evidence-backed summaries directly to teams in tools like Slack, reducing friction during investigations and capturing operational knowledge for future use.
How Cleric Supports Root Cause Analysis?
- Autonomous investigation from the moment an alert fires: Cleric begins its analysis immediately, correlating signals without manual triggering.
- Hypothesis-driven reasoning: It forms and tests multiple hypotheses in parallel, examining logs, metrics, event triggers, and system dependencies to isolate probable root causes.
- Real-time system mapping: By ingesting telemetry, infrastructure state, and observability data, Cleric builds a live model of service relationships and failure modes.
- Contextual, explainable diagnoses: Cleric delivers results with evidence and reasoning, enabling engineers to understand not just what happened but why it happened.
- Continuous learning: Every investigation adds to Cleric’s operational memory, allowing patterns discovered in past incidents to inform future analyses.
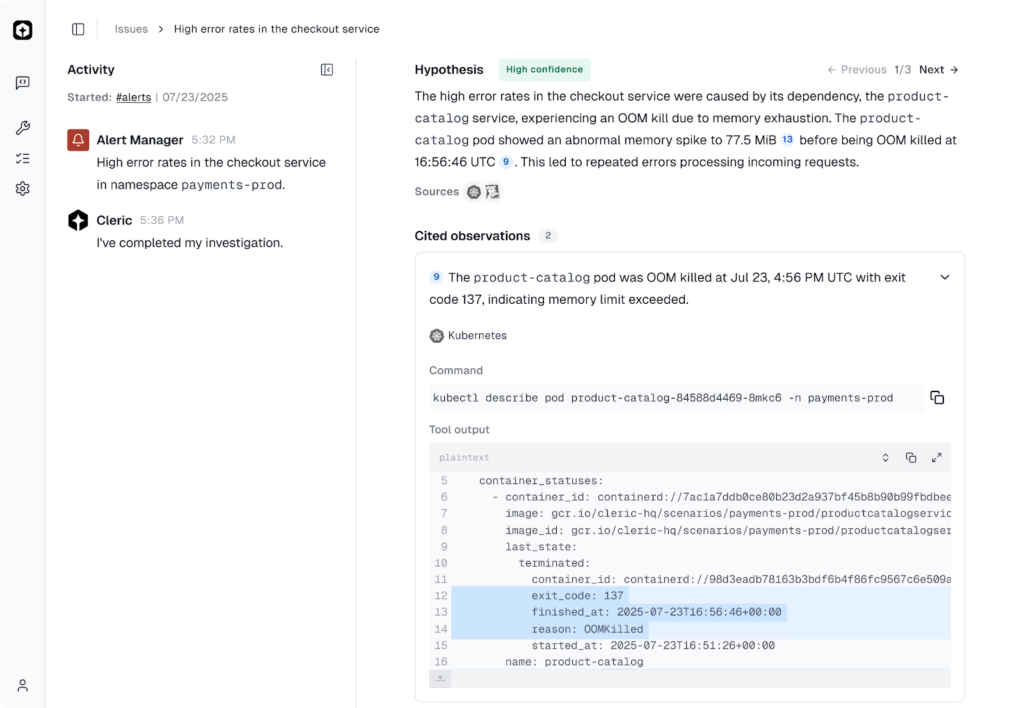
For example, when a checkout service starts throwing 5xx errors after a deploy, Cleric can correlate the deployment timing with changes in underlying dependencies, cluster health, or configuration variables, and summarize the probable cause with supporting evidence in minutes.
Where Cleric is Less Effective for RCA?
- No direct runtime attachment: Cleric does not instrument or inspect runtime execution paths inside the application code itself. It reasons over the signals available through observability and infrastructure tools.
- Signal dependency: Its diagnoses rely on the quality and breadth of telemetry and system data that already exist in your stack.
Cleric is particularly useful in environments where alert volume and noise make it difficult for human teams to quickly triage and diagnose issues. It reduces cognitive load by turning raw signals into actionable explanations, allowing engineers to spend more time solving problems and less time gathering context.
5. Rootly: Incident-Centered RCA Coordination
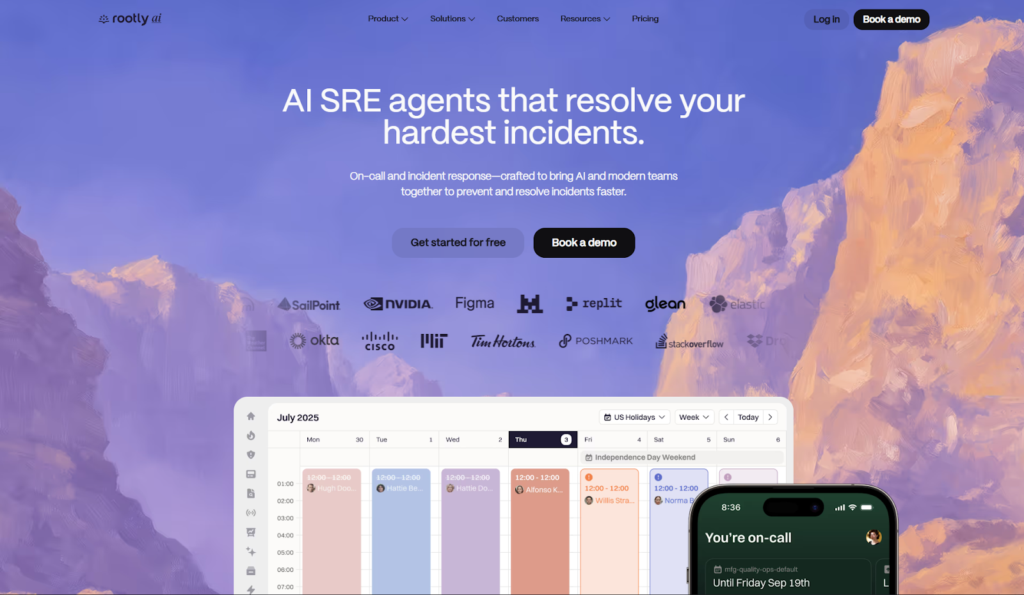
Rootly is an incident management platform for incident response and RCA.
Rootly is an incident management platform designed to help engineering teams coordinate, document, and learn from incidents. Rather than analyzing application behavior or telemetry itself, Rootly focuses on structuring how incidents are declared, managed, and followed through, ensuring that Root Cause Analysis outcomes translate into concrete actions.
How Rootly Supports Root Cause Analysis?
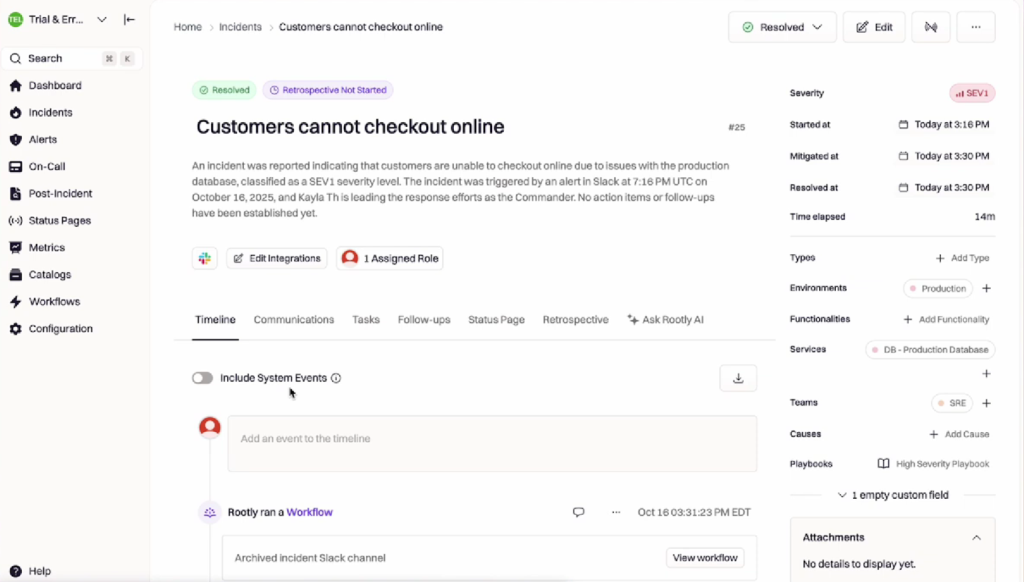
- Incident orchestration: Standardizes how incidents are created, escalated, and resolved across teams using predefined workflows.
- Clear ownership and accountability: Assigns incident roles, responders, reviewers, and follow-up owners explicitly to avoid ambiguity during and after incidents.
- Post-incident reviews: Captures timelines, contributing factors, root causes, and action items in a consistent postmortem format.
- Workflow integration: Integrates with tools like Slack, Jira, PagerDuty, and observability platforms to centralize incident context and outcomes.
- Process enforcement: Ensures RCA findings lead to tracked remediation work rather than getting lost after resolution.
Where Rootly is Less Effective for RCA?
- No technical root cause detection: Rootly does not analyze logs, metrics, traces, or runtime behavior to determine why a failure occurred.
- Dependency on external tools: Root cause identification relies on observability platforms, or AI SRE systems, feeding technical findings into the incident workflow.
Rootly is especially valuable for teams that struggle with coordination, consistency, and follow-through during incidents. It complements technical RCA tools by organizing investigation outputs and enforcing accountability, but it depends on other platforms to supply the runtime or telemetry evidence needed to identify root causes in the first place.
What to Look for in Root Cause Analysis Tools?
Effective Root Cause Analysis tools reduce uncertainty inside live systems.
When failures occur in production, the difference between rapid resolution and prolonged impact often comes down to whether engineers can access the right context at the right time. The most useful RCA tools shorten investigation loops by supporting real investigation scenarios, not idealized workflows.
What are the Capabilities Required for RCA?
Runtime Context Without Redeployments
A request fails only for a specific customer flow. Engineers need to inspect how a conditional branch behaves in production without rebuilding and redeploying services just to add temporary logs.
Code-Level Insight
A service returns incorrect data even though system metrics look healthy. RCA requires visibility into which code paths executed and how variables were evaluated, not just aggregate error rates or latency graphs.
Fast Hypothesis Validation
An engineer suspects a race condition or edge-case input. They need to test that explanation immediately while the issue is active, rather than waiting for the next deployment cycle to confirm or reject it.
Safe Production Instrumentation
A memory spike occurs under load, but stopping or restarting the service is not an option. RCA tools must collect additional context without pausing execution or impacting users.
Engineer-First Workflows
During an incident, engineers work from IDEs, terminals, and incident tools, not dashboards alone. RCA tools that integrate directly into these workflows reduce context switching and speed up investigation.
AI-Assisted Triage and Signal Correlation
An incident generates hundreds of alerts and signals. AI can help summarize what changed, correlate related signals, and suggest likely areas to investigate, while engineers retain control over validation and decision-making.
These capabilities separate tools that simply report symptoms from tools that help engineers explain failures under real operating conditions. With this lens, the distinction between runtime-context platforms and telemetry-first systems becomes clear.
How These Root Cause Analysis Tools Compare?
Different tools support different stages and layers of Root Cause Analysis.
Some generate new runtime evidence, others reason over existing telemetry, and others coordinate incident workflows. The distinction is not binary; it concerns where insight originates and how investigation progresses.
| Tools | Investigation Model | Source of Insight | Best Suited For | Depth of Code-Level Context | Primary RCA Role |
| Lightrun | Autonomous AI SRE reasoning and investigation +Runtime context collection | Live execution data generated on demand via agent + sandbox | Proving root causes inside running services by observing actual behavior | Full execution path, variable state, and branch-level visibility | Generates runtime evidence to prove root causes in live execution |
| Resolve AI | Autonomous AI SRE investigation | Correlated telemetry, infra state, alerts + historical incident context | Rapid end-to-end incident triage and root cause reasoning across systems | Indirect (telemetry only, no direct runtime instrumentation) | Incident triage and AI-driven RCA reasoning |
| Traversal | Machine learning–driven signal correlation | Observability signals (logs, traces, metrics) correlated across services | Noise reduction and cross-service pattern discovery in large environments | Limited, telemetry-level relationships only | Signal correlation and probable cause ranking |
| Cleric | Autonomous hypothesis-driven AI investigation | Telemetry + infrastructure state + historical incident memory | Evidence-backed incident summaries, recurring issue detection | Indirect (no runtime attachment to code) | Autonomous investigation using existing system data |
| Rootly | Workflow orchestration + documentation | Incident process data + integrated observability & workflows | Structured incident management, postmortem capture, accountability | None (process layer only) | RCA coordination and follow-through |
How to Read this Comparison?
- Investigation model
Describes how the tool approaches root cause analysis, whether by generating runtime evidence, reasoning over existing telemetry, or structuring incident workflows.
- Source of insight
Clarifies whether the tool creates new production evidence or analyzes signals that were already collected by observability systems.
- Depth of code-level context
Indicates whether engineers can inspect execution paths and variable state directly, or whether analysis remains limited to service-level telemetry.
- Primary RCA role
Highlights the part of the RCA lifecycle the tool owns: evidence generation, AI reasoning, signal correlation, or incident coordination.
Choosing the Right Root Cause Analysis Tool for Your Team
Tool choice depends on where Root Cause Analysis breaks down in your workflow.
Teams rarely struggle with the same part of RCA. Some lose time making sense of alerts, others during investigation, and others when trying to prove a hypothesis against real system behavior.
How to Align Tools With Your RCA Gaps?
- If triage is slow: AI SRE platforms help reduce alert noise, correlate signals, and summarize incidents so teams can identify where to focus their investigation sooner.
- If investigation stalls: Runtime-context platforms enable engineers to inspect execution paths, state, and conditions directly inside live systems, turning assumptions into evidence.
- If coordination breaks down: Incident management platforms ensure that ownership, timelines, and follow-up actions are clearly defined, so that RCA results lead to concrete remediation.
- If issues repeat: Knowledge-driven systems capture investigation outcomes and patterns, reducing rediscovery of known failure modes across incidents.
- Teams handling complex production failures often combine these approaches. AI SRE tools accelerate understanding at the incident level, while runtime-context platforms enable precise root cause validation when failures depend on live execution behavior.
The Cost of Redeploy-Driven Root Cause Analysis
Redeploy-driven instrumentation remains the biggest bottleneck in RCA workflows.
Most teams still investigate failures by adding logs or metrics, rebuilding services, and waiting for new deployments to reach production. This approach assumes engineers can predict where the failure will occur before they have enough runtime context to know what to inspect.
Where Redeploy-Driven RCA Breaks Down?
- Slow feedback loops: Each instrumentation change depends on CI/CD pipelines and rollout timing.
- Instrumentation guesswork: Logs are added based on assumptions, not observed execution paths.
- Missed execution context: The critical branch or data condition may never be captured.
- Repeated iterations: Multiple redeploys are often required before the real cause becomes visible.
How Does This Harm Incident Resolution?
- Production issues continue while teams wait for new builds.
- Partial signals lead to false conclusions and rework.
- Engineers spend more time preparing instrumentation than analyzing behavior.
Even with mature observability stacks in place, teams often lack on-demand runtime insight when failures emerge.
The 2025 State of AI-Assisted Software Development report (DORA/Google Cloud) continues to highlight recovery time and operational performance as key differentiators between high and low-performing teams. Investigation workflows that rely on repeated instrumentation cycles directly impact Mean Time to Restore (MTTR), prolonging customer impact.
Conclusion: Root Cause Analysis Works Best Inside the Runtime
Engineering reliability depends on evidence from real execution, not inference.
As systems become more distributed and input-dependent, failures increasingly hinge on conditions that only exist under real traffic and real data. Root cause analysis based solely on predefined telemetry or post-incident reconstruction often misses the behavior that actually triggered the issue.
AI SRE platforms improve triage, coordination, and learning by reasoning over existing signals. Runtime-context platforms complement them by generating missing evidence directly from live execution, without disrupting running systems.
Together, these approaches shorten investigation cycles, reduce repeat incidents, and make Root Cause Analysis more reliable in production environments.
FAQs about Root Cause Analysis Tools
Root cause analysis typically involves identifying the problem, collecting evidence, forming hypotheses, validating those hypotheses, and implementing corrective actions. In software systems, validation often requires observing runtime behavior rather than relying solely on logs or metrics.
Runtime context reveals how code behaved under real conditions, including execution paths and data states that may not appear in test environments. Without it, teams rely on assumptions that slow investigation.
Common mistakes include over-reliance on static logs, premature conclusions without validation, and treating symptoms as causes. These issues often lead to repeated incidents.
Observability platforms surface signals across systems, while Root Cause Analysis tools focus on explaining why a specific failure occurred. Many teams use observability to narrow the scope and RCA tools to confirm causes.