How to Debug Remotely in VS Code
Aug 15, 2021 / Updated: Mar 10, 2026

You’re likely familiar with local debugging — the ability to go through your code line by line to find and eliminate bugs. However, with the ever-increasing complexity of development environments, working efficiently with remote systems is becoming more necessary. In this case, “remote” can mean any machine you don’t have native OS-level access to, such as Virtual Machines, Docker containers, and entirely separate devices accessed over the network.
With remote debugging, you can work with these systems more effectively by connecting your development tools to an application running outside your local environment. In this article, you’ll learn how to configure Visual Studio Code (a.k.a. VS Code) for remote debugging by using the powerful remote development extensions it offers.
(Note that we also have tutorials on Python remote debugging in VS Code and remote debugging in IntelliJ IDEA.)
Why Remote Debugging?
Debugging is a fact of life for developers, and having the ability to debug effectively in your environment of choice is crucial to a productive workflow. There are a multitude of reasons you might want to delve into remote development, and if you do, having usable debugging tools is a must.
Docker remote debugging
A common use case for remote development is when working with Docker containers. It can be beneficial to connect to the code running inside the container to debug your applications directly, rather than debug locally when you run the code in the container.
The Docker container is tailor-made to run your application, and likely reflects the environment it will use in production, so debugging directly in the Docker container offers some advantages. In addition, this method eliminates a good deal of the uncertainty that can arise when debugging and executing code in different environments and allows you to focus on the code rather than the various environmental dependencies that could be affecting it.
Windows Subsystem for Linux (WSL)
Another increasingly popular option that can be considered remote development is for developers using Windows machines who want to use WSL as their primary development environment. WSL lets you run Unix-based tools and command-line applications on Windows. VS Code’s remote development capability gives you the benefits of running a Unix environment without sacrificing the Windows OS you might be used to.
Historically, the integration between WSL and the host OS had been a bit spotty, making tasks like debugging harder than they needed to be. Due to significant improvements in WSL (and VS Code’s extensions for remote development), this is no longer the case.
Remote Hosts (SSH)
The third use case for VS Code’s remote development functionality is working with remote hosts via SSH. SSH secures software from supply chain attacks by enabling network security for remote applications. Doing so means that you can take advantage of more powerful hardware for working on beefier applications. You can also use a cloud-based workstation or remotely connect to your office development machine from your home workstation while being able to debug with ease.
How to Use Remote Debugging in VS Code
To debug your application through VS Code’s remote development utilities, you will first need to set up and configure your desired mode of remote development. Each of the three types listed above is available as a separate extension for VS Code. You can also get access to all three by installing the remote development extension pack.
VS Code Remote Debugging: Docker
Remote development with Docker containers requires that you have Docker installed on your device and some code (and a Dockerfile) ready to be containerized. For this guide, you can clone one of Microsoft’s sample projects created to demonstrate remote development. Clone this repository to your local machine.
Open VS Code and make sure that you have the Remote – Containers extension installed. Installing any of the remote extensions will add a new icon to the left-hand navbar.
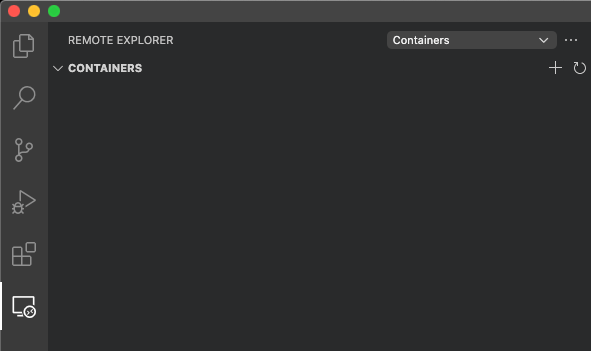
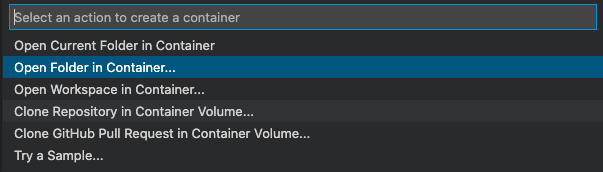
Click on this new icon, and you will see Remote Explorer. Listed here are all your running containers as well as any dev containers—that is, a container with the VS Code server installed on it. Click on the + icon and select Open folder in container, choosing the repository you cloned in the previous step.
This will prompt VS Code to build a Docker image based on this repository and instantiate a container from it. Once the container has been created, VS Code will install the VS Code Server in the container and then connect your editor to this remote code server, allowing you to use the full functionality of VS Code, right inside the running Docker container.
VS Code Remote Debugging: WSL
Setting up VS Code remote debugging with Windows Subsystem for Linux is simple if you have WSL installed already. At the time of this article, WSL is undergoing a lot of changes, and the latest versions are only available in Windows Insider builds. It is still possible to use WSL without an Insider build, but the installation is slightly more involved. Your best bet is to refer to the official Microsoft documentation for the most up-to-date guide on setting up WSL in Windows.
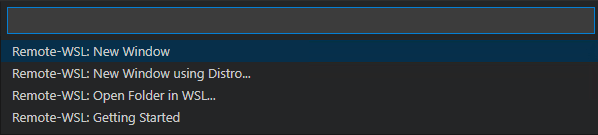
Once you have WSL set up and working, you can install the WSL extension for VS Code. After installing, when you click on the Remote Development icon in the bottom left corner of your editor, you will see a number of executable commands. Among these are Remote-WSL: New Window and Remote-WSL: Open folder in WSL. Either is a good option if you want to get in and try it out, but for now, go with New Window.
This will prompt WSL to install the VS Code Server into its Linux environment. Once it is done, your editor will connect, and you will be able to open files and folders from the WSL environment as if they were local. Because your WSL instance is persistent, you can install tools and create files without having to worry about them getting lost.
Although remote development with Docker containers is also persistent, this is achieved by using volumes that are easy to destroy during cleanup and maintenance if you are not careful. So if your host OS is Windows and you’ve been missing the benefits appreciated by Linux and Mac users, remote development with WSL may be an enticing option.
VS Code Remote Debugging: SSH
Using SSH for remote development means you can run an application on another machine, allowing you to take advantage of the remote host’s hardware and resources.
To try out this remote development form, you will need another device, such as another laptop/desktop, a virtual machine, or even a cloud machine, like an AWS EC2 instance or Azure VM.
First, set up SSH on the remote host. The way of doing this varies between operating systems, but here you can find examples for Ubuntu, Windows, and macOS.
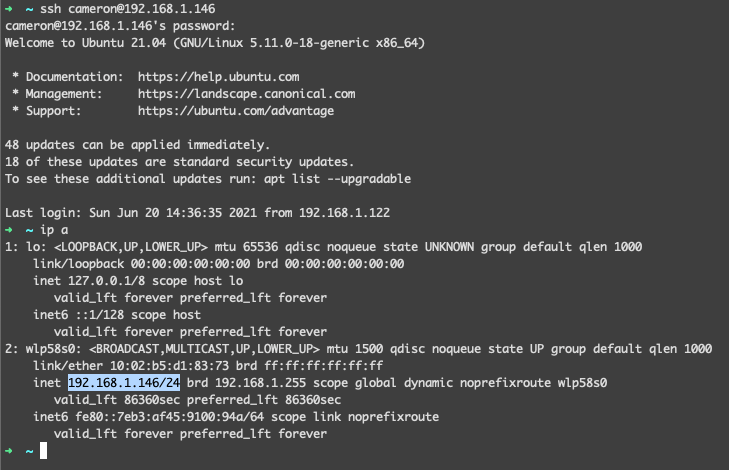
Once you’ve enabled the SSH server on your remote host, you will need an IP address with which to access it. For machines on your local network, you can use the local IP address, and the process should be simple enough. For remote devices, like Cloud VMs or remote workstations, you will need a more advanced configuration depending on your exact network setup. As there are too many different network configurations to cover, this example will assume the machine is on the local network.
It’s a good idea to try to SSH into the desired remote host the usual way using the ssh command to make sure that it is working as expected. This way, you can rule out connectivity issues before configuring the VS Code extension.
Once you have confirmed that SSH is working properly, install the Remote – SSH extension for VS Code. This extension behaves similarly to Remote – Containers. After it is installed, you can find the new functionality in the Remote Development sidebar. Go to the sidebar, and from the Remote Explorer dropdown, make sure you have SSH Targets selected. You will see a list of all your configured SSH targets. If this is your first time, the list should be empty. Click the + next to SSH Targets, and you’ll be prompted for your SSH connection details.
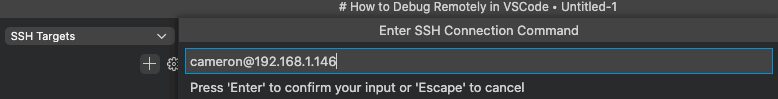
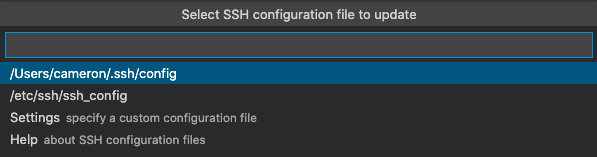
Enter your desired username and host here and follow the prompts. You may be asked which SSH config you’d like to use (the default is fine unless you know you need a different one) and for the password for the connection.
After you provide these details, the host will download the VS Code Server, and your editor will connect once the download is complete. When this is done, you will be able to select a directory to load and edit code as if it were on your local machine.
VS Code Remote Debugging: The Debugging Workflow
Once your editor is connected—no matter which of the above methods you are using—you can work with and debug the code running in the container the same way you would on your local machine.
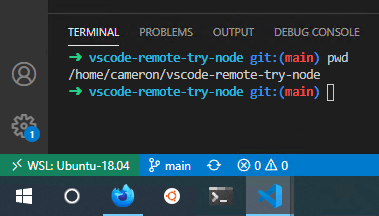
For this guide, you can try the vscode-remote-try-node repo mentioned earlier. This will allow you to take advantage of VS Code’s built-in Node debugger. You can try some of the other “remote-try” repos but might have to configure additional debugging and language support extensions.
It is worth noting that while you are connected to a remote development environment, the remote code server will install any extensions you activate rather than your local instance of VS Code. This means that these extensions will always be available on that remote host, but your local extensions will not automatically be available for use.
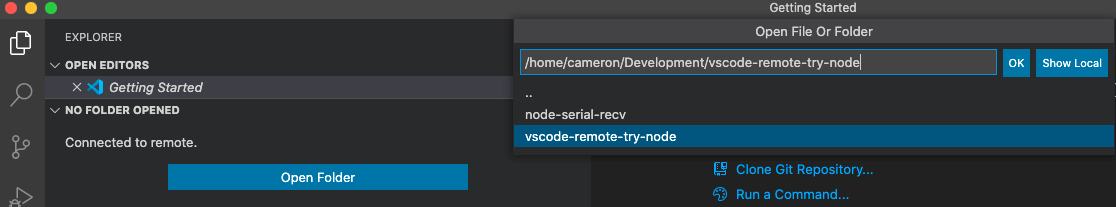
To debug this repo, you will need to choose your preferred remote development form and make the repo available in that environment. If you use WSL or SSH, just connect to the remote environment and then use the Git CLI client from VS Code’s integrated terminal to clone the repository straight into the remote environment. If you would prefer to try the container option, you can clone the repo onto your local machine and use the “Open folder in container” approach described above to have the extension set everything up for you.
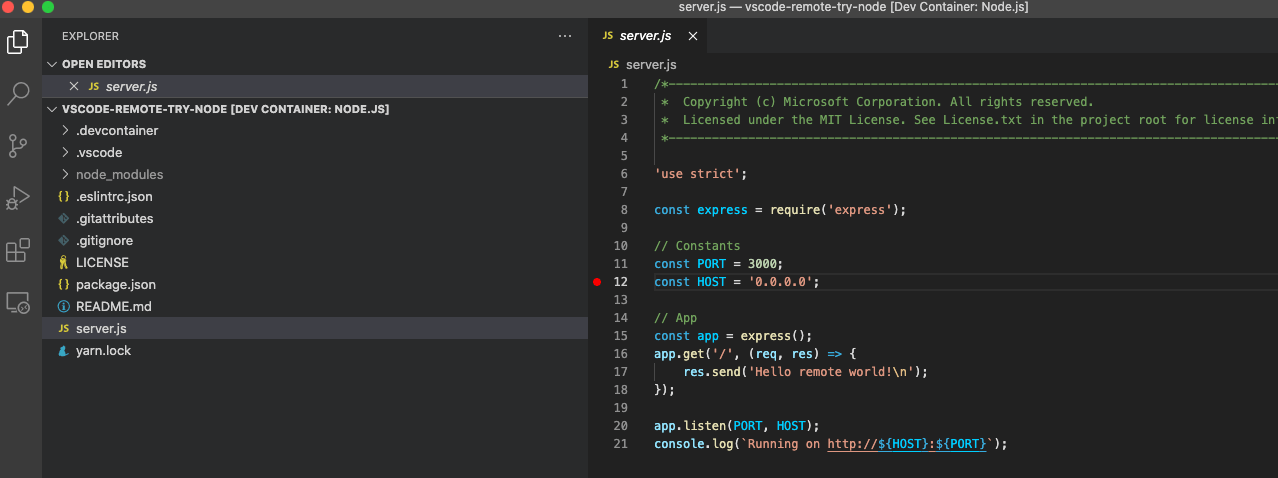
Once you are connected to your remote environment of choice, make sure you have the repository directory open in your VS Code workspace, then open up the server.js file. Set a breakpoint on the line you want to inspect in the debugger. The declaration of the PORT variable is an excellent place to start.
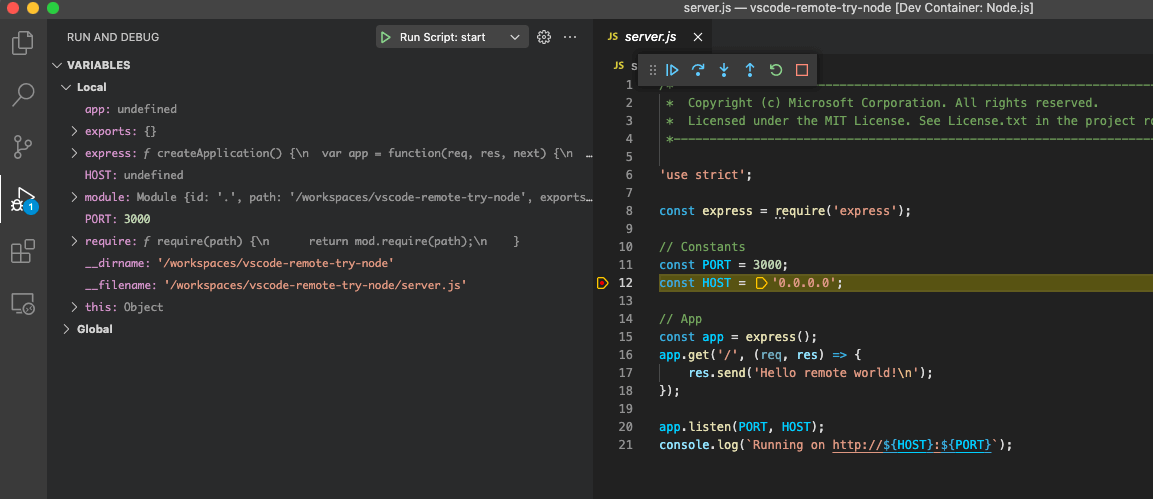
Next, go to the Run and Debug menu in the sidebar and select Run script: start. This will execute the application in the remote environment and attach the Node debugger. Once the code reaches your breakpoint, execution will be paused as expected, and you will be able to inspect the state of the application running on the remote host.
If you’ve done much local debugging in the past, you will know the drill from here. Most of your experience with local debugging should carry across 1:1, and this method should work with most programming languages and frameworks. If it is supported in VS Code locally, there is no reason it shouldn’t work via remote development.
Conclusion
Now that you’ve configured and tried out remote development with VS Code, your mind is likely racing with possibilities.
So let’s simplify. You can debug remotely in VS Code using Lightrun. Lightrun will allow you to add logs, metrics and traces to production and staging — directly from your IDE or CLI — in real-time and on-demand. You can create your Lightrun account and start now –>.