Developer Observability Platform

Dynamically instrument logs, traces, and metrics to get real-time insights into the behavior of your live applications at runtime straight from your IDE. No code changes, redeployments, or restarts are needed.

Development workflow


Play with Lightrun

Lightrun Unveils the industry’s first ✨GenAI Runtime Autonomous Debugger✨ Access our Private Beta!

Lightrun is trusted and loved by developers globally
Automation Anywhere
Microsoft
Taboola
Chubb Rain & Hail
Lightrun

Developers Use Lightrun
For

Lightrun works in the cloud, on-premise and everywhere in between. We run where you run.


Debug 🆆🅾🆁🅳🅻🅴 with Lightrun >
Lightrun is trusted and loved by developers globally
Automation Anywhere
Microsoft
Taboola
Chubb Rain & Hail

Developers & Engineering Leaders Choose Lightrun To


Slash MTTR by 60%
Slash MTTR 

by 60%
Cut logging costs
Cut Logging Costs by 40%
Boost developer productivity
5X Boost Dev Productivity
Reduce time to market
Reduce Time 

to Market
Improve your DORA metrics
Lightrun is trusted and loved by developers globally
Automation Anywhere
Microsoft
Taboola
Chubb Rain & Hail
Developer Observability
Solutions
Benefits

Missing visibility at runtime?

code, stage, commit, push, open PR, build, test,
wait for approval,deploy, invoke, open dashboard, filter,

Dynamically Instrument, Observe.

How Lightrun Works

Securely inject logs, metrics and traces in real time while the process is running. Debug monoliths, microservices, K8s, CI, serverless, and more from your IDE.

  • Lightrun requires no source
    code access

  • No code, only metadata,
    passes through the server

  • Lightrun is runtime-based, and runs
    where you run at any scale

Choose your IDE

No code, only metadata, passes through the server.

  • VS Code
    VSCode
  • JetBrains
    JetBrains
  • Visual Studio

Choose where you need more visibility: your code, legacy code, 3rd party code – you name it, we instrument it.

Lightrun in VSCode

Instrument everything in real-time, without stopping the live application: one click in the IDE, and your live app is instrumented in a read-only, secure fashion.

Lightrun plugin in VS Code
I counted 45 primes so fa

Observe the information immediately: see it right in the IDE or in one of our 30+ observability integrations.

Lightrun plugin in VS Code
I counted 45 primes so fa
  • Lightrun in VSCode
  • Lightrun plugin in VS Code
    Lightrun management server
    • I counted 181 primes so far
      • Google Cloud
      • AWS
      • Azure
    • I counted 45 primes so far
      • Kubernetes
    • I counted 15 primes so far
      • Docker
  • Lightrun plugin in VS Code
    • Elastic
    • Datadog
    • Grafana
    • Slack
    • StatsD
    • Dynatrace
    • Prometheus
    • Sentry
    • New Relic
    • fluentd

Choose where you need more visibility: your code, legacy code, 3rd party code – you name it, we instrument it.

Lightrun plugin in IntelliJ IDEA

Instrument everything in real-time, without stopping the live application: one click in the IDE, and your live app is instrumented in a read-only, secure fashion.

Adding a Lightrun log in IntelliJ IDEA
I counted 45 primes so fa

Observe the information immediately: see it right in the IDE or in one of our 30+ observability integrations.

Observability in IntelliJ IDEA with Lightrun
I counted 45 primes so fa
  • Lightrun plugin in IntelliJ IDEA
  • Adding a Lightrun log in IntelliJ IDEA
    Lightrun management server
    • I counted 181 primes so far
      • Google Cloud
      • AWS
      • Azure
    • I counted 45 primes so far
      • Kubernetes
    • I counted 15 primes so far
      • Docker
  • Observability in IntelliJ IDEA with Lightrun
    • Elastic
    • Datadog
    • Grafana
    • Slack
    • StatsD
    • Dynatrace
    • Prometheus
    • Sentry
    • New Relic
    • fluentd

Choose where you need more visibility: your code, legacy code, 3rd party code – you name it, we instrument it.

Instrument everything in real-time, without stopping the live application: one click in the IDE, and your live app is instrumented in a read-only, secure fashion.

I counted 45 primes so fa

Observe the information immediately: see it right in the IDE or in one of our 30+ observability integrations.

I counted 45 primes so fa
  • Lightrun management server
    • I counted 181 primes so far
      • Google Cloud
      • AWS
      • Azure
    • I counted 45 primes so far
      • Kubernetes
    • I counted 15 primes so far
      • Docker
    • Elastic
    • Datadog
    • Grafana
    • Slack
    • StatsD
    • Dynatrace
    • Prometheus
    • Sentry
    • New Relic
    • fluentd

Use Cases

Use cases

Live debugging in production

Capture context in real-time, without stopping execution, with visibility down to the single line.

Use cases

Troubleshoot cloud-native applications

Get visibility across replicas, regions, or entire clouds.

Use cases

Troubleshoot broken CI

Re-running jobs to fix them can be a thing of the past.

Use cases

Understand codeflow and code behavior in production

Enlighten the code path your users take through the app.

Use cases

Validate progressive delivery / feature flags

Traverse complex, conditional paths to understand what really happened.

Use cases

Troubleshoot serverless applications

Break apart issues in function-based workloads, one lambda at a time.

Reduce logging cost

Reduce logging costs

Get deep context within your data to figure out logic and quality issues.

Use cases

Performance analysis and investigation

Break apart performance bottlenecks on the application level.
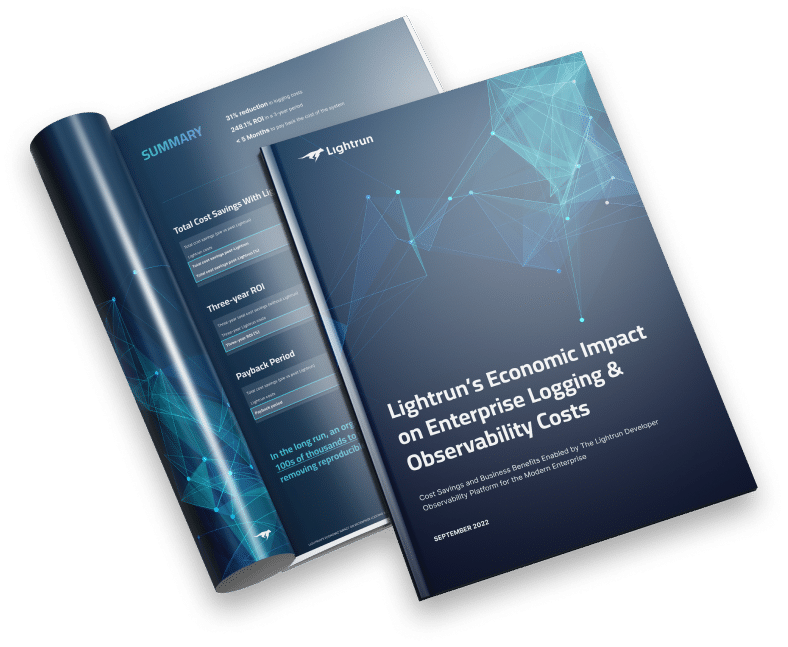
Economic impact on enterprise logging and observability costs

Lightrun’s platform delivers 763% ROI and $5.62M NPV over a three-year period. Read Lightrun’s economic impact study below!

Get our deep research into the economic impact of using a developer observability platform in major engineering organisations, in which you will learn how Lightrun has:

  • Saved $3.87M via developer productivity improvements
  • Increased revenue by $1.64M due to lower MTTR
  • Delivered 763.9% 3-year ROI after < 7 months

Read the Full Report

Economic impact on enterprise logging and observability costs

Lightrun Accelerates Development For...
Developers and team leads

Developers & Team Leads

  • Increase developer productivity by up to 20%
  • Reduce time to market
  • Easy troubleshooting of issues at runtime
  • Native developer experience, right from your IDE
Engineering executives

Engineering Executives

  • Optimize cloud logging costs by up to 31%
  • Continuous quality improvement
  • Faster release velocity
  • Reduce MTTR by up to 35%
  • Reduce developer onboarding time
Developers and team leads

DevOps Engineers & SREs

  • Improve visibility into application logic
  • Reduce MTTR by up to 35%
  • Easier collaboration with engineering teams
  • Faster code-level RCA
Lock

Security & Privacy

Lightrun assures companies the security and privacy of their code by being ISO-27001, SOC 2, GDPR and HIPAA-compliant. In addition, Lightrun provides enterprise-grade controls out of the box: encryption, authentication, RBAC, SSO, audit trail, and privacy blocklisting.

Read More 

Stability

Our built-in sandbox prevents state modifications. No exceptions.

Read More 

Negligible footprint

Minimal overhead and usage quotas ensure ongoing stability.

Read More 

300+ Supported Seamless Integrations

Lightrun supports your favorite languages and seamlessly integrates into your existing IDEs, tools, pipelines, workflows and cloud platforms.

Gartner Peer Insights Reviews:

Lightrun Developer Observability Platform

4.8

Large Enterprise Insurance Company

5.0

"Need To Fix Something ASAP In Production? Better Use Lightrun"

"Can I debug in production ? No ? What's the closest thing I can do like this? Called my devops to get lightrun added to the K8s pod , installed the ide plugin. What happened after that was no less than magic. I fixed the bug which I was working on for weeks."

Large Enterprise Retailer

5.0

"Excellent Bug Finding And Monitoring Tool"

"Lightrun’s Real-time ability to debug production code helps our development organization resolve critical incidents and improve inefficiencies"

F500 Enterprise Software Giant

5.0

"Cutting MTTR Of Incidents Using Lightrun"

"As a developer handling numerous SQA environments that simulate production, I often face incidents that only occur in specific environments, making bug root cause analysis challenging. Lightrun significantly helps in these cases, reducing MTTR and improving incident resolution."

Enterprise Software Giant

5.0

"Seamless Debugging In Live Production Systems: No Code Changes Needed"

"Lightrun provides us with an easy way to debug issues in live production systems without modifying any code. In addition, the company customer service and support helps us maximize the value from the product"

Enterprise Travel and Hospitality

5.0

"A great debugging tool in Multi-Threaded Environment"

"Lightrun is a great tool for developers. It provides a way to debug without interrupting the running application. This is very important to debug in a multi-threaded environment. Also it is easy to use and very powerful to capture all the variables for analysis."

The World’s Most Cutting Edge Companies Use Lightrun

Taboola

“Lightrun was a real life changer for us”

Learn how Taboola slashed MTTR and saved over 260 debugging hours a month with Lightrun.

“It not only saved us days, if not weeks, of painstaking debugging but also provided a more streamlined and efficient approach to tackling complex issues in our production environment. In the ever-evolving landscape of technology, having tools like Lightrun at our disposal is what keeps us at the forefront of innovation and efficiency.”

Tomer Glicksman Software Engineering, Salesforce

One of the best thing I loved about Lightrun is that the setup time is very minimal and then developers have full flexibility to take snapshots of heap or logs at any line of the code. This helps us move into a new direction of development wherein devs dont bother about putting a log statement just for debugging, which would often need a redeploy if log statements were missing.

Danesh Qureshi Principal Software Engineer, Priceline

“Leveraging Lightrun, our teams unraveled complex incidents that were challenging to solve and replicate locally using conventional debugging solutions. Lightrun enables us to quickly introduce dynamic logs and snapshots surrounding the incident area and by that reducing MTTR from hours to minutes.”

Jacob Eckel VP, R&D, Gong
Taboola
Taboola

“Lightrun has been a game-changer for us. With Lightrun we shortened our development process significantly by skipping iterative deployment cycles when adding logs and metrics. A day’s work turned into just one hour. Lightrun provided us with new observability into our production environment that was not accessible to us beforehand. Lightrun is a key component in our developer toolset here at Taboola and one of our development best practices.”

Rami Stern R&D Infrastructure Team Leader at Taboola

“Drata’s main focus is to ensure we’re delivering value for our customers and addressing their most urgent needs; we embrace that approach across the entire organization. Leveraging Lightrun to significantly streamline logging has allowed us to remediate faster without shifting our focus away from critical business initiatives.”

Dave Knell VP Software Engineering at Drata
WhiteSource

“Using Lightrun to debug an actual issue in production enabled us to react instantly. We were able to add the right logs and identify the root-cause in a real-time session, instead of waiting for redeployments.”

Tom Shapira Director of Software Engineering at WhiteSource
Fortune 10 company

“Lightrun is a strategic tool in our SRE & incident mgmt. playbook, and increases the organization’s capacity to respond to customer-facing applicative issues quickly. Lightrun empowers our developers with safe, real-time troubleshooting capabilities and has enabled them to debug mission-critical, complex applicative issues 50-60% faster.“

Director of Engineering F10 Company, >10K Developers

Resources Highlights

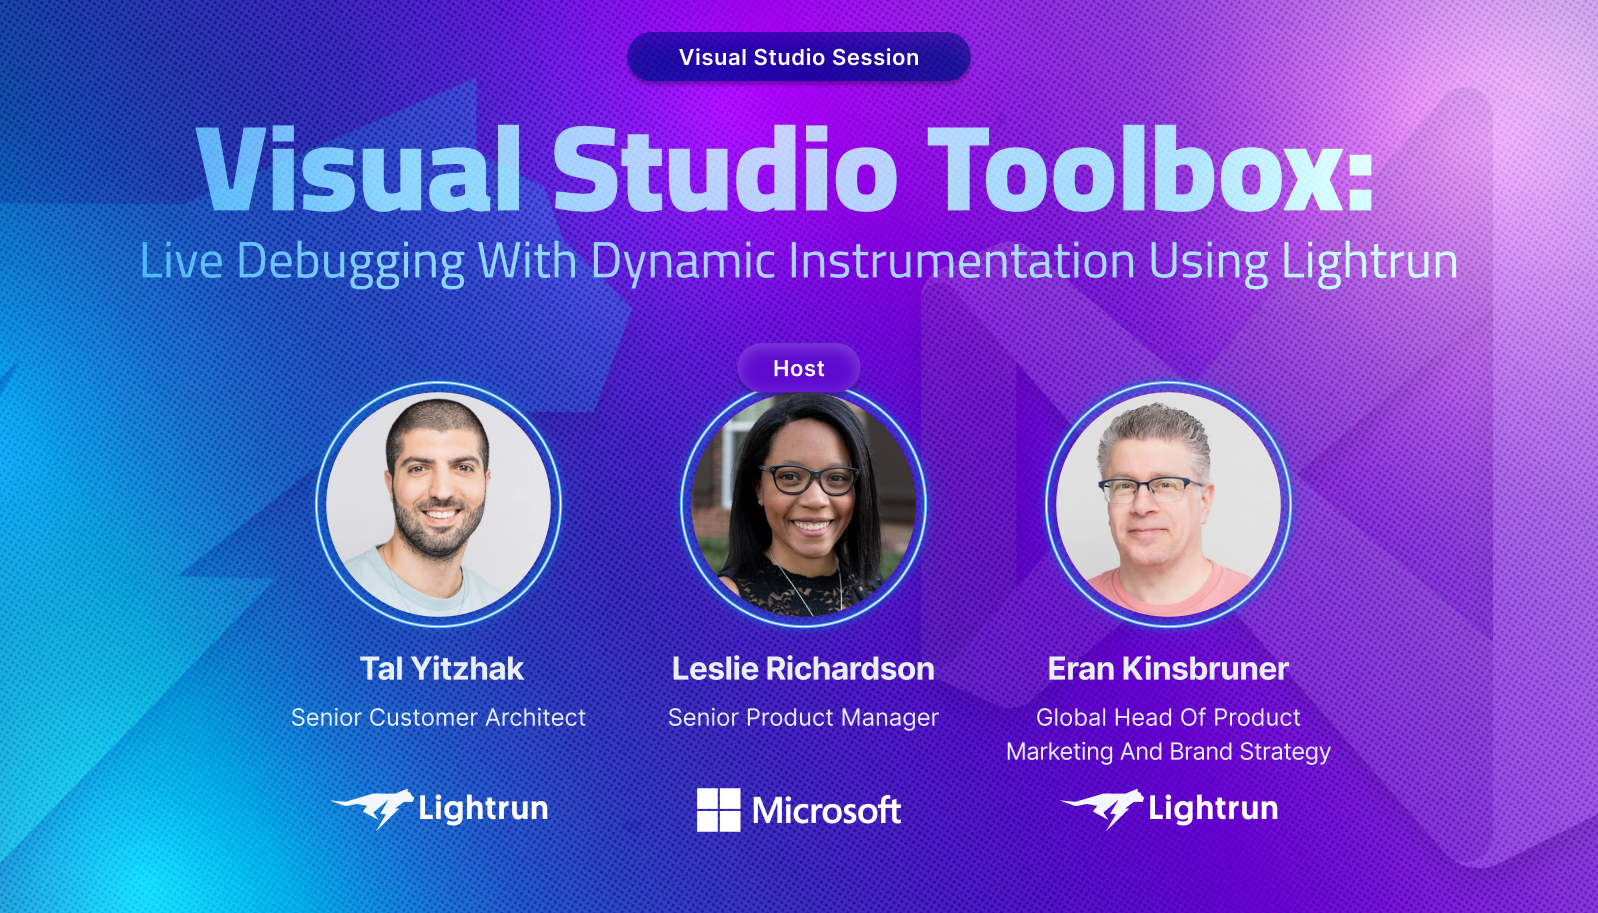
Live Debugging with Dynamic Instrumentation Using Lightrun

In this featured hosted Microsoft Visual Studio Toolbox , We show developers how they can use the Lightrun extension for Visual Studio to dynamically check for issues and debug their code on the fly (at runtime). In addition, the session highlights how Lightrun enables developers to make observability part of the development workflow, making it easier and faster to solve issues.

TechCrunch

Lightrun launches its AI debugger to help developers fix their production code

Lightrun launches its AI debugger to help developers fix their production code

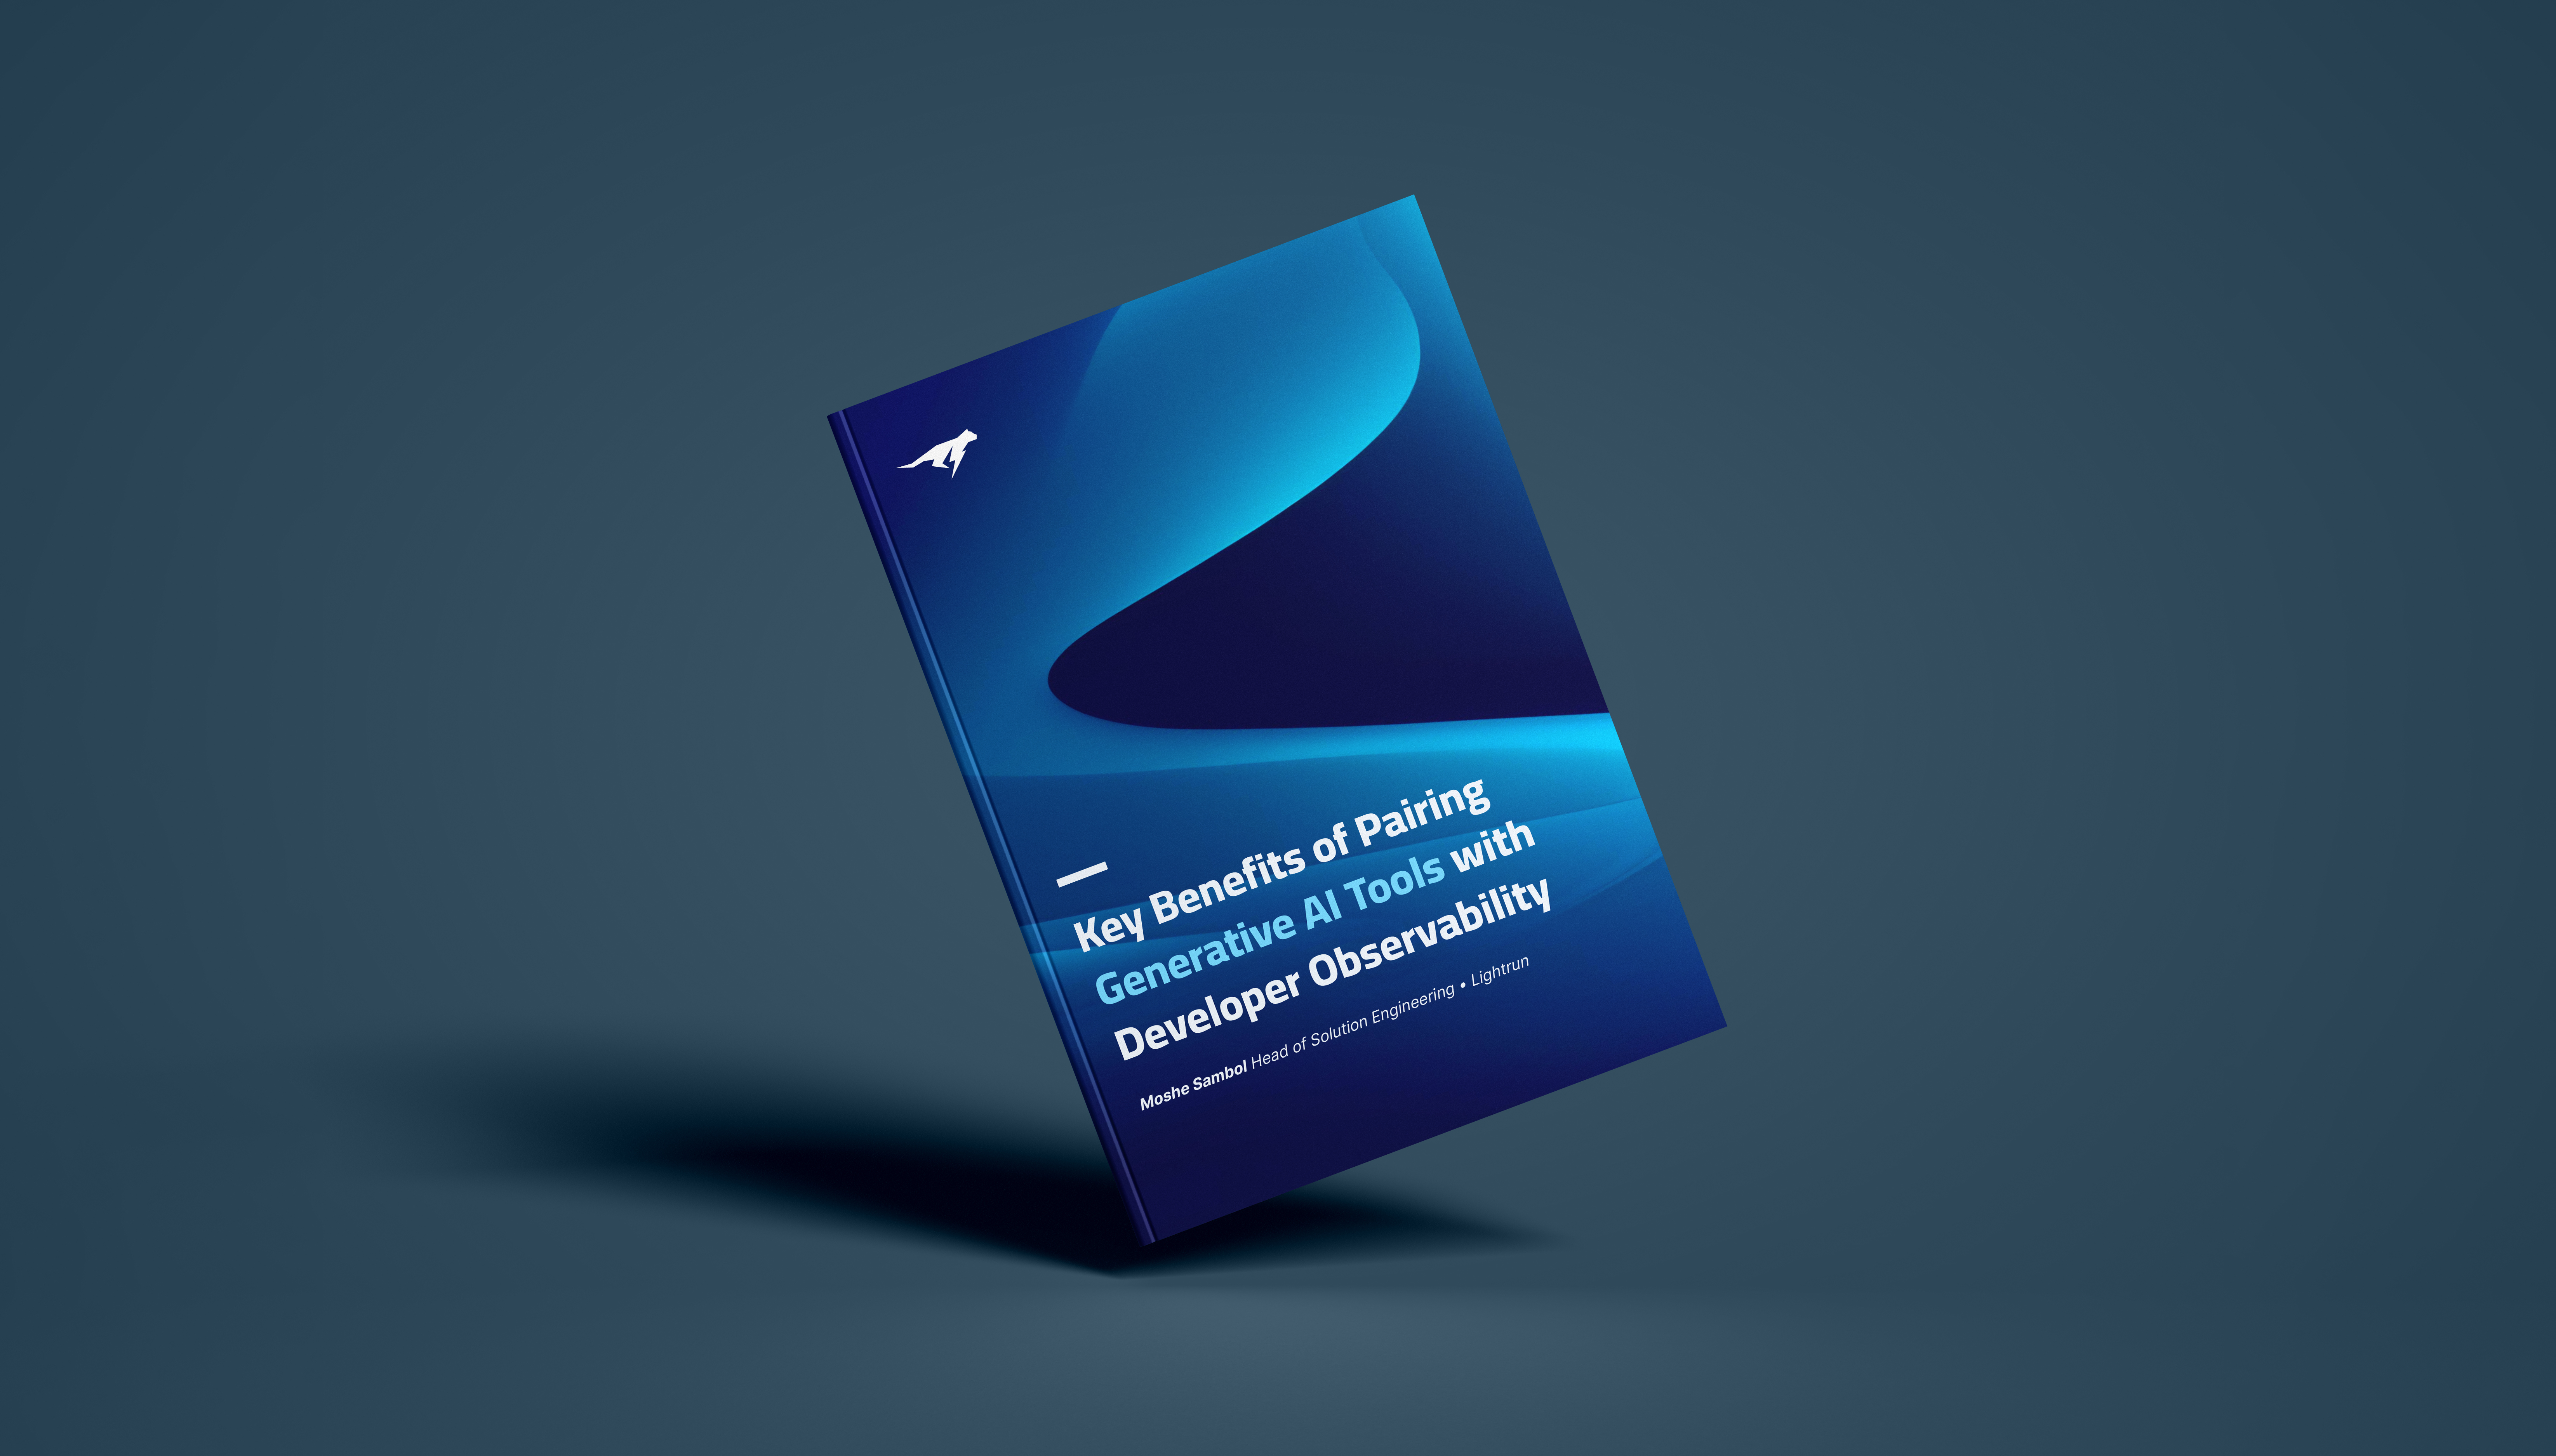
Key Benefits of Pairing Generative AI Tools with Developer Observability

Learn how using Lightrun developer observability developers can shift-left observability and quickly debug and solve complex issues in code that was generated by Gen-AI tools.

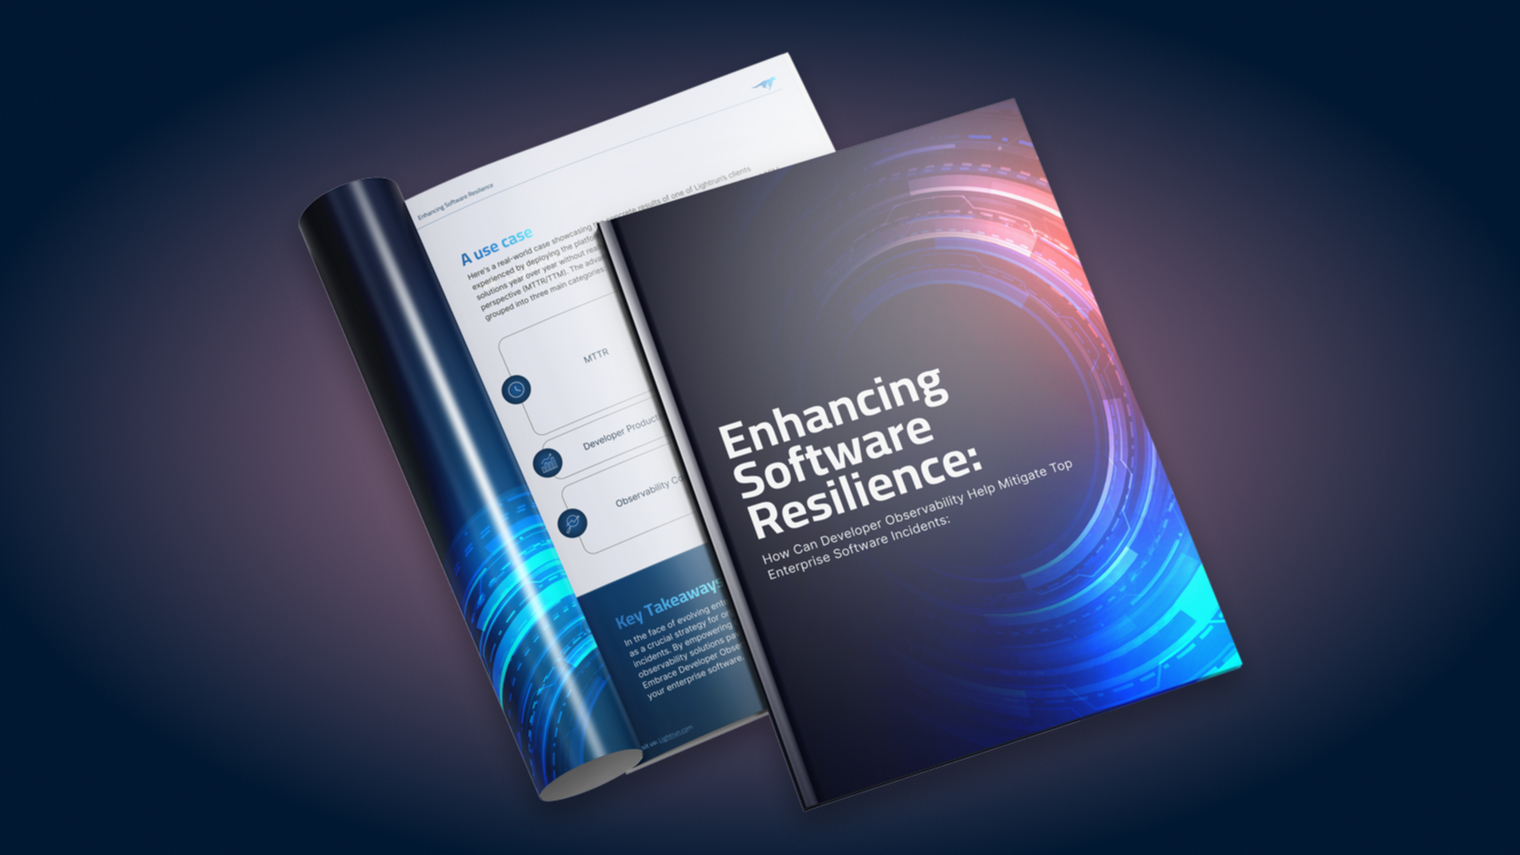
Enhancing Software Resilience: How Can Developer Observability Help Mitigate Top Enterprise Production Outages

Learn how Lightrun’s developer observability platform can significantly improve developer productivity, reduce overall MTTR for critical P1 production outages, and reduce observability costs.

DZone

Application-Level Tracing: The Good, the Bad, and the Alternative

Traditional app-level tracing was good up until a certain level. For complex troubleshooting, live debugging is taking the first seat in modern observability.

What the industry is saying about us

Having a nonintrusive way to add logs and metrics while the service is running in production gives engineers faster access and insight to production issues, and helps enhance their diagnosis and root cause analysis capabilities.

Hassan Ennaciri, Senior Director, Gartner

Lightrun sets itself apart in the effort to bring observability into a routine and day to day task for developers is by bringing capabilities into their tools and day to day workflow.

Liam Rogers, Research Analyst, 451 Research

Unlike the traditional APM go to market, Lightrun focuses on real time fixes by developers. Rather than collecting all system logs, or a subset of them, Lightrun is designed to improve the logs in flight.

James Governor Co-founder, RedMonk

Seeing this type of information [logs and metrics] from production in your IDE is the final frontier of shifting left

Kief Morris, Principal Cloud Technologist, Thoughtworks

FAQs

Most common questions

Do you charge per developer seat or per SDK?

Lightrun charges per SDK – concurrently running SDKs, which directly translate into running application instances (running JVMs, V8s, Python interpreters, etc…).

What languages does Lightrun support?

Lightrun supports all JVM languages – Java, Scala & Kotlin, as well as Node.js (including TypeScript), Python (both 2 & 3) and .NET (C# and F#). We’ll be releasing support for more languages soon – stay tuned!

Does Lightrun work on-prem?

Lightrun can be deployed completely on-prem, without relying on any Lightrun-hosted infrastructure. In addition, Lightrun can be deployed to airgapped, un-networked environments – contact our sales team to learn more.

Lets Talk!

Looking for more information about Lightrun and debugging?
We’d love to hear from you!
Drop us a line and we’ll get back to you shortly.

By clicking Submit I agree to Lightrun’s Terms of Use.
Processing will be done in accordance to Lightrun’s Privacy Policy.