The Lightrun Runtime Context
Architecture
Lightrun is the foundation for reliability in AI-accelerated engineering
across the SDLC, from code to production.
Every environment Instrument and validate behavior across dev, QA, staging, and production.
Every architecture Native support for Kubernetes, serverless, and legacy stacks.
Every pipeline Troubleshoot flaky tests and pinpoint pipeline bottlenecks in real-time.
Secure runtime instrumentation.
Without redeploying.
Lightrun’s patented architecture ensures you never have to choose between speed and security.
Isolated Sandbox
Our proprietary sandbox ensures instrumentation is decoupled from your application logic. Zero impact on threads, performance, or state.
Secure by design
Built-in PII redaction and code exclusion. Empower human engineers and AI agents to instrument without exposing sensitive data.
Enterprise ready
Built for the global stack. RBAC, SSO, and full audit logs provide total control over every instrumentation event.
The Runtime Context Engine
Lightrun captures the live state that observability tools and AI models miss, validating behavior as it happens.
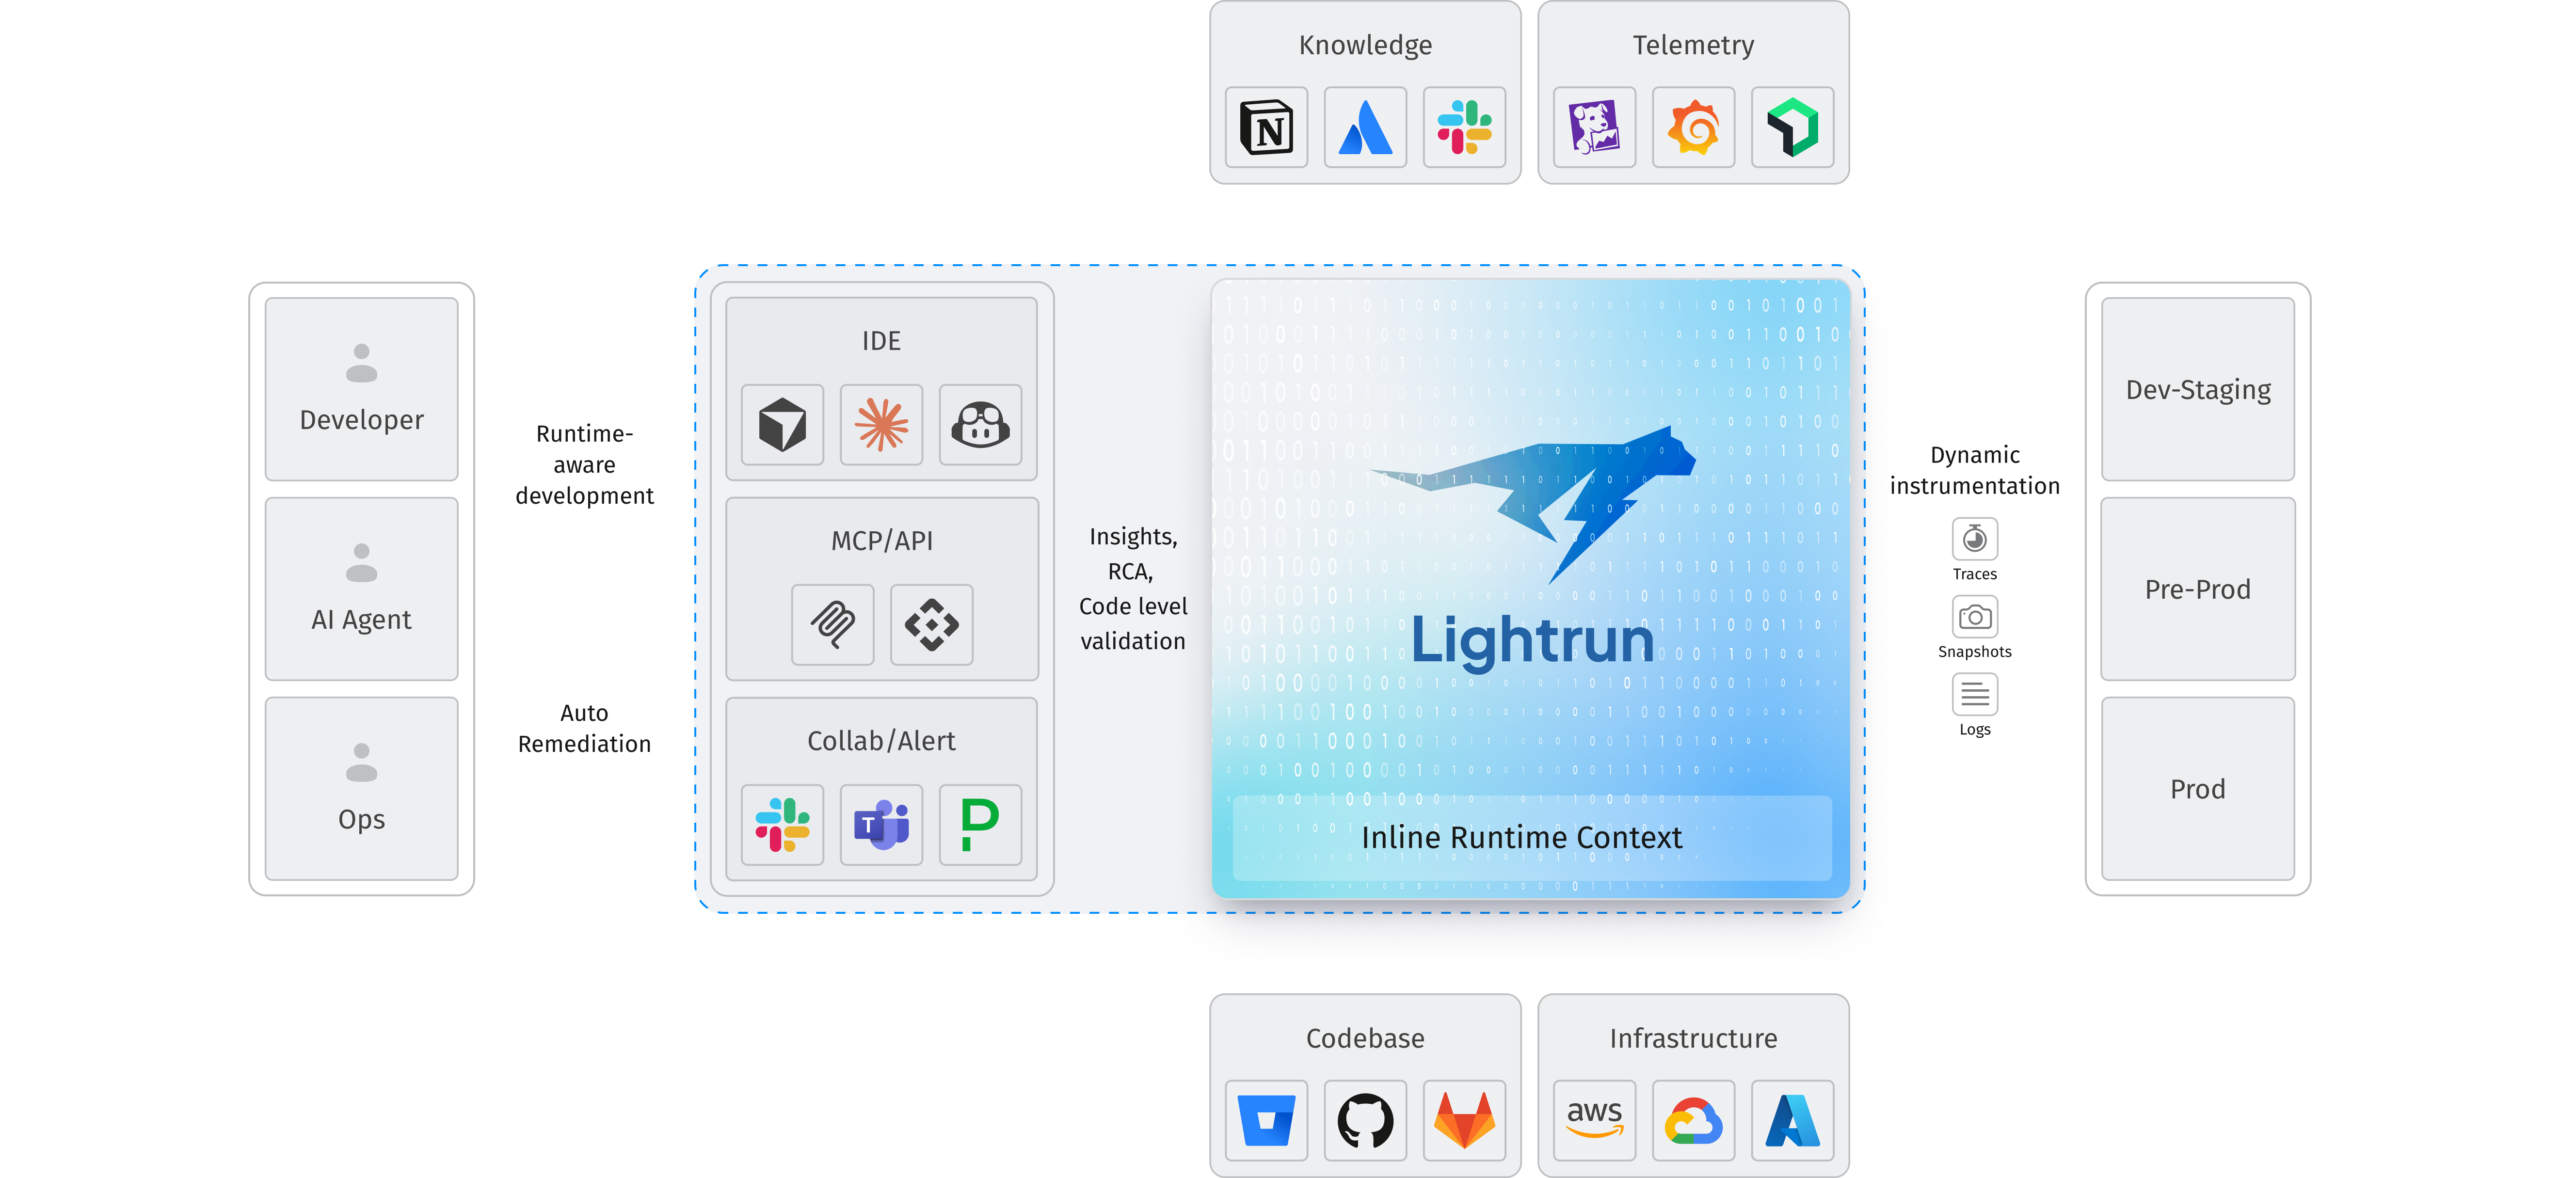
Unified architecture for runtime intelligence.
Lightrun connects engineers and AI agents to live applications in a controlled, production-safe way.
Lightrun Management Server
Centralized governance for every instrumentation event. Brokers activity between users, AI agents, and workloads.
The Management Server brokers all activity between users, AI agents, and workloads.
It validates identity, enforces guardrails, and ensures that no client ever connects directly to a running service.
- Governs all instrumentation policies
- Handles identity and access
- Mediates IDE, API and MCP requests
- Guarantees production workload isolation
- Rotates keys and maintains operational consistency across environments
This is the safety layer that provides the necessary governance to allow humans and AI agents to investigate live systems without risking performance, security, or data privacy.
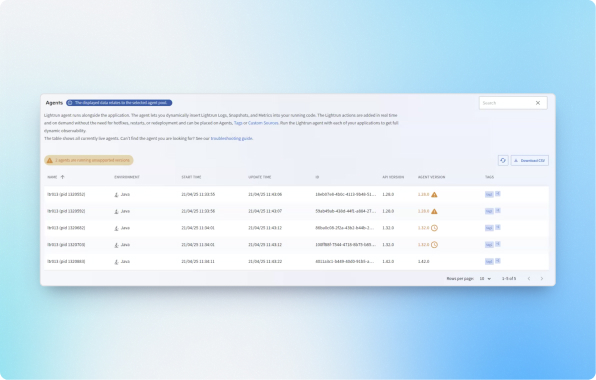
Lightrun Agents
Sandboxed agents that capture deep runtime context without altering application state.
Agents capture snapshots, logs, metrics, traces, and object-level state from running code on demand. They respond only to approved instructions from the Management Server.
- Zero overhead until activated
Production safe dynamic instrumentation
Collect variables, stack frames, object graphs, and execution paths
Automatic cleanup after investigations
Broad language and framework support across microservices and monoliths
Agents deliver precise runtime evidence while the application continues to serve traffic normally, bridging the gap between static code and live behavior.
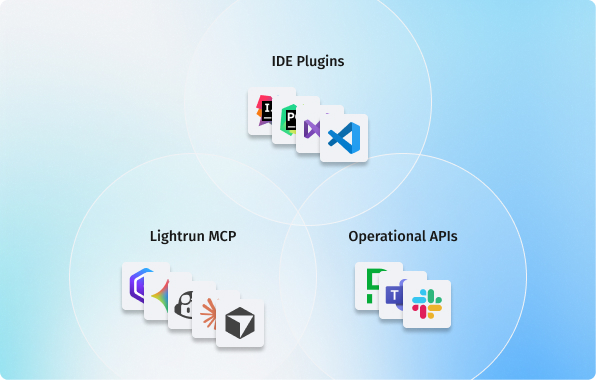
Client Interfaces
Native workflows for IDEs, Operational APIs, and AI Agents via MCP
Native integrations for JetBrains, VS Code, and Visual Studio, so developers can add snapshots and logs directly from the editor through a single governed connection.
Use APIs to trigger instrumentation, standardize investigation patterns, and automate verification in CI, internal tools, bots, and dashboards.
AI agents and code assistants work through the Lightrun MCP Server to query live state and validate hypotheses safely.
The data flow
- Request: A developer or AI agent requests live data via IDE, API, or MCP.
- Evaluate: The Management Server authenticates the requester and evaluates safety policies.
- Instruct: The Server issues a controlled order to the relevant Agent.
- Stream: The Agent collects only the approved data and streams it back through the Server.
- Evidence: The client receives structured runtime evidence to debug, validate, or automate decisions.
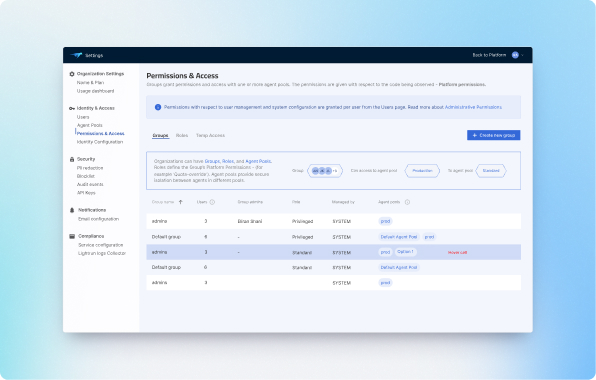
Security and Governance by Design
Lightrun is built for controlled runtime access in sensitive runtime environments.
- No direct connections: All data flows pass through the Management Server. Clients never touch the runtime directly
- Granular access policies: Fine-grained RBAC policies control exactly which users or AI agents can instrument specific services, ensuring least-privilege access.
- Temporary instrumentation: All investigation points are temporary and permission bound
- Encrypted communication: SSL-enforced paths between servers and agents.
- Minimal footprint: Instant ‘off’ capability with no persistent storage unless explicitly configured