Why Manual Live Debugging Isn’t Enough for AI-Generated Code
Apr 15, 2024 / Updated: Sep 18, 2026


Live debugging means inspecting a running application without stopping it, the opposite of the halt-and-step debugger most engineers learned on, and in practice today that means having runtime context: on-demand evidence generated at the exact line that matters, not logs configured months in advance, which matters more now that AI writes a growing share of production code nobody has actually watched run.
Key Takeaways
- Live debugging replaces the traditional Halt-Inspect-Resume workflow with Inject-Gather-Observe, capturing execution data without stopping the running application.
- Four techniques do the actual work: dynamic logs, conditional snapshots, runtime metrics, and distributed traces, each answering a different kind of question about running code.
- Not a single senior engineering leader surveyed for the State of AI-Powered Engineering 2026 Report by Lightrun said they were “very confident” that AI-generated code would behave correctly once deployed.
- Manual debugging and environment-specific troubleshooting eat an average of 38% of engineering teams’ weekly capacity, per the same report.
- Runtime context extends live debugging beyond manual instrumentation, generating the exact evidence needed to confirm root cause on demand, without redeployments or blanket logging.
What Is Live Debugging?
Live debugging is a technique for inspecting a running application’s behavior, variables, and execution path while the software continues to execute, rather than pausing it to step through code line by line. Because the inspection occurs within the runtime itself rather than via interruption, it is sometimes called real-time debugging.
Live debugging differs from traditional debugging in three specific ways. It relies on continuity rather than interruption, observing the software as it runs rather than halting the process to inspect it. It relies on runtime injection rather than code modification, adding debugging output, such as dynamic logs, directly into the executing process rather than editing and redeploying the source code.
And because of those two properties, it works in production, where traditional interruption-based debugging is simply not viable, since halting a live service or modifying its code mid-execution risks disrupting real users.
A Brief History: From Print Statements to Runtime Context
Understanding why live debugging became the dominant approach requires a quick look at what came before it. Debugging in the mainframe era relied almost entirely on print statements and core dumps, which were manually inserted and read. The rise of UNIX brought purpose-built debugging tools like gdb in the 1980s, which let developers inspect a running process without editing its source, a meaningful step forward but still built around halting execution to look inside it.
IDEs embedded that same halt-inspect-resume debugger directly into the development environment, and the pattern extended outward from there: Chrome’s built-in debugger for front-end applications, Visual Studio’s remote debugger for applications running on another machine. Each of these improved the developer experience without solving the core limitation: inspecting a running process still meant interrupting it.
Cloud-native architecture made that limitation untenable. A service running across dozens of ephemeral containers cannot be paused to inspect a single instance without either losing the failure condition entirely or disrupting real production traffic, and that constraint is what pushed live debugging from a nice-to-have to a required capability for any team running distributed systems in production.
The Core Live Debugging Techniques
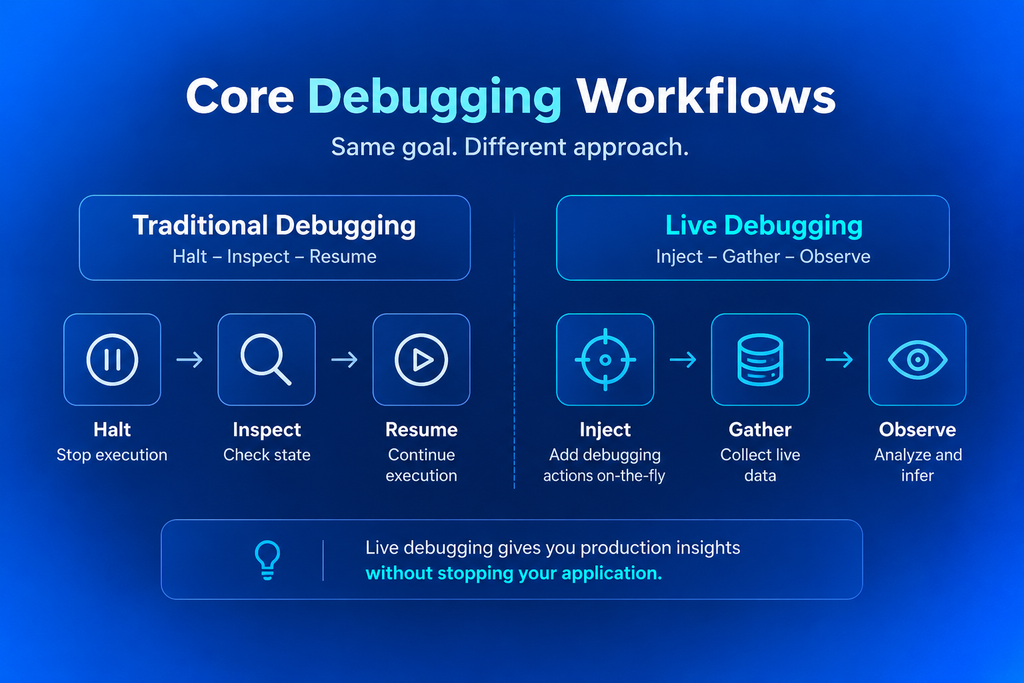
The procedural difference between traditional and live debugging comes down to two workflows.
Traditional debugging follows the Halt-Inspect-Resume pattern: the debugger takes over the runtime, the developer halts execution, steps through code manually, inspects variables and stack state, and resumes execution.
Live debugging follows the Inject-Gather-Observe pattern: the developer injects a debugging action at a specific point in the running code, waits to gather the resulting data as the application’s control flow passes through that point under real conditions, and observes the captured data to infer the root cause.
Four techniques make up the core of live debugging in practice, and each is suited to a different kind of investigation:
- Dynamic logs: Non-halting log statements injected into a running process at a specific line, generating output only when that line executes, without a code change or redeployment.
- Conditional snapshots: A virtual breakpoint that captures the full stack trace and variable state at a specific point in the code, but only when a defined condition is true, rather than on every execution.
- Runtime metrics: Measurements of execution time, call frequency, or custom business logic captured directly from the running application, useful for spotting performance regressions that logs alone won’t surface.
- Distributed traces: Execution paths followed across service boundaries, showing how a single request moves through a distributed system and where in that path a failure or slowdown actually originates.
Together, this telemetry is often referred to by the acronym MELT, for Metrics, Events, Logs, and Traces, and it represents the internal state and context of a running system at the exact moment engineers need to understand it, rather than a fixed set of signals configured weeks or months before the incident occurred.
Why Live Debugging Matters More With AI-Generated Code
AI has removed much of the friction from writing code, but still need to confirm that code behaves correctly once it runs under real traffic, real data, and real dependencies. If anything, AI’s inclusion in engineering has made that confirmation step more important.
Not a single senior engineering leader in Lightrun’s State of AI-Powered Engineering 2026 Report said they were very confident that AI-generated code would behave correctly in production, and 43% of AI-suggested changes require manual debugging even after clearing QA and staging.
That instability shows up at the delivery level too: Google Cloud’s 2025 DORA report found a 10% increase in delivery instability tied to AI-assisted development.
AI is not the source of truth for whether code works, runtime context is. This data source reflects what the code is actually doing rather than what a model predicted it would do.
This is exactly where the four live debugging techniques above earn their value. A dynamic log or conditional snapshot placed at the right line can confirm or disprove an assumption about AI-generated code in minutes, without the multi-cycle redeploy loop that manual verification otherwise requires.
Five Ways Live Debugging Improves Software Delivery
Live debugging changes more than how bugs get found; it changes how teams think about the relationship between development and production.
1. It shifts the developer’s perspective from local to global scope.
Developers working only in local environments have no visibility into how their code behaves once real traffic, real data, and real dependencies are involved. Live debugging gives them direct access to that environment, which is usually the only place a “cannot reproduce” bug will actually show itself.
2. It elevates debugging from a tactical fix to a strategic input.
Classical debugging optimizes for resolving the specific bug in front of the developer. The Inject-Gather-Observe workflow surfaces broader signals about non-functional behavior, like scalability and reliability under real load, alongside the immediate fix.
3. It expedites resolution through a shift-left workflow.
It allows developers and AI agents to observe runtime behavior continuously rather than only after a failure is reported. As a result, live debugging surfaces issues earlier in the development timeline, before they compound into harder production incidents.
4. It reduces the operational overhead DevOps teams absorb during incident response.
Without live debugging, a production bug typically requires reproducing the failure in a temporary test environment, consuming time from both developers and DevOps. Live debugging lets engineers and agents investigate the application directly, without first reconstructing the environment.
5. It establishes an evidence-based approach to reliability.
Continuously capturing MELT data throughout the development lifecycle gives teams performance benchmarks to compare against and an audit trail to reference, rather than relying on memory or tribal knowledge when the same failure pattern recurs.
That distinction matters more than it sounds: American Banker reported that finance engineers spend 39% of their weekly working hours debugging and troubleshooting code generated by AI, amounting to more than two lost workdays a week.
Much of that cost stays hidden because, as Lightrun’s Moshe Sambol told American Banker, a developer writing their own code holds the mental model behind every choice, including where the assumptions sit and how the edges should fail. AI-generated code carries none of that context, so when it breaks in production, debugging becomes reverse-engineering a decision the developer never made.
Sambol added that teams routinely spend more time fixing AI-generated bugs than the AI saved them in writing the code in the first place, a downstream cost that rarely shows up in publicized productivity numbers, since those dashboards measure “lines of code accepted” rather than hours spent in incident response weeks later.
Where Manual Live Debugging Hits Its Limits
Live debugging is not without real constraints, and teams adopting it should plan for three in particular:
- It can be difficult for developers newer to the practice, since it does not offer the same guided, interruption-based interaction as classical debugging. Lightrun removes this barrier by letting AI agents run the investigation directly: an engineer (or an agent) can ask a plain-language question about a running system, and the agent generates and reads the runtime evidence itself, without requiring hands-on live debugging expertise.
- It can generate a meaningful volume of telemetry, which raises real questions about storage cost and retention if every technique is applied indiscriminately rather than targeted at a specific investigation. That’s a real risk when 70% of SREs already cite on-call burnout and toil rose to 30% of their week in 2025, the first rise in five years. This isn’t a concern in Lightrun’s implementation specifically: the data captured is small and ephemeral, generated on demand for a specific investigation rather than persisted as an ever-growing log stream, so it doesn’t add meaningful new data volume or long-term storage overhead.
- It operates within the runtime of a deployed application, raising a legitimate security question about who can access that internal state and under what controls. Lightrun addresses this through sandboxed instrumentation: investigations run in isolation from the application’s live execution, so they can’t alter the running code’s behavior or introduce a new attack surface.
These are not reasons to avoid live debugging; they are reasons the tooling around it matters as much as the techniques themselves. A dynamic log placed carelessly across every request is both a cost problem and a signal-to-noise problem. Runtime access without strict, auditable controls is a governance problem, particularly for teams operating in regulated environments.
Solving both requires the same thing: instrumentation that is targeted, on-demand, and safe by construction, rather than blanket logging bolted onto a running service, which is exactly the model Lightrun’s Runtime Sensor is built on. Exactly how much these constraints matter depends on where live debugging is being applied.
A team running live debugging in a regulated, safety-critical, or business-critical system has a much lower tolerance for both the data overhead and access control risks above, while a team chasing a silent failure in a third-party API integration is usually more concerned with reproducing conditions that a local environment never sees. Both are covered in depth elsewhere on this blog.
How Lightrun Brings Live Debugging Into an AI-Native Workflow
Lightrun applies the same four live debugging techniques described above, dynamic logs, conditional snapshots, runtime metrics, and distributed traces but generates them on demand through the Lightrun Runtime Context Engine rather than requiring developers to pre-instrument code and hope the right signal was captured.
All of it runs within the Lightrun Runtime Sensor, with no performance overhead and no risk to users, directly addressing the security and data overhead concerns that come with manual live debugging at scale.
To make this concrete, consider a fraud-validation check in TradeExecutionService.java that flags any trade exceeding a $10,000 threshold. An upstream schema update changes how totalCost is serialized, from a BigDecimal to a String, and the comparison logic that depends on it doesn’t throw an error; it silently defaults instead:
| BigDecimal totalCost = (rawCost instanceof BigDecimal) ? (BigDecimal) rawCost : BigDecimal.ZERO; // silent fallback, never meant to be the normal path boolean highValue = totalCost.compareTo(HIGH_VALUE_THRESHOLD) > 0; |
No exception, no failed test, just a fraud check that quietly stops doing its job. The check has been silently passing high-value trades for 47 minutes before anyone notices.
The engineer opens Lightrun AI SRE and asks one question: what value is totalCost currently holding when the fraud check evaluates trades in the US-EAST-1 region?
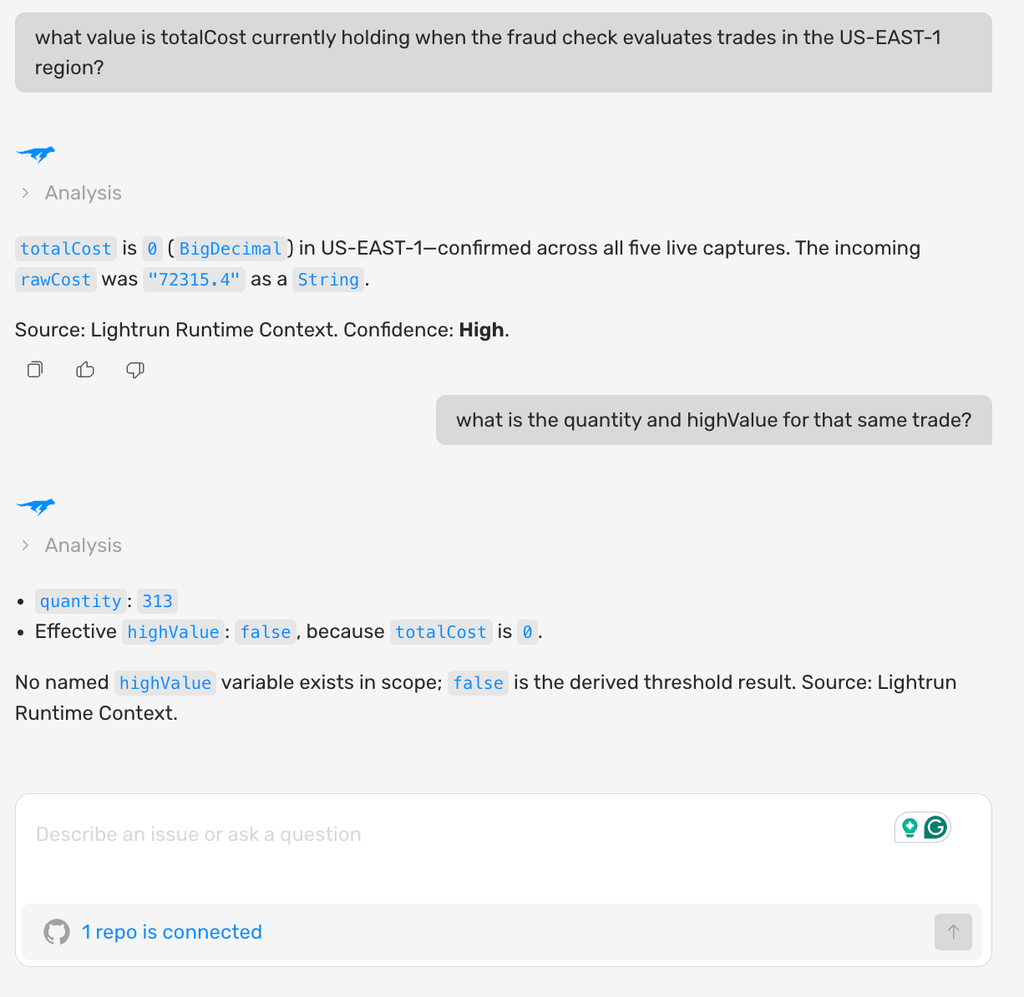
As you can see in the screenshot above:
- Lightrun AI SRE captures the exact runtime value and type of totalCost at the moment the fraud check runs, confirming it is being evaluated as a String rather than a BigDecimal
- The evidence is scoped to the US-EAST-1 region specifically, showing that EU-WEST-1 is unaffected because it has not yet received the upstream schema update
With the type mismatch confirmed against live execution evidence rather than inferred from logs, the engineer can trace the change to the exact commit that introduced the upstream schema update and validate a fix inside the Runtime Sensor before it ever reaches production traffic.
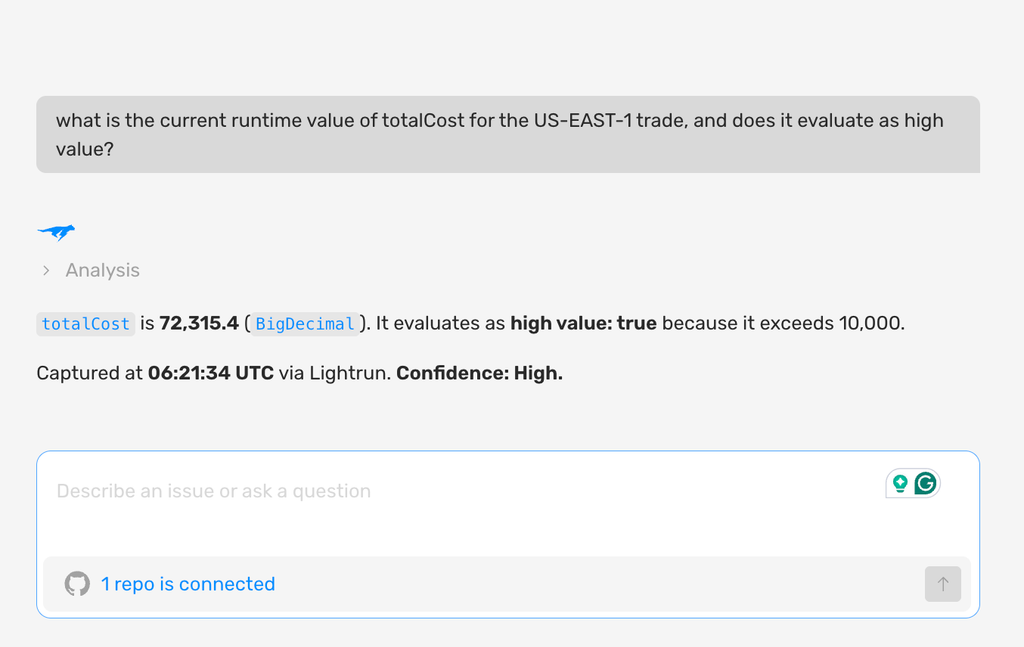
As you can see in the screenshot above:
- The corrected type conversion is validated against real production data before deployment, with the Runtime Sensor confirming highValue now evaluates correctly
- No redeployment or restart was required at any point in the investigation, from the initial dynamic query to the validated fix
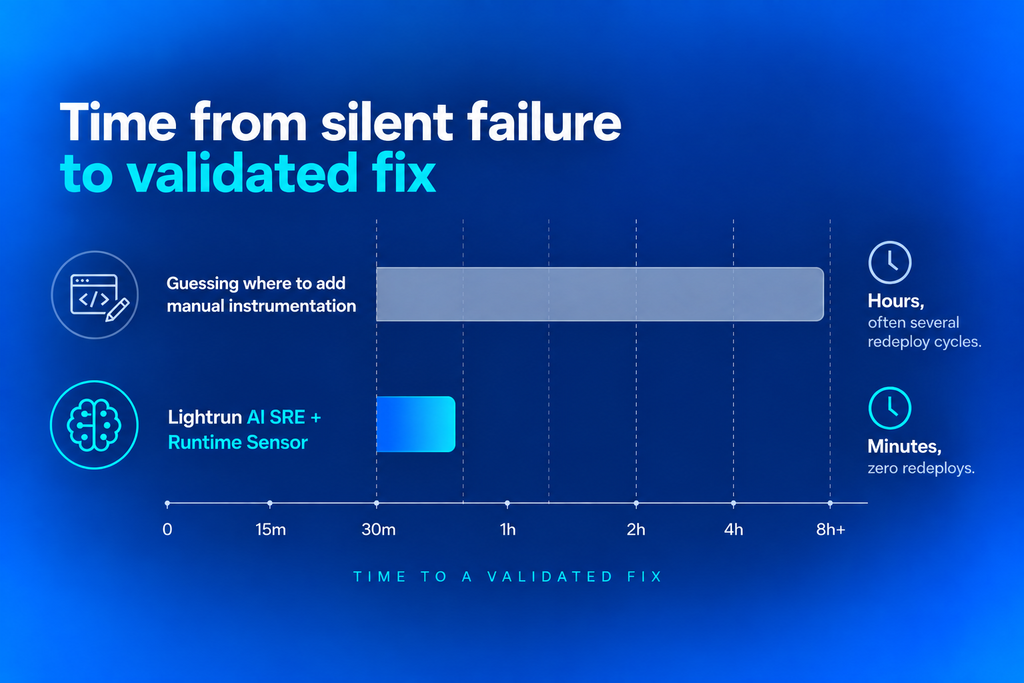
The fraud check had been silently passing high-value trades for 47 minutes before this investigation started. From the first Lightrun AI SRE query to a validated fix took a few minutes, the same evidence-first pattern covered in Lightrun’s guide to reducing MTTR with AI-powered runtime diagnosis.
Traditional Debugging vs. Live Debugging vs. Runtime Context
| Traditional Debugging | Manual Live Debugging | Lightrun Runtime Context | |
| Workflow | Halt-Inspect-Resume | Inject-Gather-Observe | Inject-Gather-Observe, generated on demand |
| Works in production | No, requires halting execution | Yes, but requires pre-planned instrumentation | Yes, generated at the moment of investigation |
| Redeploy required for new signals | Yes | Often, if the right point wasn’t pre-instrumented | No, zero redeploy loops |
| Safety and access control | N/A, development-only | Depends on implementation | Sandboxed instrumentation, no performance overhead |
Why Manual Live Debugging Isn’t Enough for AI-Generated Code
Engineering teams aren’t short on debugging tools. They’re short on evidence: the exact runtime data needed to diagnose a failure, captured at the moment it matters. Preconfigured logging rarely anticipates the condition that causes an incident, and that gap widens with AI-generated code, where nobody wrote the logic and nobody has a mental model of where it might break.
Manual live debugging helps; it inspects a running service without halting it. But it still depends on an engineer guessing where to place instrumentation before the failure recurs. With AI-generated code, there’s no author to ask, so that guess gets harder.
Telemetry planned in advance will always miss the specific signal an unanticipated failure requires. That’s why even AI SRE tools built purely on pre-captured logs and metrics still fail at root cause analysis in a meaningful share of investigations. Closing the gap means generating evidence at the moment it’s needed, not hoping it was captured in advance.
That’s what runtime context does: extending live debugging into an on-demand workflow that generates exactly the evidence an investigation requires, safely and without redeployment. Lightrun brings that evidence into both build-time and incident-response workflows, turning live debugging from a skill an engineer has to get right every time into a continuous, evidence-backed discipline.
FAQs
Live debugging is the practice of inspecting a running system’s execution, variable state, and call stack while it continues to serve live traffic, without pausing, restarting, or redeploying it. It’s the alternative to traditional breakpoint debugging, which halts a process to step through it, an approach that isn’t viable once a system is in production. For critical systems specifically, live debugging is often the only way to confirm a root cause without introducing new risk.
Mean Time to Resolve (MTTR) is the average time required to fully resolve a failure once it occurs, from the moment a critical system breaks to the moment the fix is confirmed. In critical systems, a high MTTR isn’t just an inconvenience: it’s the window during which a safety-critical system remains degraded, a mission-critical process misses its trade-off, or a business-critical function stops generating revenue. Runtime context reduces MTTR by generating missing evidence on demand, without redeploying to confirm the root cause.
MTBF measures the average time between failures of a system or component; MTTR measures the average time to fully resolve a failure once it occurs; and MTTA measures the average time from a failure triggering to someone beginning to investigate it. Together, the three metrics describe how often a critical system fails, how quickly teams notice, and how quickly they resolve it once they do.
The biggest challenge is confirming the root cause without introducing new risk to a system that cannot tolerate downtime, since traditional halt-and-inspect debugging is not viable in production environments controlling safety, mission, or business-critical functions. A second challenge is regulatory: critical systems in Finance and Healthcare require an auditable trail of every diagnostic action, not just the final fix.
Critical systems generally fall into three categories: safety-critical systems, where malfunction can cause loss of life or physical injury, such as avionics software; mission-critical systems, built around completing a defined goal under clear trade-offs, such as navigation software; and business-critical systems, where failure prevents an organization from completing a core function, such as payment processing or customer support platforms.
Lightrun generates missing runtime evidence on demand through dynamic logs, conditional snapshots, and metrics, without requiring redeployment to add instrumentation, thereby removing the manual, multi-cycle investigation loop that stretches MTTR in traditional debugging.
Because that evidence is captured and validated within Lightrun’s Sandboxed Instrumentation, fixes can be tested under real production conditions before deployment, cutting the time from first alert to a confirmed, validated resolution to minutes. See how to reduce MTTR with AI-powered runtime diagnosis for a deeper look at how this works in non-critical-system environments, too.
Traditional observability tools flag that a critical system’s metrics have moved outside an acceptable range but cannot confirm the specific execution-level cause, because they capture only telemetry configured in advance. Lightrun generates the exact runtime evidence a specific investigation requires on demand and automatically captures a structured audit trail of that investigation, which matters directly for regulated critical systems in Finance and Healthcare.