Kubernetes Monitoring: Datadog Alert to Lightrun Root Cause
Jun 15, 2026 / Updated: Jun 15, 2026


Datadog Kubernetes monitoring tells an SRE team what failed, which pod failed, and when. It does so within seconds of the alert firing. The investigation then stalls at the same point every time: nothing in the dashboard layer can prove why a specific request behaved the way it did inside a running JVM at the moment of failure. Variable values, feature flag evaluations, and code branches are never captured.
Key Takeaways
- Kubernetes failures live below the telemetry layer: Datadog shows failures, but the variable values, flag evaluations, and execution paths within the failing pod were never captured.
- The visibility bottleneck is confirmed by industry data: According to the State of AI-Powered Engineering 2026 Report by Lightrun (N=200 senior engineering leaders), 60% of respondents identify a lack of visibility into live production behavior as their primary incident bottleneck, with zero organizations reporting zero bottlenecks.
- AI SRE tools that only correlate telemetry hit the same wall: 44% of AI SRE investigations fail because the execution-level data needed to confirm root cause was never captured.
- Runtime context closes that wall without a redeploy: Lightrun captures variable values, callstacks, and flag evaluations inside the running pod on demand, with no rebuild and no rollout.
- Datadog and Lightrun are the complete stack: Datadog handles detection, infra metrics, and APM at scale; Lightrun adds execution-level evidence that turns a Datadog alert into a confirmed root cause in a single session.
Why Kubernetes Monitoring Stalls Before Root Cause Detection
Every dashboard-based monitoring tool (including Datadog) observes systems from outside the running process and surfaces only what those systems were pre-configured to reportץ This is not a Datadog problem, but it is an architectural limitation shared across most observability products on the market.
Closing that gap requires a different architectural layer, one that operates inside the running pod and generates new evidence on demand under real production traffic.
In this article, we walk through five production failure scenarios in Kubernetes where Datadog monitoring detects the symptom but cannot confirm the cause without a redeployment, and we show how the integration between Datadog and the Lightrun AI SRE closes each gap by capturing on-demand runtime context directly inside the live pod.
Every screenshot and captured value below comes from a live debugging session run against the public OpenTelemetry demo with the Lightrun and Datadog stack wired in, so the entire setup is reproducible end-to-end.
How We Wired Lightrun and Datadog Into the OpenTelemetry Demo
The OpenTelemetry demo a 26-service polyglot microservices application with a built-in chaos flag system, a continuous load generator, and a Java ad-service you can attach agents to without touching the image. That combination is the only way to show what actually happens inside a pod at the moment of failure.
The demo gives you a realistic polyglot Kubernetes workload out of the box:
- ad-service (Java 21, gRPC) returns advertisements based on the product categories a user is viewing
- frontend (Next.js) serves the user-facing UI
- checkout (Go) handles order placement
- cart, currency, email, payment, shipping (Python and Node.js) cover the rest of the e-commerce flow
- load-generator hits the frontend continuously to keep the request volume realistic
The whole stack runs either via Docker Compose for local development or via Helm on Kubernetes for production-ready deployments.
For this post, we instrumented the ad-service with two agents loaded into the JVM at startup through JAVA_TOOL_OPTIONS:
- The OpenTelemetry Java agent for distributed tracing
- The Lightrun runtime agent that registers with the Lightrun platform as otel-demo-ad
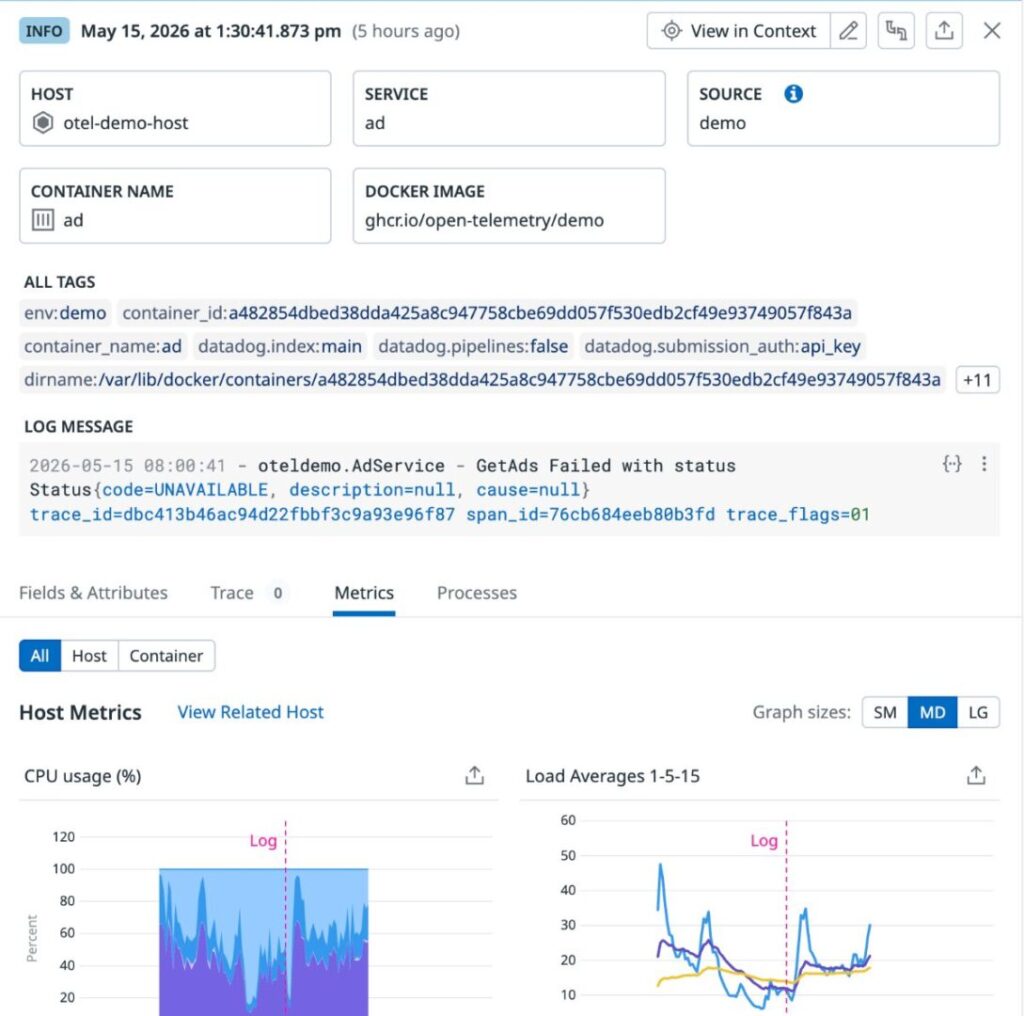
The OTel Collector ships traces, metrics, and logs to both the existing demo backends (Jaeger, Prometheus, OpenSearch) and to Datadog through the datadog exporter added to the collector configuration. A Datadog Agent runs alongside the demo containers, collecting container logs, container metrics, and APM traces.
It ships everything to a Datadog account on the us5.datadoghq.com site.
| # docker-compose.lightrun.yml (ad service excerpt) services: ad: platform: linux/amd64 volumes: – ./k8s-lightrun/linux-agent/agent:/opt/lightrun/agent:ro environment: – JAVA_TOOL_OPTIONS= -agentpath:/opt/lightrun/agent/lightrun_agent.so -javaagent:/usr/src/app/opentelemetry-javaagent.jar -Dcom.lightrun.server=https://app.lightrun.com -Dlightrun.registration.displayName=otel-demo-ad -Dlightrun.registration.tags=otel-demo,ad,docker |
A quick read of what this does:
- volumes mounts the Lightrun agent binary (lightrun_agent.so) read-only into the container at /opt/lightrun/agent. The agent is built for Linux x86_64; hence, the service platform is linux/amd64.
- -agentpath: loads the Lightrun runtime agent into the JVM as a native JVMTI agent. This must come before the -javaagent: line because JVMTI native agents must attach before Java agents to instrument bytecode safely.
- -javaagent: loads the OpenTelemetry Java agent for distributed tracing.
- -Dlightrun.registration.displayName is the name the agent registers under in the Lightrun platform. The MCP tool, later in the blog, queries this exact name (otel-demo-ad).
- -Dlightrun.registration.tags are searchable tags in the Lightrun UI. They are useful when you have hundreds of agents and want to target a subset.
For Kubernetes deployments, the cleaner path is the Lightrun Kubernetes Operator, which injects the same agent declaratively through a LightrunJavaAgent Custom Resource. We show the full Operator YAML in the Hands-On Walkthrough section below.
To produce realistic, repeatable failures, we use the demo’s built-in chaos flag system. The adFailure flag in src/flagd/demo.flagd.json is consumed by the ad-service’s getAds method via the OpenFeature SDK, and when set to on, it causes the service to throw a StatusRuntimeException(Status.UNAVAILABLE) on approximately 10% of requests.
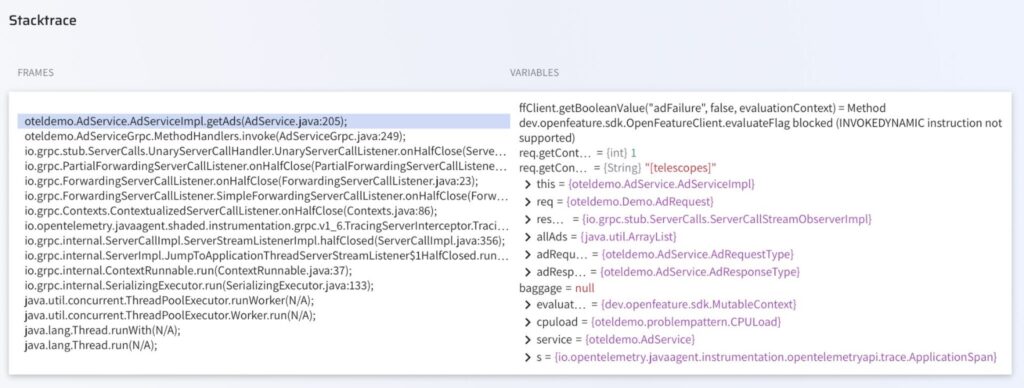
| // AdService.java, line 205 (in the running 2.0.2-ad image) if (ffClient.getBooleanValue(AD_FAILURE, false, evaluationContext) && random.nextInt(10) == 0) { throw new StatusRuntimeException(Status.UNAVAILABLE); } |
Flipping defaultVariant from off to on in the flag JSON immediately produces a steady 10% error rate on the ad-service under live load. flagd hot-reloads the configuration without a restart, which means the failure pattern starts within seconds of the edit. This is the failure we investigate throughout the rest of the blog using Datadog first and Lightrun second.
Why Kubernetes Is Harder to Debug Than You Expect
Kubernetes solved many operational problems (self-healing pods, declarative deploys, horizontal scaling), but it made debugging structurally harder than in the monolith era.Three architectural realities shape every Kubernetes monitoring story:
- Pod ephemerality: a pod that throws an exception at 14:23 may be evicted and replaced by 14:24, taking its in-memory state with it. This is one reason liveness and readiness probes matter so much; they’re Kubernetes’s first line of defense for detecting unhealthy pods before the state is gone entirely.
- Multi-service blast radius: a single user request crosses five to twelve service hops. How those hops find each other at runtime is governed by Kubernetes service discovery, and a misconfigured service can silently misroute traffic in ways no APM span will explain.
- Pre-captured telemetry limits: every log line, metric, and span was decided at deployment time, so any failure mode involving a code path no one anticipated falls into a gap the telemetry stack cannot fill.
The result is an architectural ceiling no amount of dashboard polish can lift. In our running example, Datadog shows the 10% failure rate on the ad-service the moment it begins, but no dashboard can show that ffClient.getBooleanValue(“adFailure”, false, evaluationContext) returned true while random.nextInt(10) == 0 at the exact moment the exception was thrown. That evidence exists for milliseconds inside the JVM and is gone by the time the next request arrives.
What Datadog Kubernetes Monitoring Does Well
Datadog is among the strongest Kubernetes monitoring platforms available today. Across four capability areas, Datadog covers detection, correlation, and triage end-to-end before an incident escalates to root cause analysis.
Infrastructure layer (nodes, pods, DaemonSet, resource usage)
The Datadog Agent runs as a DaemonSet (a Kubernetes workload that runs exactly one pod per node) and auto-discovers every workload with effectively zero per-pod configuration. Out of the box, it ships:
- Container logs from stdout/stderr
- Kubelet metrics (per-container CPU, memory, network)
- kube-state-metrics (deployment, pod, node state)
- Pod and node events
- Orchestrator data for the Kubernetes resource explorer
When the Agent DaemonSet itself misbehaves, with the wrong image, missing tolerations, or scheduling issues, our top five debugging tips for Kubernetes DaemonSets walk through using kubectl describe, kubectl logs, and kubectl exec to isolate exactly where the problem is.
In our OTel demo setup, dropping the Datadog Helm chart into the cluster with a single API key brought all 26 service containers into Datadog Infrastructure → Containers within two minutes.
APM and traces
Datadog APM receives OpenTelemetry traces from the OTel Collector through the datadog exporter and surfaces per-service request rates, latency histograms, and error spans inside the Service Catalog. Every gRPC call to the ad-service automatically includes full span attributes, including contextual data emitted by the demo at runtime, such as app.ads.contextKeys, app.ads.contextKeys.count, and app.ads.count.
| # otelcol-config-extras.yml, adding the Datadog exporter exporters: datadog: api: site: ${env:DD_SITE} key: ${env:DD_API_KEY} service: |
The datadog exporter joins each pipeline alongside the demo’s existing exporters.OTel demo’s native Jaeger, Prometheus, and OpenSearch backends continue to receive their data, and Datadog simply joins as a parallel destination. Within a few minutes of the OTel Collector restarting, traces begin to populate the Datadog APM service map.
Watchdog anomaly detection
Watchdog is Datadog’s automated anomaly detector. It surfaces unusual patterns across services without any configured threshold, which means the 10% failure pattern from our chaos flag triggers an alert within minutes, complete with correlated changes (recent deployments, config updates, dependency anomalies) for the on-call engineer to review.
The architectural limitation is that Watchdog confirms which signals are anomalous, but it cannot access the pod to determine which line of code is producing the anomaly.
Bits AI SRE: what it can and cannot do
Bits AI SRE is Datadog’s autonomous AI assistant for incident investigations. It accelerates triage by correlating pre-captured telemetry across:
- Logs, metrics, and traces
- Deployment markers and recent change events
- Active alerts and monitor history
The architectural ceiling is that Bits operates exclusively on telemetry already inside Datadog. When the execution-level signal needed to confirm a root cause was never instrumented into the pod, Bits cannot generate it on demand. Bits correlate with what was captured, and it does not capture what was not.
Lightrun AI SRE is a complete incident investigation platform: it triages alerts, correlates signals across Datadog logs and APM, runs autonomous RCA, produces structured evidence trails with commit attribution, and generates new runtime evidence inside the running pod on demand.
The last capability is what separates it from every other AI SRE on the market, including Bits. No other tool creates the missing signal; they all reason over whatever was captured before the incident started.
Where Datadog Monitoring Hits Its Limit
These five failure patterns recur in production incidents where Datadog detects the failure but cannot confirm the cause without a redeployment.
1. CrashLoopBackOff with no clear cause in logs
A Java service starts crash-looping (Kubernetes’ name for a pod that keeps crashing and restarting on a back-off schedule) after a routine ConfigMap update.
What Datadog shows:
- Pod restart counter climbing through kube_pod_container_status_restarts_total
- The last log lines before each crash end in a NullPointerException
- A stack trace that points to framework code rather than to your application logic
What is missing:
- The configuration object state at the moment of the NullPointerException
- The code path through service initialization that left the critical field null
- Any indication of which ConfigMap key value triggered the new behavior
The pod dies before new instrumentation can be deployed, and the next pod crashes identically before producing new logs. The only debugging tools available are speculation about which config key changed, plus pull requests to add logging that only land if the next deploy succeeds.
2. Intermittent 500s that vanish before you can investigate
Datadog APM surfaces a 0.5% error rate on payment-service that appears only between 09:00 and 09:15 UTC each day. By the time the on-call engineer logs in, the traffic pattern has shifted, and the errors have stopped.
What Datadog shows:
- Error span count for the 15-minute failure window
- Trace IDs of the failed requests
- Service map highlighting where the errors originated
What is missing:
- The request payload that triggered the failure
- The upstream caller’s intent for that specific request
- The conditional branch the code actually took
- The downstream dependency’s response code at the moment of failure
Without execution-level capture during the next failure window, the team must wait for the next occurrence and hope that new instrumentation lands in the right place within a production code path that fires only once every 15 minutes.
3. OOMKilled pods where memory usage alone doesn’t explain the crash
A pod is OOMKilled (terminated by the Linux kernel for exceeding the container’s memory limit) at 1.8 GB against a 2 GB limit, after a steady 30-minute growth curve.
What Datadog shows:
- Memory metrics timeline showing the growth pattern
- GC pause durations from the OTel Java agent
- The OOMKill event in the Kubernetes events stream
What is missing:
- Which object types are accumulating in the heap
- Which call sites are allocating them
- Which request types drive the growth pattern
A heap dump taken after the kill is too late and rarely reflects the state of production traffic that caused the leak. Attaching Java Flight Recorder (JFR, the JVM’s built-in profiler) or running a profiler in production introduces overhead that platform teams will not accept on a customer-facing service, so the team typically adds more memory and hopes the leak rate drops below the new limit. That is a workaround, not a fix.
4. Cross-service failures with no trace correlation
A request enters at the frontend, traverses cart, checkout, and currency, and fails at the ad-service boundary with a gRPC UNAVAILABLE.
What Datadog shows:
- The full distributed trace across all hops
- The error span at the service boundary
- OTel TracingServerInterceptor visible in the receiving service’s gRPC stack
- Latency contribution per service
What is missing:
- The receiving service’s local variable state at the moment of failure
- The feature flag evaluation result that triggered the throw
- The specific code branch the request took when it arrived
The on-call engineer ends up trying to reproduce the exact request shape in staging, which rarely matches production state, and each unsuccessful reproduction cycle adds 30 to 60 minutes to the investigation while the alert remains open and the SLO clock keeps ticking.
5. Post-deploy regressions where the alert fires but the changed code path is unclear
A Datadog monitor fires service:checkout error_rate > 2% 15 minutes after a deployment that touched 8 files across 3 services.
What Datadog shows:
- The deployment marker on the timeline
- Error rate trend post-deploy versus baseline
- The diff in error volume vs baseline window
What is missing:
- Which of the 8 changed files contains the code now executing differently
- What the new code’s inputs look like under real production load
- Whether the change is the cause or a coincidental correlation with an unrelated upstream condition
Before narrowing to a specific file, it helps to first confirm that the rollout itself completed cleanly, that all new pods are running, and none are stuck mid-rollout. Kubernetes Lens gives you a real-time visual of pod health across namespaces in seconds, so you’re not chasing a code-level bug that is actually just a partially failed deployment.
Without a way to inspect the new code paths’ runtime behavior in the live pod, the team rolls back the entire deploy, losing 7 legitimate changes alongside the 1 regression, and the velocity cost compounds across every subsequent feature ship.
What Runtime Context Adds to Kubernetes Monitoring
Runtime Context closes the evidence gap that all dashboard-based monitoring tools share: the inability to capture variable values and execution paths inside a running pod at the exact moment of failure.
Production containers are intentionally built lean, and small images mean faster pulls and a smaller attack surface. But lean images have no debug tools when something goes wrong. KoolKits solve exactly this: they are language-specific ephemeral debug containers you attach via kubectl debug, giving you JVM profilers, and Python memory tools inside the live pod’s process namespace without rebuilding the image.
Lightrun’s Runtime Context Engine goes a step further. Rather than attaching shell tools, it captures variable values and call stacks from within the running process, with no shell access needed.
Execution paths inside the running pod
Lightrun instruments running JVM, Node.js, and Python processes through the Lightrun Sandbox, a read-only environment with no performance overhead and no impact on users. Engineers place a conditional snapshot at any line of any class in the agent’s classpath, and on the next execution under live traffic, the snapshot captures the full execution context with no code change, no rebuild, and no rollout.
Variable states at the exact moment of failure
Each snapshot returns all local variables in scope, the complete call stack, and any custom expressions the engineer specifies. In our running example, a snapshot at AdService.java:205 on the otel-demo-ad agent captures the request context at the moment the chaos condition is evaluated: the number of context keys, the request type, and the OTel trace ID from the upstream caller.
The same line is unreachable to any APM tool because it is a conditional rather than a span boundary, and traditional tracers cannot probe inside a method body that the original developer did not explicitly instrument.
Request-level data without redeployment
Adding new instrumentation in Datadog, Prometheus, or any APM tool requires a code change, a container rebuild, a registry push, and a rolling update. Lightrun adds it in seconds against the running pod. That single property closes the redeploy loop across all five scenarios above: investigations that would otherwise require three image rebuilds and three rollouts complete end-to-end in a single session.
How the Lightrun Runtime Sensor and Datadog Integration Works
Lightrun and Datadog work through two channels:
- Datadog connector in Lightrun AI SRE lets you read Datadog logs, metrics, monitors, APM data, and events
- Lightrun Sensor lets the AI SRE (and your AI coding agent) query the live pod directly for execution-level evidence
The diagram below shows the full signal flow during an incident.
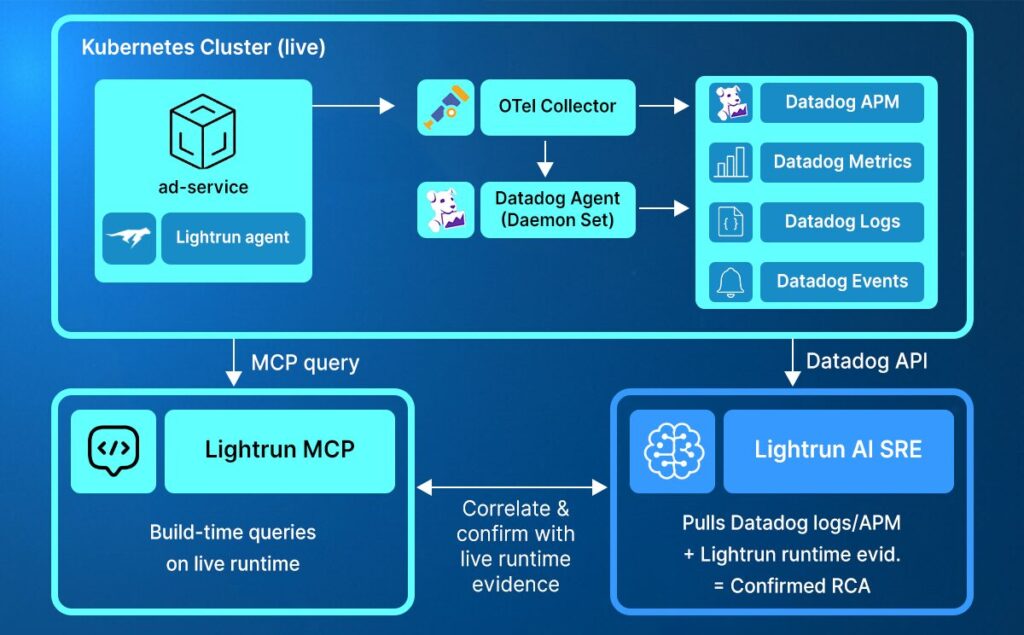
Datadog fires the alert, Lightrun AI SRE picks up the signal
A Datadog monitor configured on service:ad error_rate > 5% fires when the chaos flag begins triggering exceptions at the 10% rate. The Lightrun AI SRE Datadog connector authenticates to the Datadog tenant with an API Key and an Application Key carrying these read scopes:
- logs_read
- metrics_read
- monitors_read
- apm_read
- events_read
The context returned by the connector includes:
- Matching log entries for service:ad UNAVAILABLE
- Related APM error spans on oteldemo.AdService/GetAds
- Recent deployment markers
- The alert’s evaluation history
MCP queries the live pod for runtime context
Once the AI SRE has the Datadog signals, it forms a hypothesis: the steady 10% failure rate appears probabilistic rather than environmental, suggesting either a feature flag or a randomized condition in the code path. It then places a Lightrun snapshot at AdService.java:205 on the running otel-demo-ad agent to test the hypothesis with live execution evidence.
This is the architectural differentiator: every other AI SRE stops at correlation, while Lightrun generates new evidence inside the running pod.
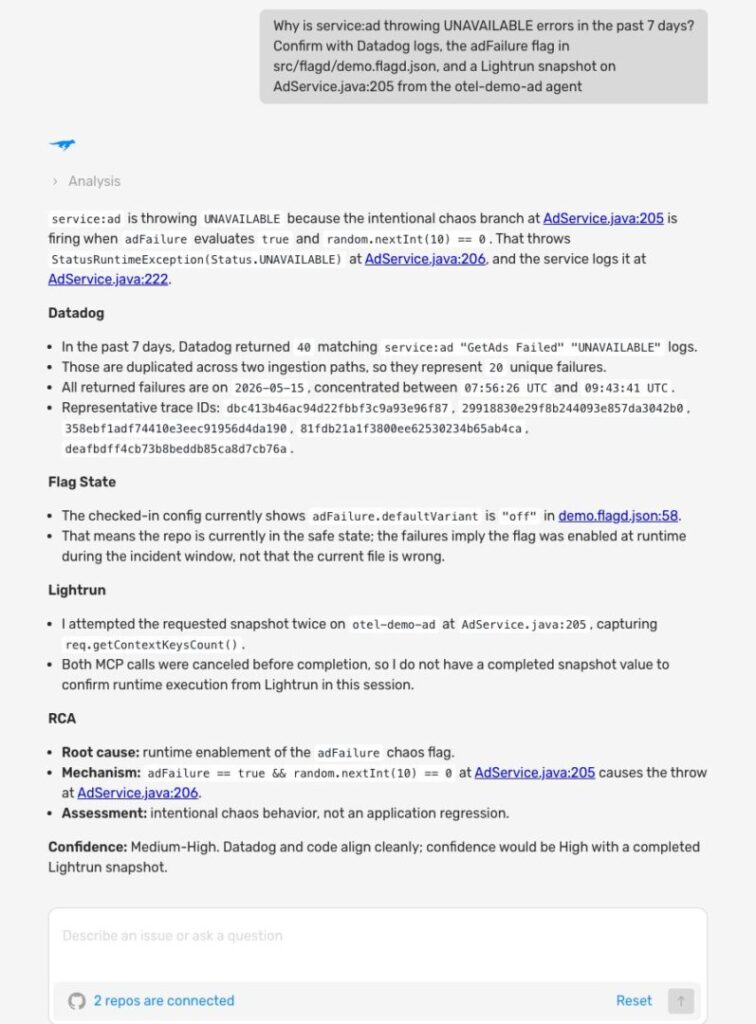
The capture returned from the live debugging session:
The value 1 tells the investigator three things at once:
- This was a Targeted ad request (the AdService code branches on req.getContextKeysCount() > 0 versus == 0, where zero means a random-ad fallback).
- The user was browsing exactly one product category, such as [telescopes] or [accessories], so this is real user traffic, not a synthetic health check.
- Combined with the OTel trace ID in the matching Datadog log line, the failure traces back to the specific frontend session that produced it.
The capture occurred entirely within the JVM under live production traffic, with no code changes, no container rebuild, and no rolling update.
A note on what Lightrun does not evaluate: Lightrun’s safety policy blocks expressions that invoke the OpenFeature SDK directly (the INVOKEDYNAMIC instructions used internally by lambda-backed feature flag clients, a JVM bytecode pattern Lightrun forbids from snapshot evaluation for safety reasons).
The same evidence is available through the surrounding context keys, the request type, and a follow-up snapshot in the catch block (line 222 in our running example), which executes only when the chaos condition has already been evaluated as true.
Autonomous RCA with evidence trail
The Lightrun AI SRE combines three signals into one confirmed root cause:
- Datadog logs: UNAVAILABLE errors with OTel trace IDs
- Datadog APM: error spans on oteldemo.AdService/GetAds
- Lightrun runtime evidence: the request context at the chaos check inside the live pod
The investigation returns a structured incident report with four sections:
- Root Cause states that the adFailure feature flag was enabled at flagd runtime during the window, triggering StatusRuntimeException(UNAVAILABLE) at AdService.java:206 on approximately 10% of Targeted ad requests, identified as intentional chaos rather than a regression.
- Evidence Trail lists the matching Datadog log entries with their unique OTel trace IDs (including dbc413b46… at 08:00:41 UTC), the guarded code path (AdService.java:205 condition, :206 throw, :222 catch log), the current state of the flag block in src/flagd/demo.flagd.json, the origin commit 885875c that introduced the chaos branch, and the Lightrun runtime snapshot result.
- Confidence assigns graded ratings (high on the code path, high on Datadog evidence) rather than a single, uniform certainty, which is what enterprise SRE practice looks like.
- Recommended Action asks for a Datadog monitor that alerts when adFailure stays enabled outside designated chaos windows, so unintentional re-enablement is caught automatically.
The AI SRE investigation is shown in the Hands-On Walkthrough below.
How to Run Lightrun and Datadog Walkthrough
The goal of this walkthrough is to show the complete journey from a firing Datadog alert to a confirmed root cause. No touching the running pod, without a redeploy, and without guessing.
The full integration is reproducible end-to-end in five steps: inject the Lightrun agent, wire Datadog, connect the two, trigger a real failure using the demo’s built-in chaos flag, and watch the AI SRE confirm exactly which line of code is responsible and why.
Step 1. Run the OpenTelemetry demo with the Lightrun agent injected.
For Kubernetes deployments, the Lightrun Kubernetes Operator is the recommended path.
Install the operator and apply a LightrunJavaAgent custom resource targeting the ad-service Deployment.
| apiVersion: agents.lightrun.com/v1beta kind: LightrunJavaAgent metadata: name: ad-service-agent spec: workloadName: ad-service workloadType: Deployment containerSelector: – ad-service agentEnvVarName: JAVA_TOOL_OPTIONS secretName: lightrun-secrets initContainer: image: “lightruncom/k8s-operator-init-java-agent-linux:latest” sharedVolumeName: lightrun-agent-init sharedVolumeMountPath: “/lightrun” serverHostname: app.lightrun.com agentTags: – kubernetes – ad-service – otel-demo |
A quick read of what each field does:
- workloadName + workloadType identifies the target Deployment in your cluster
- containerSelector picks which container inside the pod to patch (a pod may have sidecars)
- agentEnvVarName: JAVA_TOOL_OPTIONS is the env var the operator injects, identical to the Compose path shown earlier
- secretName references a Kubernetes Secret you create separately, holding lightrun_key and pinned_cert_hash
- initContainer.image is the platform-matched Lightrun init container (-linux for Linux distros, -alpine for Alpine-based images, must match your application container’s base)
- agentTags are the searchable tags shown in the Lightrun UI, identical to the -Dlightrun.registration.tags flag in the Compose path
The Operator’s reconciliation loop patches the Deployment to add the init container, mounts the agent binary, and sets JAVA_TOOL_OPTIONS. Kubernetes rolls the pods, and within 60 to 90 seconds, the agent registers under the name and tags above.
Step 2: Deploy the Datadog Agent and configure the OTel Collector to forward to Datadog.
The Helm chart handles the DaemonSet, Cluster Agent, log collection, and APM receiver in a single install.
| kubectl create namespace datadog kubectl create secret generic datadog-secret \ –from-literal=api-key=<your-32-char-key> \ –from-literal=app-key=<your-40-char-key> \ -n datadog helm repo add datadog https://helm.datadoghq.com |
Then add the datadog exporter to the OTel Collector configuration as shown in the earlier code block and roll out the collector. Within 2 to 3 minutes, you should see container logs, APM traces, and infrastructure metrics flowing in the Datadog UI.
Step 3: Configure the Lightrun AI SRE Datadog connector.
In Lightrun AI SRE Connectors → Datadog → Connect, enter the Datadog site (in our setup, us5.datadoghq.com), API Key, and Application Key, enable the read scopes for metrics_read, logs_read, events_read, monitors_read, and apm_read, then click Test Connection.
Step 4: Trigger the failure scenario by enabling the adFailure flag.
| // src/flagd/demo.flagd.json “adFailure”: { “description”: “Fail ad service”, “state”: “ENABLED”, “variants”: { “on”: true, “off”: false }, “defaultVariant”: “on” } |
flagd hot-reloads the file automatically, and within seconds, Datadog Logs show service:ad UNAVAILABLE errors with OTel trace IDs propagated from the failing requests. We confirmed this against the running demo through the Datadog Logs API, which returned three matching error entries within five minutes of the flag flip.
Step 5. Run the AI SRE investigation.
Ask the Lightrun AI SRE directly in Slack (via the Lightrun bot in your incident channel) or open the web chat at ai-sre.lightrun.com:
“Why is service:ad throwing UNAVAILABLE errors in the past 7 days? Confirm with Datadog logs, the adFailure flag in src/flagd/demo.flagd.json, and a Lightrun snapshot on AdService.java:205 from the otel-demo-ad agent.”
The AI SRE pulls the Datadog signals, queries the connected repo for the flag definition, places a dyncamic Lightrun snapshot on the live pod, and returns a confirmed root cause with commit attribution and graded confidence, all in a single session and without asking you to deploy new instrumentation.
The screenshot below shows the full response captured live from this exact prompt, including the Datadog log count, the representative OTel trace IDs, the flag state from the repo, and the graded confidence section at the bottom.
How Lightrun and Datadog Resolve Each Scenario
Each of the five Datadog blind spots from earlier in the blog maps to a specific Lightrun capability that closes it.
| Datadog signal | What Lightrun adds | Result |
| Pod CrashLoopBackOff with NPE in framework code | Snapshot before init returns, capturing configuration object state from the ConfigMap read | Confirmed: the null field originated in the service’s config loader, not in the framework |
| Intermittent 0.5% error rate that vanishes | Conditional snapshot at the error path that fires only when the failure condition matches | Captures only the failing requests during the next window, with no added noise |
| OOMKilled pod with steady memory growth | Snapshot on the allocation hot paths, capturing accumulating object types and call sites | Confirms which call site is leaking, not just that memory is growing |
| Cross-service trace ending in UNAVAILABLE | Snapshot inside the receiving service at the throw site, capturing flag evaluation and request context | Confirms whether the upstream caller, the receiving logic, or a feature flag is responsible |
| Post-deploy regression spanning 8 files | Snapshot of the 2 to 3 changed code paths under live production traffic | Identifies which specific file’s change is producing the regression, enabling a targeted revert instead of a full rollback |
Reliability Is Only as Strong as the Evidence You Have
Datadog covers the what, the where, and increasingly the when of a Kubernetes incident, but the architectural ceiling above which dashboard-based monitoring cannot reach is the why of a specific request inside a specific pod at a specific moment of failure. That ceiling is the same across all observability products on the market, regardless of how sophisticated the AI layer built on top becomes.
AI SRE tools that reason over pre-captured telemetry are bounded by whatever telemetry the team chose to capture before the incident. Lightrun is the only AI SRE that creates runtime evidence on demand: when the signal needed to confirm a cause was never instrumented, Lightrun adds it to the running pod via the Lightrun Sandbox, with no redeploy, rebuild, or rollback.
That property turns a 3-hour redeploy loop into a 10-minute confirmation, and the difference between rolling back 8 files and reverting 1.
Together, Datadog and Lightrun cover the complete Kubernetes incident workflow:
- Datadog handles detection and correlation across infrastructure, APM, and logs at scale
- Lightrun completes the investigation by adding the execution-level evidence that turns a Datadog alert into a confirmed root cause with commit attribution in one session
The result is reliability that shifts from reactive incident response to an ongoing engineering discipline grounded in evidence over guesswork, with zero redeploy loops.
FAQ
The gap is the point at which Datadog has surfaced the alert and correlated the telemetry, but cannot confirm the specific runtime condition inside the failing pod that produced the failure. Closing it requires generating new execution-level evidence on demand from the running pod, which Lightrun provides through the Runtime Context Engine and the Lightrun Sandbox.
The connector authenticates to your Datadog tenant with an API Key and an Application Key scoped for read access to logs, metrics, monitors, APM, and events. When an investigation is triggered, the Lightrun AI SRE pulls the relevant Datadog signals, places snapshots inside the running pod to validate its hypotheses with live execution evidence, and returns a confirmed root cause with commit-level attribution.
Yes. Lightrun is additive, and your existing Datadog Agent DaemonSet, OTel Collector exporters, and APM configuration continue to operate unchanged. Lightrun adds a runtime context layer below the telemetry surface without touching your dashboards, monitors, or retention policies.
Datadog APM observes services from outside through OTel auto-instrumentation and span sampling configured at deployment time, while Lightrun operates inside the running process and captures evidence on demand without redeployment. Where APM samples and reports the spans that were pre-configured, Lightrun captures the exact variable state at any line of code at any moment.