Live Debugging for Critical Systems: MTBF, MTTR & MTTA
Sep 04, 2026 / Updated: Sep 04, 2026


A critical system has to stay reliable without new failures or added downtime, and live debugging, confirming the root cause without stopping the system, is often the only way to do that. In practice, this means having runtime context: on-demand evidence generated at the point of failure rather than logging configured months earlier, which is what keeps MTBF up, MTTR, and MTTA down.
Key Takeaways
- 74% of Finance industry respondents rely on tribal knowledge over documented or automated diagnostic evidence during serious incidents, compared to 44% in technology, according to the State of AI-Powered Engineering 2026 Report by Lightrun.
- 49% of incidents escalated to SREs in critical systems are application or code-level issues, not infrastructure failures, so the fix usually lives in the code, not the platform underneath it.
- Verifying a single fix in a critical production system takes an average of three manual redeploy cycles, a cost that compounds fast when every deployment carries regulatory or safety review overhead.
- MTBF, MTTR, and MTTA together define how a critical system actually behaves under failure, not just whether it fails.
- Runtime context turns live debugging from a manual, redeploy-heavy process into an on-demand capability, cutting MTTR to minutes without adding risk to systems that cannot tolerate downtime.
What Makes a System “Critical,” and Why Live Debugging Is Non-Negotiable
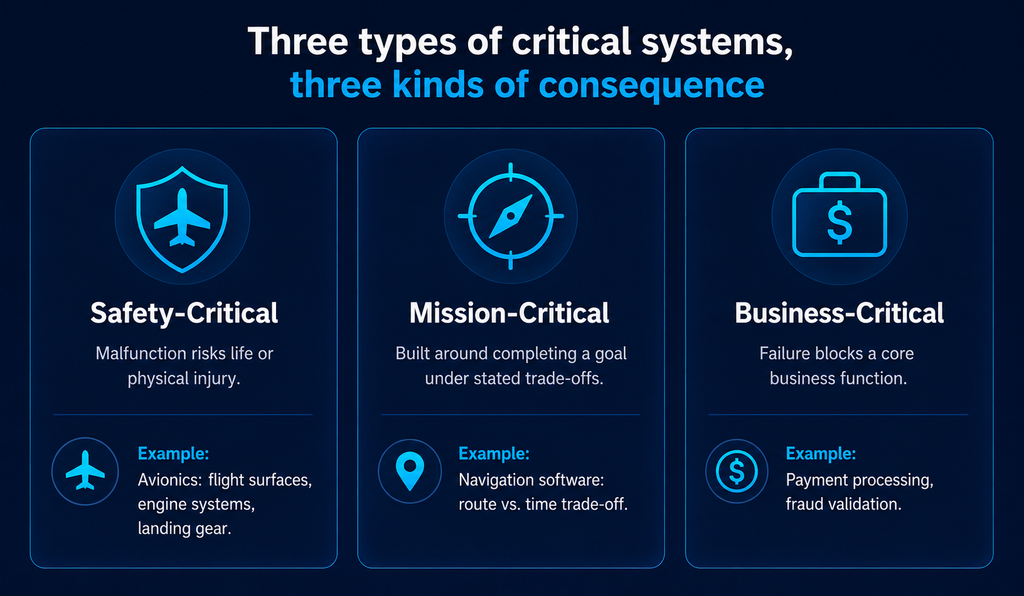
Critical systems generally fall into three categories, and the consequences of failure look different in each.
- Safety-critical: malfunction can cause loss of life or serious physical injury, often with a second-order impact on the surrounding environment. Avionics software controlling flight surfaces, engine systems, and landing gear is the clearest example, designed so that any malfunction has a bounded impact.
An altitude-hold routine reads sensor input at a fixed interval. A unit conversion bug that occasionally treats a feet reading as meters won’t crash anything outright; the aircraft just drifts, and confirming the root cause has to happen without ever pausing the control loop that’s still keeping it level.
- Mission-critical: built around completing a defined goal with clearly stated trade-offs. Map-based navigation software is the familiar example: the mission is reaching the destination, the trade-off is time, and the system recommends the fastest viable route given those constraints.
A logistics routing engine that silently falls back to a cached, hours-old traffic model when its live feed times out. Routes still return, so nothing looks broken on a dashboard, but the trade-off the system exists to honor, speed, is quietly no longer being served.
- Business-critical: failure prevents an organization from completing a core business function, with revenue and reputational consequences. Payment processing and customer support platforms are the most common examples, and a fraud check that silently misclassifies high-value transactions falls squarely into this category.
61% of organizations report that downtime costs them more than $50,000 per hour, according to NeuBird AI’s 2026 State of Production Reliability report.
The Reliability Metrics That Govern Critical Systems
Critical systems are typically built with fail-operational or fail-safe designs, meaning they either continue functioning during a failure or shut down safely rather than failing unpredictably.
Live debugging in this context means tracking a specific set of metrics that describe how reliable the system actually is under real conditions, and using runtime evidence to keep three core metrics moving in the right direction.
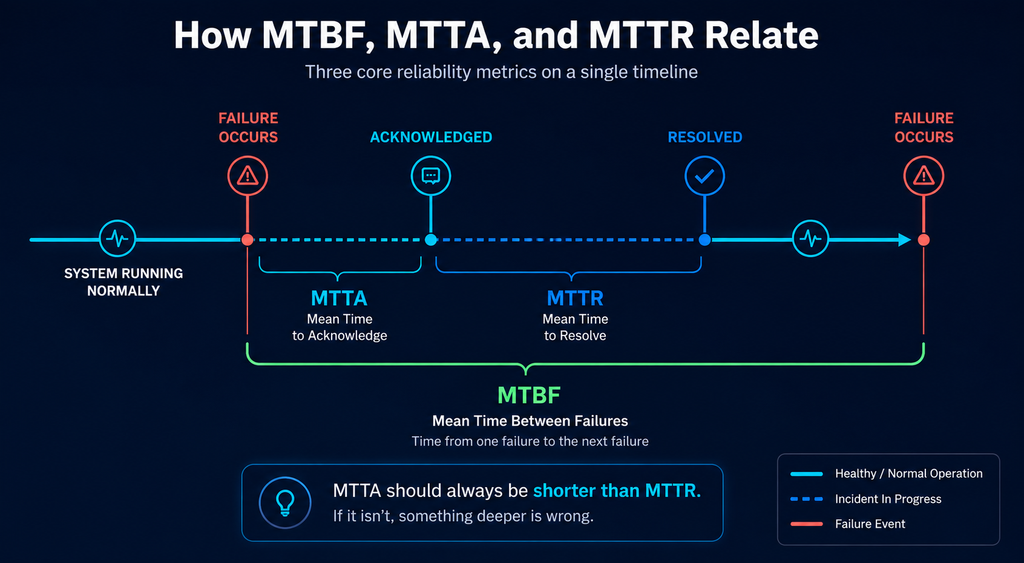
- Mean Time Between Failures (MTBF): the average time between failures of a critical system or one of its components. A higher MTBF means less frequent failures, and comparing MTBF across components can directly inform design decisions: a subsystem with high MTBF needs less redundancy to stay fail-operational, one with low MTBF signals a need for redesign.
- Mean Time to Resolve (MTTR): the average time required to fully resolve a show-stopping bug once a failure occurs. This is the metric end users feel most directly, since it defines how long a critical function stays degraded. A high MTTR usually points to inefficient diagnosis, insufficient runtime evidence, or a shortage of engineers who can act on it.
- Mean Time to Acknowledge (MTTA): the average time between a failure triggering and someone actually beginning to investigate it, reflecting how quickly root cause analysis can start. MTTA should always be lower than MTTR; if that relationship inverts, the system is likely in a genuinely unstable state that needs deeper investigation.
To make this concrete: if a payment authorization service fails three times over a 90-day window, resolved in 12, 40, and 8 minutes, and acknowledged in 2, 6, and 1 minute, MTBF for that window works out to roughly 30 days, MTTR averages 20 minutes, and MTTA averages 3 minutes.
The number worth watching isn’t any single incident; it’s the trend: if MTTR starts climbing while MTBF holds steady, the same class of failure is recurring, and each investigation is still starting from zero instead of getting faster.
Why Critical Systems Need More Than Traditional Observability
Traditional observability tools tell a team that a critical system’s metrics have moved outside an acceptable range. In a regulated or safety-sensitive environment, that’s not enough:
- No execution-level confirmation: a metrics dashboard can show that a threshold was crossed, but not which line of code, variable, or upstream dependency actually caused it, and guessing is not an acceptable substitute for evidence.
- Compliance needs more than a fix: Finance and Healthcare environments require a defensible, auditable record of what was investigated, found, and changed, not just confirmation the issue is resolved, exactly the kind of trail manual, ad hoc debugging rarely produces on its own.
- AI-assisted development raises the stakes: Google Cloud’s 2025 DORA report found a 10% increase in delivery instability tied to AI-assisted changes, and a change that clears every automated check can still carry a runtime assumption nobody verified. In a critical system, that assumption doesn’t surface as a diff comment; it surfaces as an incident.
- Pre-captured telemetry misses what nobody anticipated: critical-system failures are disproportionately the ones no one thought to configure logging for in advance.
How Runtime Context Reduces MTTR and MTTA in Critical Systems
Runtime context closes this gap by generating the missing evidence on demand, without redeploying to confirm the root cause, which actually reduces MTTR in a system that can’t afford the standard redeploy loop.
Consider a fraud validation check inside TradeExecutionService.java. This is a business-critical component that flags any trade above the $10,000 threshold before it clears. If an upstream schema update changed how the totalCost field is serialized, from a BigDecimal to a String, and the comparison logic that depends on it doesn’t throw an error, it simply evaluates incorrectly.
For 47 minutes, the fraud check silently passes every high-value trade in the US-EAST-1 region, while EU-WEST-1, which hasn’t yet received the schema update, continues operating correctly. This is the kind of failure that traditional monitoring will eventually flag as an anomaly, but cannot explain on its own.
Why This Fails Silently Instead of Throwing an Error
The relevant part of the fraud check looks like this before the schema change reaches production:
| // TradeExecutionService.java private static final BigDecimal HIGH_VALUE_THRESHOLD = BigDecimal.valueOf(10000); public boolean evaluateFraudCheck(TradeRequest request) { BigDecimal totalCost = (rawCost instanceof BigDecimal) boolean highValue = totalCost.compareTo(HIGH_VALUE_THRESHOLD) > 0; |
The instanceof check reads as defensive coding, exactly the kind of guard a reviewer approves without a second look. It compiles cleanly and every existing test passes, because those tests construct TradeRequest objects with totalCost already typed as BigDecimal. The failure only exists once the upstream feed actually sends a JSON string instead of a number, a condition nothing in the test suite exercises, because nobody wrote a test for a schema change that hadn’t happened yet.
Once it does, rawCost instanceof BigDecimal evaluates false, totalCost silently falls back to zero, and highValue comes out false for every trade regardless of size. No exception, no log line, no failed assertion, just a fraud check that stopped doing its job.
Hands-On: Confirming Root Cause in TradeExecutionService.java
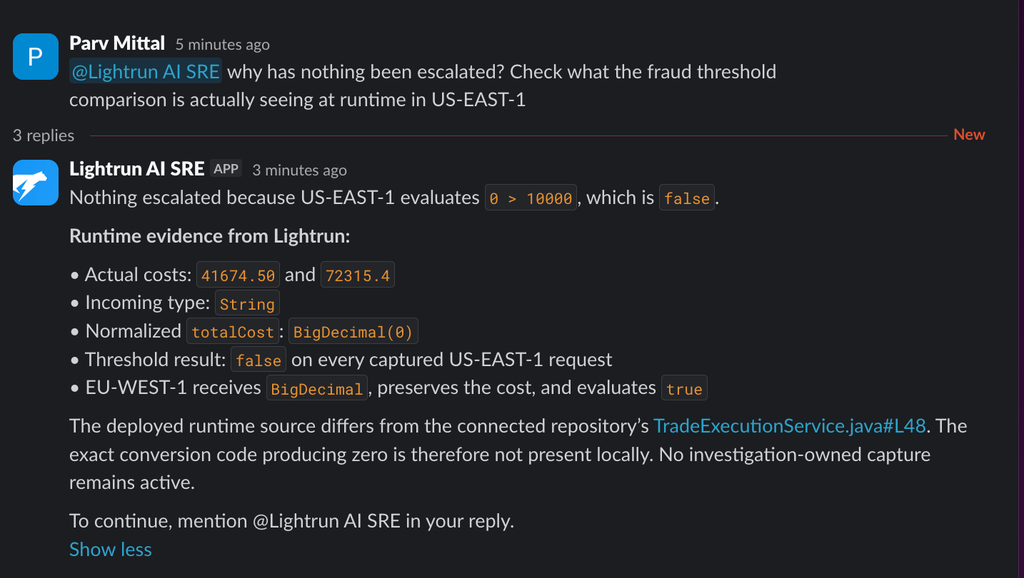
An engineer opens Lightrun AI SRE and asks one question: what is the actual runtime value and type of totalCost when the fraud check evaluates trades in right now?
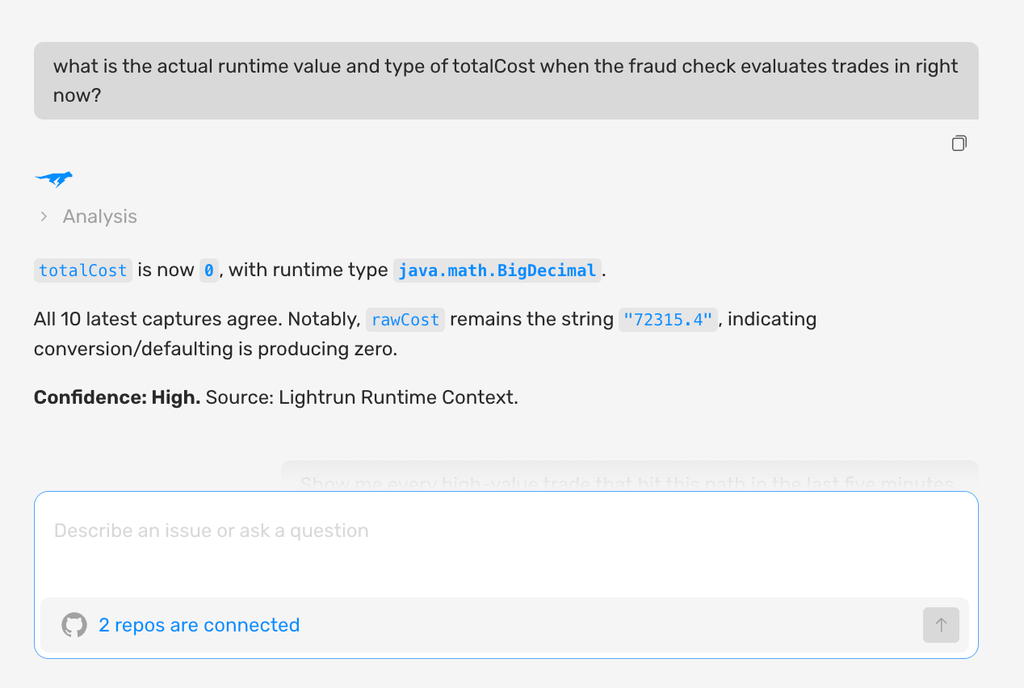
As shown above:
- Lightrun AI SRE confirms totalCost is being evaluated as a String rather than a BigDecimal, which is why the comparison against the $10,000 threshold silently fails instead of throwing an error
- The evidence is unaffected because it has not yet received the upstream schema update, narrowing the blast radius immediately
The snapshot doesn’t stop at one trade. Within the same query window, it captures every high-value trade hitting the affected path:
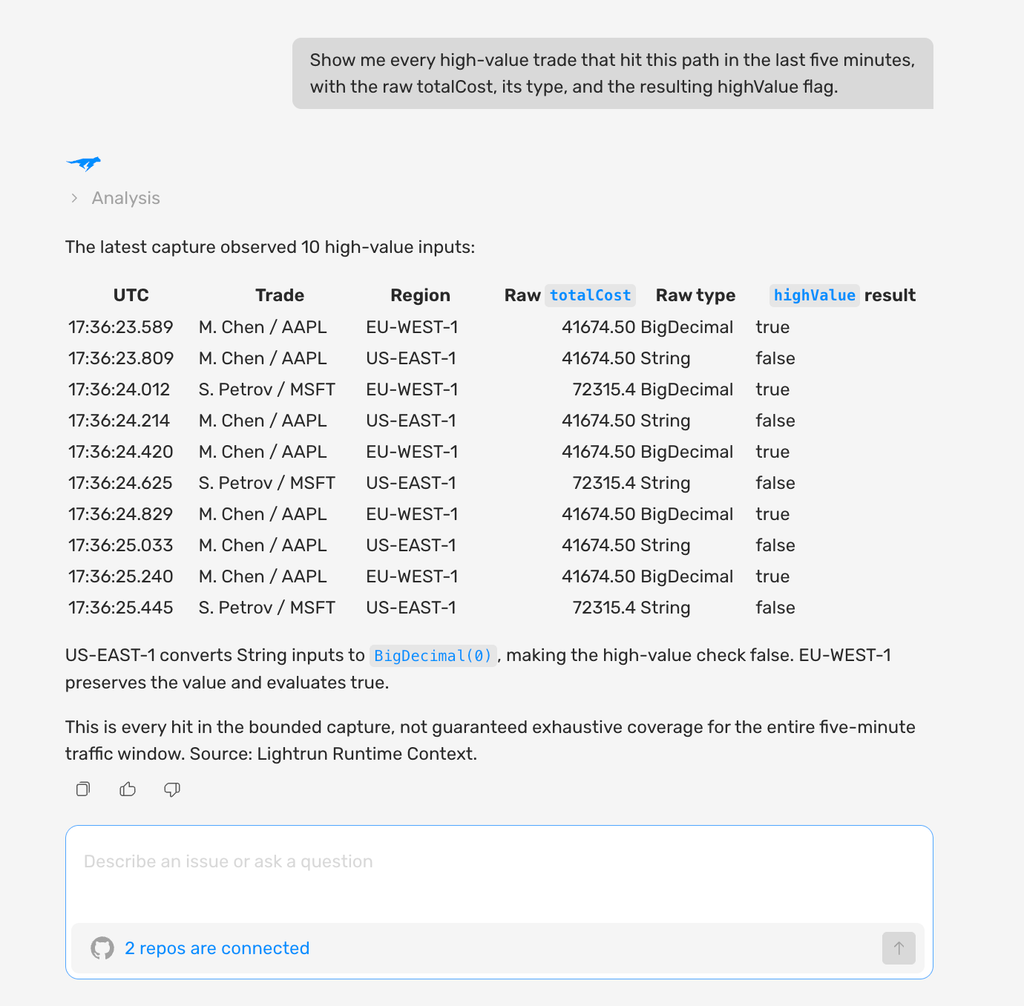
Every one of these trades clears the $10,000 threshold by a wide margin, and every one comes back highValue: false. That consistency is itself evidence: this isn’t an edge case affecting one unlucky trade, it’s every high-value trade in the affected region, which is exactly the kind of scope a metrics dashboard showing an aggregate error rate would never make obvious.
For an on-call engineer, that same investigation rarely starts by opening a new tab. Lightrun AI SRE surfaces the same runtime evidence directly inside the Slack channel where the alert already fired, so root cause confirmation happens in the tool the team is watching during the incident, not a separate app someone has to remember to check.
With root cause confirmed against live execution evidence rather than inferred from a metrics dashboard, the next question in a critical, regulated system is whether the fix is safe to deploy. The fix itself is small: replace the silent fallback with explicit handling for the type the upstream feed actually sends:
Before: silently defaults to zero when the type doesn’t match:
| BigDecimal totalCost = (rawCost instanceof BigDecimal) ? (BigDecimal) rawCost : BigDecimal.ZERO; |
After: handle the String case explicitly, fail loudly on anything else:
| BigDecimal totalCost = switch (rawCost) { case BigDecimal bd -> bd; case String s -> new BigDecimal(s); default -> throw new IllegalStateException( “Unexpected totalCost type: ” + rawCost.getClass()); }; |
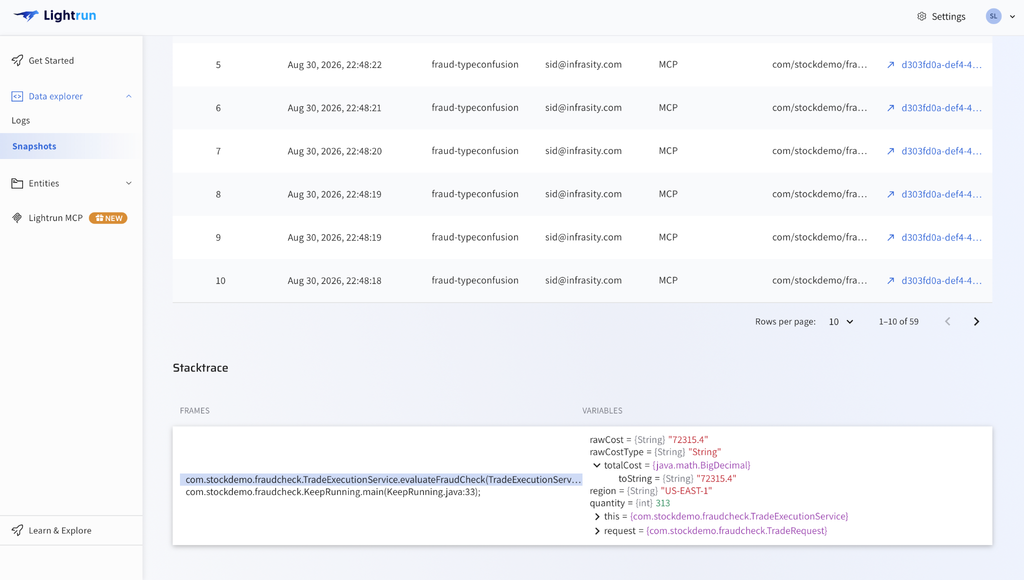
That validation happens using Lightrun’s sandboxed instrumentation, with no performance overhead and no risk to users, where the corrected type handling can be tested against real production data before it ever reaches live trades.
As shown above:
- The corrected type conversion is validated against live production data, with highValue now evaluating correctly as true for the same trade
- The full investigation, from the initial Lightrun AI SRE query through fix validation, is captured as a structured trail suitable for regulatory audit, not just the final resolution
Total time from first anomaly to confirmed root cause and validated fix: under fifteen minutes, without a single redeployment and without any interruption to trades already in flight.
How Runtime Context Fits Across a Critical System’s Lifecycle
The investigation above starts after something has already gone wrong, but the same capability applies earlier, and the earlier it’s used, the less likely a failure like this one is to reach production at all.
- At build time: Lightrun’s MCP integration lets an AI coding agent ask what shape the upstream feed’s totalCost field actually takes in production before writing the defensive instanceof check in the first place, the same query that would have surfaced the coming schema change before it ever became a silent fallback to zero.
- At review time: a runtime snapshot can be attached to the pull request as evidence, not just a diff for a reviewer to reason about abstractly, but the actual variable values and call stack from a real execution path the change touches.
- After deployment: the runtime sensor stays attached to the live service. If behavior drifts from what was validated, the same conditional snapshot can be placed again in seconds without a new deployment cycle.
- Between incidents: Deep Code Research lets teams review live system behavior and surface unusual execution patterns before they trigger an alert, which matters more in regulated critical systems than almost anywhere else, since the audit expectation there is continuous evidence, not just a clean postmortem after the fact.
MTBF, MTTR, and MTTA: What Changes With Live Inline Runtime Context
| Metric | Traditional Observability | Runtime Context |
| MTBF | Improves only through post-incident redesign, informed by incomplete data | Improves faster because root causes are confirmed accurately the first time, reducing recurring failures |
| MTTR | Stretched by manual redeploy cycles to add missing instrumentation | Cut to minutes, since evidence is generated on demand without redeployment |
| MTTA | Dependent on alerting coverage and engineer familiarity with the system | Shortened because the AI SRE can scope blast radius and surface likely cause immediately on alert |
| Audit trail | Reconstructed manually after the fact, if at all | Captured automatically as part of the investigation itself |
Reliability in Critical Systems Comes Down to the Evidence You Can Trust
Whether a system is safety-critical, mission-critical, or business-critical, reliability comes down to the same thing: not how many dashboards are watching it, but whether a team can confirm exactly what happened, quickly enough that MTTA and MTTR actually mean something, and prove it without adding the exact risk the system exists to avoid.
Traditional observability flags an anomaly, it can’t confirm the code-level cause, and 49% of the incidents that reach an SRE in these environments turn out to be exactly that. Pre-captured telemetry only covers what was anticipated in advance, which is why tribal knowledge still resolves 74% of serious Finance-industry incidents rather than documented evidence.
Runtime context closes that gap at every stage, not just during the incident. It’s the same evidence that validates a fix before it ships, confirms root cause the moment an alert fires in Slack or Lightrun AI SRE, and holds up afterward as an audit trail, whether the system in question is a regulated trading platform or a third-party API integration failing silently under a schema change.
Try Lightrun AI SRE for free
FAQs
Live debugging is the practice of inspecting a running system’s execution, variable state, and call stack while it continues to serve live traffic, without pausing, restarting, or redeploying it. It’s the alternative to traditional breakpoint debugging, which halts a process to step through it, an approach that isn’t viable once a system is in production. For critical systems specifically, live debugging is often the only way to confirm a root cause without introducing new risk.
Mean Time to Resolve (MTTR) is the average time required to fully resolve a failure once it occurs, from the moment a critical system breaks to the moment the fix is confirmed. In critical systems, a high MTTR isn’t just an inconvenience: it’s the window during which a safety-critical system remains degraded, a mission-critical process misses its trade-off, or a business-critical function stops generating revenue. Runtime context reduces MTTR by generating missing evidence on demand, without redeploying to confirm the root cause.
MTBF measures the average time between failures of a system or component; MTTR measures the average time to fully resolve a failure once it occurs; and MTTA measures the average time from a failure triggering to someone beginning to investigate it. Together, the three metrics describe how often a critical system fails, how quickly teams notice, and how quickly they resolve it once they do.
The biggest challenge is confirming the root cause without introducing new risk to a system that cannot tolerate downtime, since traditional halt-and-inspect debugging is not viable in production environments controlling safety, mission, or business-critical functions. A second challenge is regulatory: critical systems in Finance and Healthcare require an auditable trail of every diagnostic action, not just the final fix.
Critical systems generally fall into three categories: safety-critical systems, where malfunction can cause loss of life or physical injury, such as avionics software; mission-critical systems, built around completing a defined goal under clear trade-offs, such as navigation software; and business-critical systems, where failure prevents an organization from completing a core function, such as payment processing or customer support platforms.
Lightrun generates missing runtime evidence on demand through dynamic logs, conditional snapshots, and metrics, without requiring redeployment to add instrumentation, thereby removing the manual, multi-cycle investigation loop that stretches MTTR in traditional debugging.
Because that evidence is captured and validated within Lightrun’s Sandboxed Instrumentation, fixes can be tested under real production conditions before deployment, cutting the time from first alert to a confirmed, validated resolution to minutes. See how to reduce MTTR with AI-powered runtime diagnosis for a deeper look at how this works in non-critical-system environments, too.
Traditional observability tools flag that a critical system’s metrics have moved outside an acceptable range but cannot confirm the specific execution-level cause, because they capture only telemetry configured in advance. Lightrun generates the exact runtime evidence a specific investigation requires on demand and automatically captures a structured audit trail of that investigation, which matters directly for regulated critical systems in Finance and Healthcare.