
Lightrun Answers was designed to reduce the constant googling that comes with debugging 3rd party libraries. It collects links to all the places you might be looking at while hunting down a tough bug.
And, if you’re still stuck at the end, we’re happy to hop on a call to see how we can help out.
[Ivy AOT] AOT recompilation is working slow on big projects
See original GitHub issue🐞 bug report
Affected Package
The issue is caused by package @angular/compiler-cliIs this a regression?
NoDescription
We have a big Angular Ivy project, and the problem is that we want to use Ivy+AOT everywhere: in production and development, but we can’t use it for development now because of slow recompilation AOT process.
Project is @nrwl/nx based app with > 10 libraries and two applications.
Also can be important: ng-cli based with custom webpack extensions, hybrid app with angularjs 1.5.8.
Some stats (Ivy+AOT):
Full application:
- first compile: 96225ms - 180000ms
- recompile: 11949ms (±) - 20000ms
Demo application (small part of full application):
- first compile: 35987ms
- recompile: 3040ms
AngularCompilerPlugin stats (in full app):
- 3915 files reported by NgTscProgram
- 2152 classes reported by TraitCompiler
AngularCompilerPlugin stats (in demo app):
- 1600 files reported by NgTscProgram
JIT is working much faster and recompilations tooks always 2-4sec.
I turned on benchmark in node_modules/@ngtools/webpack/src/benchmark.js and started logging why AngularCompilerPlugin works so long on recompilations. Then I added my own logs prefixed with >>>. I added these log files as assignments to this issue. Log files contains our full app compilation and recompilation process - it separated with [RECOMPILE STARTS HERE] tag.
In the first log file you can see that chain
AngularCompilerPlugin._make => AngularCompilerPlugin._update => AngularCompilerPlugin._createOrUpdateProgram.ng.loadNgStructureAsync
take 10311.904ms it is about 10/17 of all recompilation time.
Then dived deep into it and understood that ComponentDecoratorHandler.resolve is the slow method
using console.time. Here is stacktrace:
ComponentDecoratorHandler.resolve (component.js:382)
TraitCompiler.resolve (compilation.js:395)
NgCompiler.resolveCompilation (compiler.js:356)
NgCompiler.analyzeAsync (compiler.js:181)
NgtscProgram.loadNgStructureAsync (program.js:142)
_createOrUpdateProgram (angular_compiler_plugin.js:261)
_update (angular_compiler_plugin.js:842)
_make (angular_compiler_plugin.js:749)
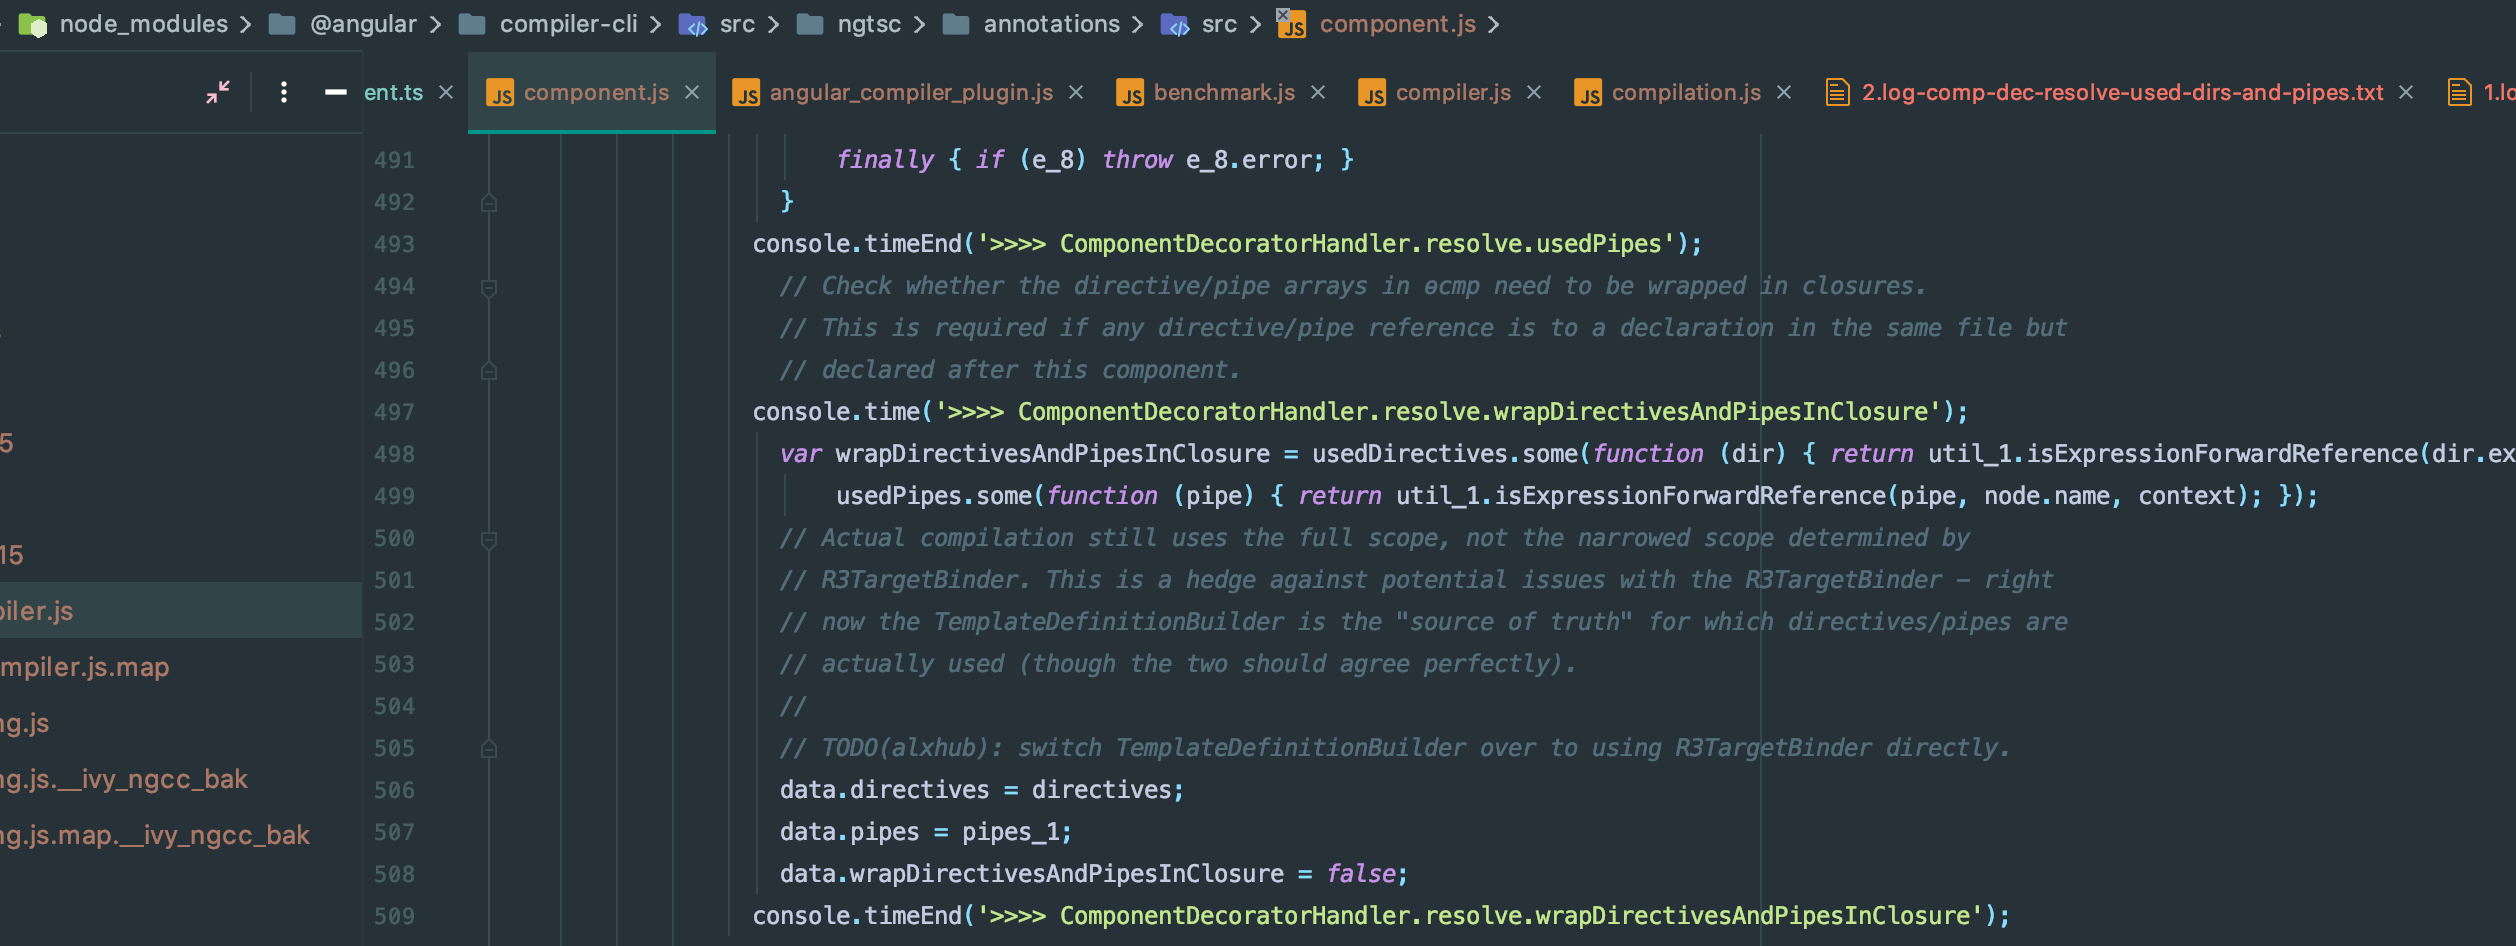
In the second log you can see 3 internal timelines of ComponentDecoratorHandler.resolve() and here is how I did it:
usedDirectives
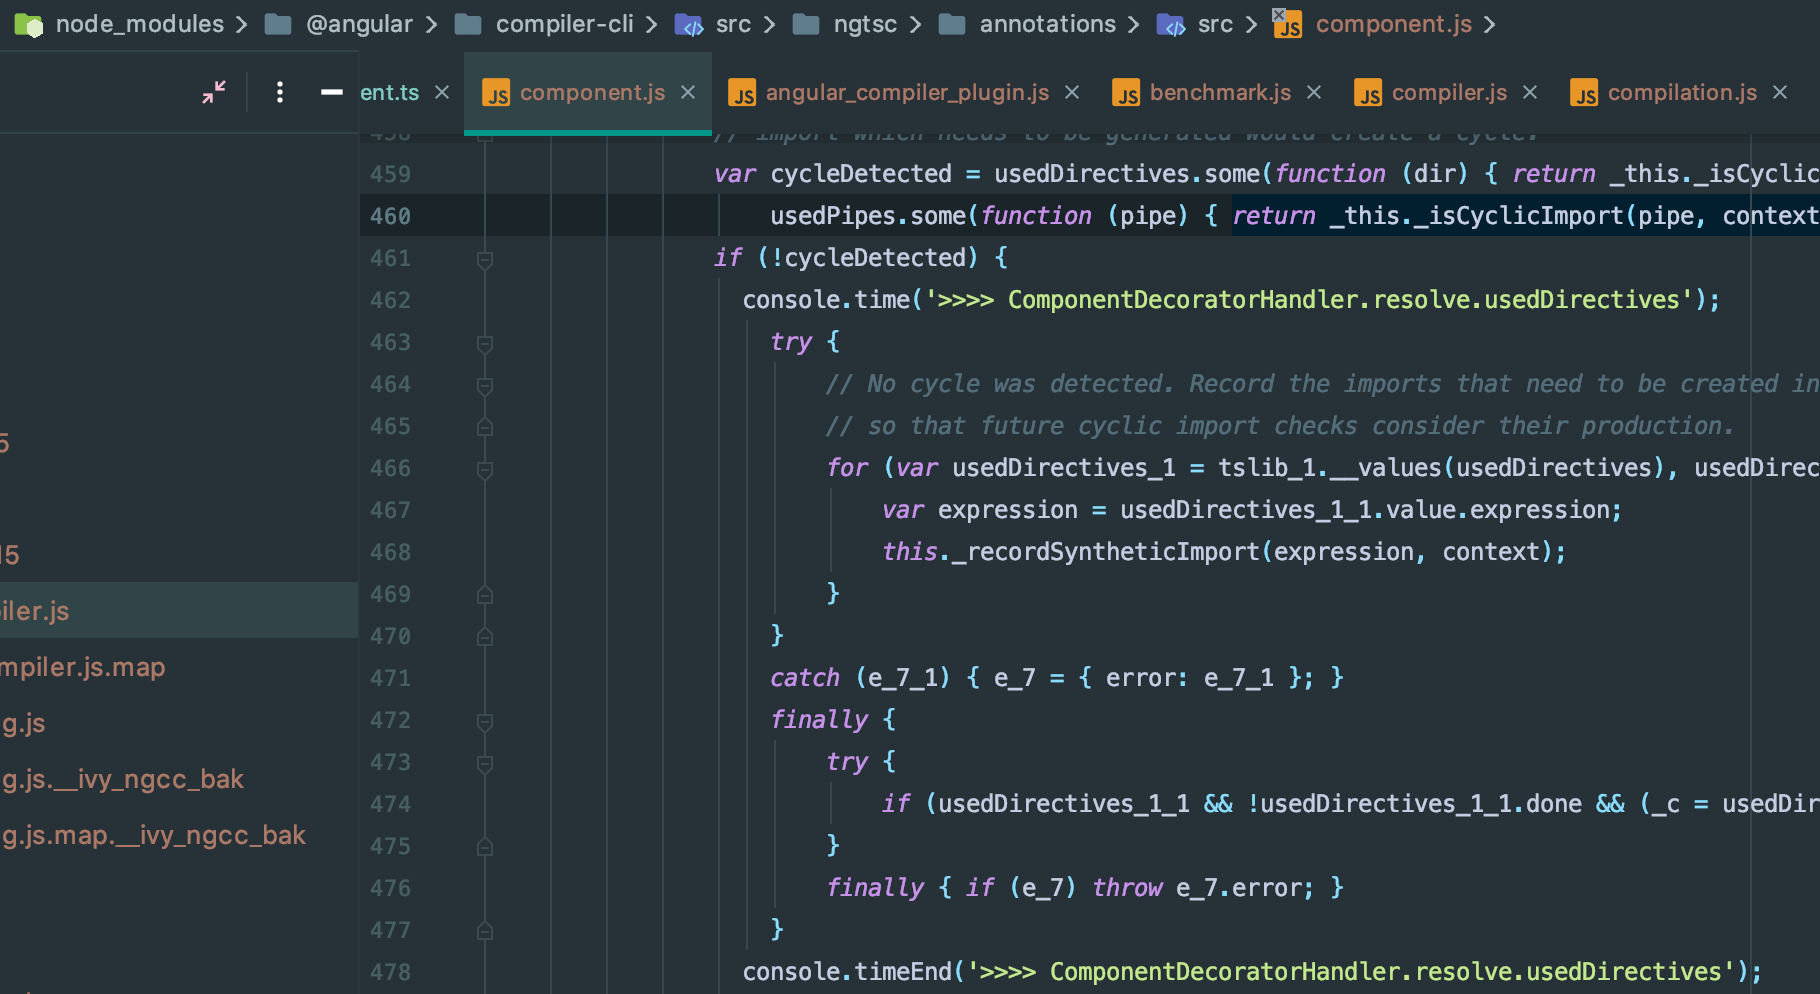 usedPipes
 wrapDirectivesAndPipesInClosure
Sometimes ComponentDecoratorHandler.resolve.usedDirectives and ComponentDecoratorHandler.resolve.usedPipes can execute very long time (check it in log file):
>>>> ComponentDecoratorHandler.resolve.usedDirectives: 23.926ms
>>>> ComponentDecoratorHandler.resolve.usedDirectives: 65.800ms
>>>> ComponentDecoratorHandler.resolve.usedPipes: 11.891ms
>>>> ComponentDecoratorHandler.resolve.usedPipes: 33.837ms
These function called about ~2000 times in our app recompilation process so we can understand that if one usedDirectives and usedPipes processing tooks for example 5ms then whole process will took about 5x2x2000 = 20000ms = 10s.
In our application usedDirectives variable in ComponentDecoratorHandler.resolve method was equal to the value of 43 (maximum) and usedPipes to the value 7 (maximum).
tsc --listFiles says there are 3913 files in typescript compilation. Added files list as assignment.
Main part of tsconfig:
{
  "compilerOptions": {
    "types": [
      "@types/angular",
      "@types/chart.js",
      "@types/core-js",
      "@types/jasmine",
      "@types/jquery",
      "@types/lodash",
      "@types/lru-cache",
      "@types/node",
      "@types/ui-select"
    ],
    "rootDir": ".",
    "baseUrl": ".",
    "moduleResolution": "node",
    "lib": ["es2018", "dom"],
    "module": "esnext",
    "sourceMap": true,
    "allowJs": false,
    "experimentalDecorators": true,
    "esModuleInterop": true,
    "target": "es5",
    "resolveJsonModule": true,
    "allowSyntheticDefaultImports": true,
    "declaration": false
  },
  "angularCompilerOptions": {
    "skipMetadataEmit": true,
    "enableIvy": true,
    "fullTemplateTypeCheck": true
  }
}
I think that any big project can get into this issue with grow of files count which are included to the typescript and angular compilation processes.
What I can’t understand here: why Angular needs to traverse and handle all typescript compilation files when changed files (usually it one file) are known already )? It is looks like Ivy AOT can’t work in incremental mode? How we can boost AOT recompilation without reducing files count?
Please tell me if you will need something else to understand the problem.
🔬 Minimal Reproduction
It is very hard to reproduce it on stackblitz or github🌍 Your Environment
Angular Version:
Angular CLI: 9.0.4
Node: 12.13.1
OS: darwin x64

Angular: 9.0.4
... cli, common, compiler, compiler-cli, core, forms
... platform-browser, platform-browser-dynamic, upgrade
Ivy Workspace: Yes

Package                           Version
-----------------------------------------------------------
@angular-devkit/architect         0.900.1
@angular-devkit/build-angular     0.900.4
@angular-devkit/build-optimizer   0.900.4
@angular-devkit/build-webpack     0.900.4
@angular-devkit/core              9.0.4
@angular-devkit/schematics        9.0.1
@angular/cdk                      9.1.0
@ngtools/webpack                  9.0.4
@schematics/angular               9.0.4
@schematics/update                0.900.4

rxjs                              6.5.3
typescript                        3.7.5
webpack                           4.41.2
Anything else relevant?
Log1 1.log-first-compile.txt Log2 2.log-comp-dec-resolve-used-dirs-and-pipes.txt tsc list files tsc-list-files.txt
Issue Analytics
- State:

- Created 4 years ago
- Reactions:17
- Comments:13 (9 by maintainers)
 Top Related StackOverflow Question
 Troubleshoot Live Code
 Top Related Reddit Thread
 Top Related Hackernoon Post
 Top Related Tweet
 Top Related Dev.to Post
 Top Related Hashnode Post
Thank you very much for the detailed report! I have seen similar performance bottlenecks in earlier reports, e.g. #34867. The cyclic import computation is particularly slow as it is module resolution heavy (and therefore I/O intensive) and deep transitive module scopes are also introducing perf hotspots.
I suspect this is fixed (or at least significantly improved) in Angular 10 via ecffc3557.