
Lightrun Answers was designed to reduce the constant googling that comes with debugging 3rd party libraries. It collects links to all the places you might be looking at while hunting down a tough bug.
And, if you’re still stuck at the end, we’re happy to hop on a call to see how we can help out.
KIS tasks in 0.15.1 RC2 sometimes duplicate rows with the same dimension values
See original GitHub issueAffected Version
0.15.1 RC2
Description
CSV of Results: query-943282d6-3b66-4881-8080-355b09600870.zip
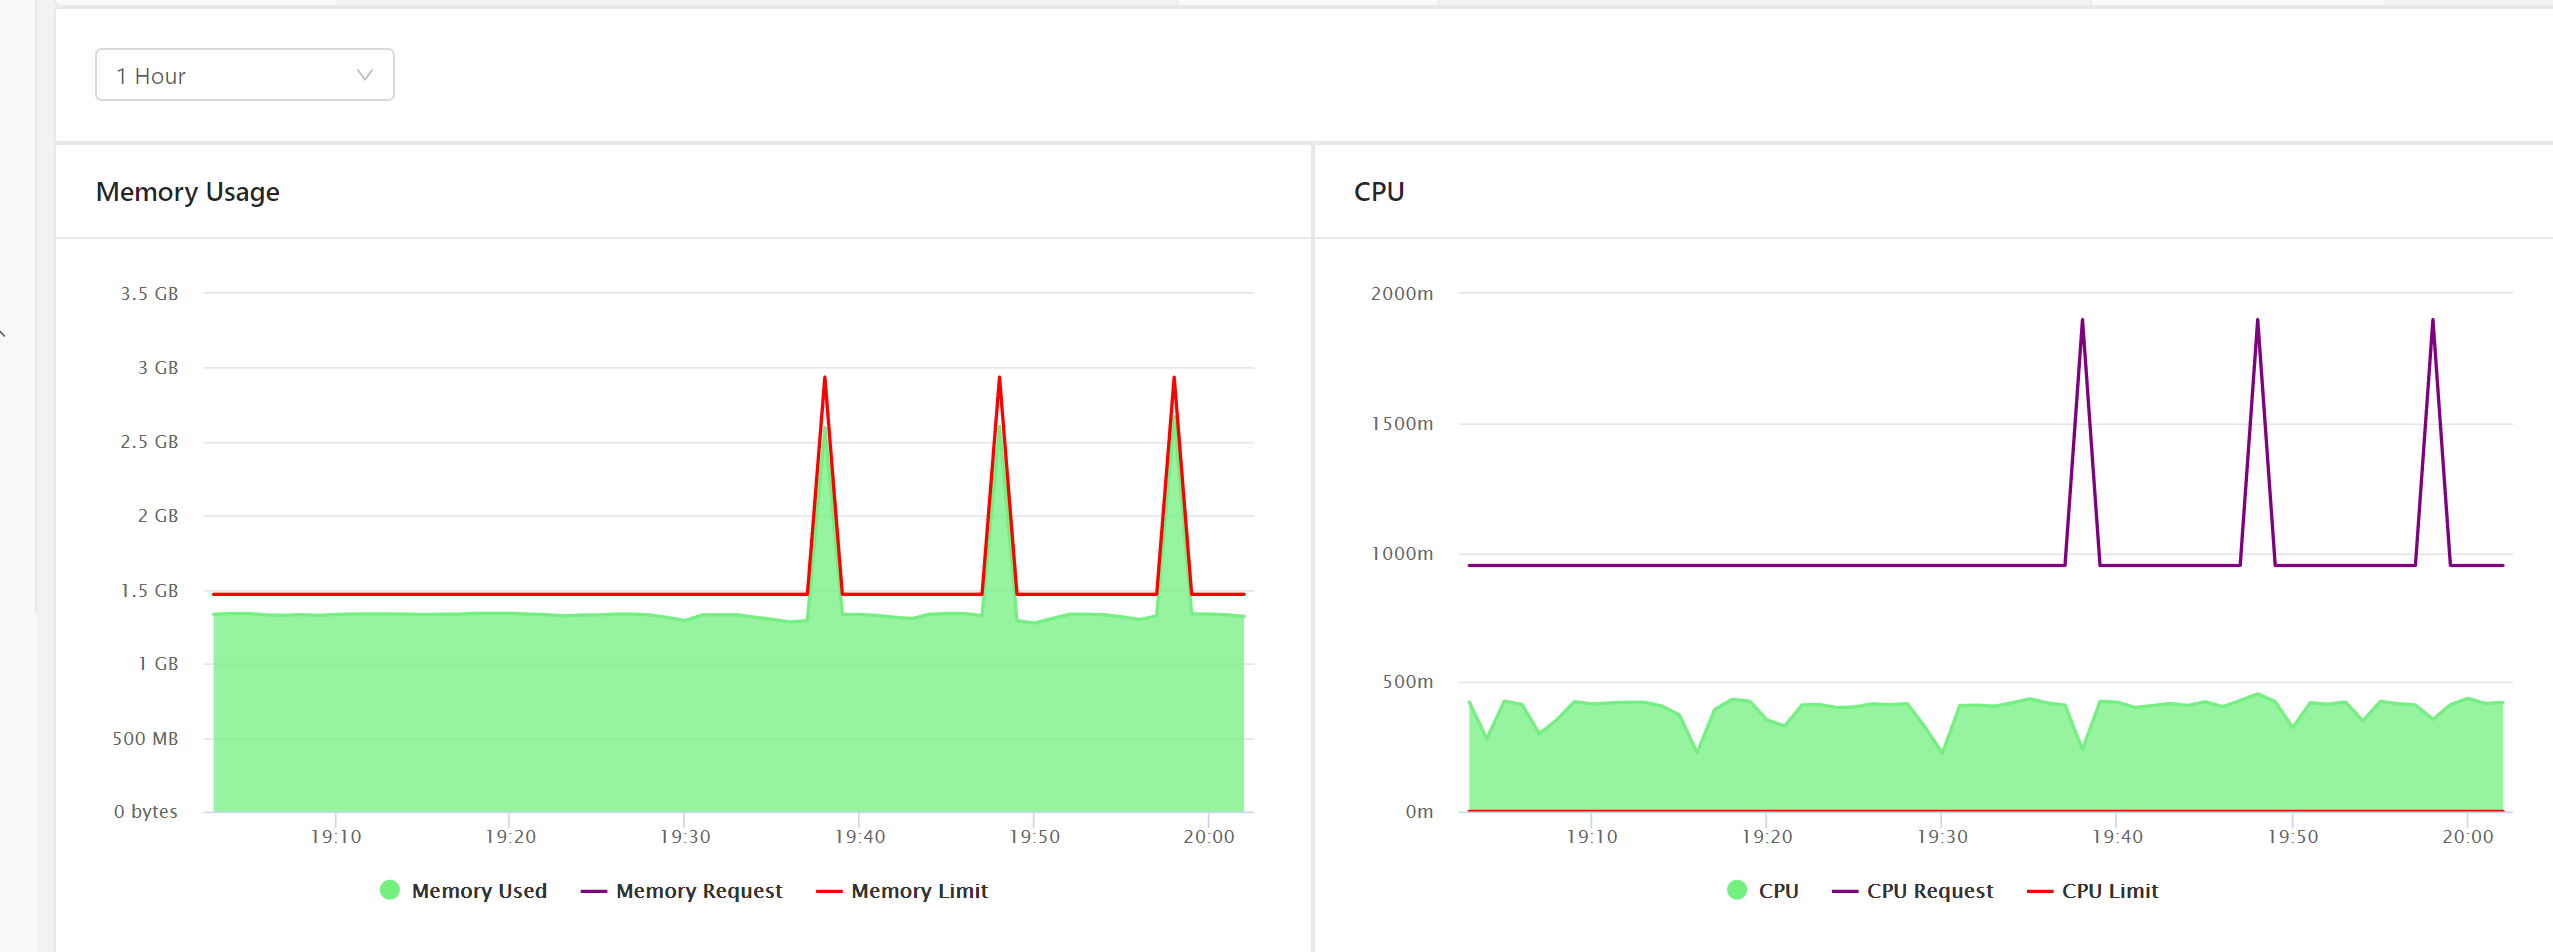
Note that there are 2 rows for timestamp 2019-08-09T02:38:00.000Z, even though the dimensions have the exact same value. In fact, for some reason, the rows are fully duplicated for that time period.
This reflects in charts as values are doubled and it happens pretty often. We noticed it when we saw random spikes in charts when using the aggregated data source. These spikes happen whenever druid duplicates the rows
SQL
SELECT *
 FROM "kube-metrics-minute"
 WHERE accountid='52c7e28eebb26a86fb1505b5' AND
 "__time" >= TIMESTAMP '2019-08-09 02:37:00' AND "__time" < TIMESTAMP '2019-08-09 02:40:00'
 AND cluster='ds' AND etype='container' AND namespace='default' AND name='app-alertproc' AND pod='alertproc-deployment-65f59b6b8-gc57m'
Generated query (shown in router web console)
{
  "queryType": "scan",
  "dataSource": {
    "type": "table",
    "name": "kube-metrics-minute"
  },
  "intervals": {
    "type": "intervals",
    "intervals": [
      "2019-08-09T02:37:00.000Z/2019-08-09T02:40:00.000Z"
    ]
  },
  "virtualColumns": [],
  "resultFormat": "compactedList",
  "batchSize": 20480,
  "limit": 9223372036854776000,
  "order": "none",
  "filter": {
    "type": "and",
    "fields": [
      {
        "type": "selector",
        "dimension": "accountid",
        "value": "52c7e28eebb26a86fb1505b5",
        "extractionFn": null
      },
      {
        "type": "selector",
        "dimension": "cluster",
        "value": "ds",
        "extractionFn": null
      },
      {
        "type": "selector",
        "dimension": "etype",
        "value": "container",
        "extractionFn": null
      },
      {
        "type": "selector",
        "dimension": "namespace",
        "value": "default",
        "extractionFn": null
      },
      {
        "type": "selector",
        "dimension": "name",
        "value": "app-alertproc",
        "extractionFn": null
      },
      {
        "type": "selector",
        "dimension": "pod",
        "value": "alertproc-deployment-65f59b6b8-gc57m",
        "extractionFn": null
      }
    ]
  },
  "columns": [
    "__time",
    "accountid",
    "alloc_cpu",
    "alloc_mem",
    "alloc_pods",
    "cap_cpu",
    "cap_mem",
    "cap_pods",
    "cluster",
    "count",
    "cpu",
    "etype",
    "image",
    "labels",
    "lim_cpu",
    "lim_mem",
    "mem_limit",
    "mem_used",
    "name",
    "namespace",
    "node",
    "node_pool",
    "owner",
    "owner_kind",
    "pod",
    "req_cpu",
    "req_mem",
    "rxBytes",
    "txBytes"
  ],
  "legacy": false,
  "context": {
    "sqlQueryId": "f39f0b78-bb97-4c81-b9dd-7e0e2abf0b46"
  },
  "descending": false,
  "granularity": {
    "type": "all"
  }
}
Supervisor task spec:
{
  "type": "kafka",
  "dataSchema": {
    "dataSource": "kube-metrics-minute",
    "parser": {
      "type": "string",
      "parseSpec": {
        "format": "json",
        "timestampSpec": {
          "column": "timestamp",
          "format": "auto"
        },
        "dimensionsSpec": {
          "dimensions": [
            "accountid",
            "cluster",
            "name",
            "namespace",
            "etype",
            "labels",
            "owner",
            "owner_kind",
            "node",
            "image",
            "pod",
            "node_pool"
          ]
        }
      }
    },
    "metricsSpec": [
      {
        "name": "count",
        "type": "count"
      },
      {
        "name": "req_cpu",
        "fieldName": "req_cpu",
        "type": "floatMax"
      },
      {
        "name": "req_mem",
        "fieldName": "req_mem",
        "type": "longMax"
      },
      {
        "name": "lim_cpu",
        "fieldName": "lim_cpu",
        "type": "floatMax"
      },
      {
        "name": "lim_mem",
        "fieldName": "lim_mem",
        "type": "longMax"
      },
      {
        "name": "cap_cpu",
        "fieldName": "cap_cpu",
        "type": "floatMax"
      },
      {
        "name": "cap_mem",
        "fieldName": "cap_mem",
        "type": "longMax"
      },
      {
        "name": "cap_pods",
        "fieldName": "cap_pods",
        "type": "floatMax"
      },
      {
        "name": "alloc_cpu",
        "fieldName": "alloc_cpu",
        "type": "floatMax"
      },
      {
        "name": "alloc_mem",
        "fieldName": "alloc_mem",
        "type": "longMax"
      },
      {
        "name": "alloc_pods",
        "fieldName": "alloc_pods",
        "type": "floatMax"
      },
      {
        "name": "cpu",
        "fieldName": "cpu",
        "type": "doubleMax"
      },
      {
        "name": "rxBytes",
        "fieldName": "rxBytes",
        "type": "longMax"
      },
      {
        "name": "txBytes",
        "fieldName": "txBytes",
        "type": "longMax"
      },
      {
        "name": "mem_used",
        "fieldName": "mem_used",
        "type": "longMax"
      },
      {
        "name": "mem_limit",
        "fieldName": "mem_limit",
        "type": "longMax"
      }
    ],
    "granularitySpec": {
      "type": "uniform",
      "segmentGranularity": {"type": "period", "period": "PT4H"},
      "queryGranularity": "MINUTE"
    }
  },
  "tuningConfig": {
    "type": "kafka",
    "maxRowsPerSegment": 5000000
  },
  "ioConfig": {
    "topic": "kube-metrics",
    "consumerProperties": {
      "bootstrap.servers": "xx"
    },
    "taskCount": 1,
    "replicas": 2,
    "taskDuration": "PT4H"
  }
}
Issue Analytics
- State:

- Created 4 years ago
- Comments:22 (21 by maintainers)
 Top Related StackOverflow Question
 Troubleshoot Live Code
 Top Related Reddit Thread
 Top Related Hackernoon Post
 Top Related Tweet
 Top Related Dev.to Post
 Top Related Hashnode Post
With Kafka ingestion, it’s possible that rollup is not 100%, due to the incremental publishing, e.g.:
{"timestamp":"2019-08-09 14:00:00", "dim1":"hello", "metric":1}{"timestamp":"2019-08-09 14:00:00", "dim1":"hello", "metric":2}arrives, it won’t be rolled up into the first already published segment, and a non-aggregating query would return both of those rowsIf you run an exact aggregating query like:
does the sum on CPU return the expected value?
You could compare the results of that query across the minute/second/30m datasources and see if they match, to rule out imperfect rollup from incremental publishes.
Hi, I’m having the same kind of problem and came across this issue except that in my case the data isn’t duplicated, only the timestamp, and (being very new to druid) I’m not sure I can tell what the solution was here?
I’m aggregating values byThe data is being consumed from a Kafka topic which has entries thrown onto it every ~30 seconds at the moment for testing. Any help would be appreciated, thank you!longMaxfor one-minute intervals and the duplicate data is causing a pretty big issue since I’m trying to determine a rate & graph it. I attempted to set the intermediate persist interval higher to see if that would help but it doesn’t seem like that’s the case. also attempted to turn on compaction but I feel like I must have done that incorrectly since I don’t think the task has actually run once, but since the data is real time I’m not even sure that helps in my case since we want the most up to date data as possible and having such large spikes that dwarf the rest of the graph is making it pretty unreadable (aspandasis adding the two values with the same timestamp together).edit: turns out I was accidentally using
longsuminstead oflongmaxin my query (its stilllongMaxin the schema) which was combining the values, notpandas, so the returned values are OK now but I’d still like to avoid having duplicate data stored in the segments if possible. As for the compaction task, it looks like its started running but it hasn’t removed any of the duplicate values