question-mark
Stuck on an issue?

Lightrun Answers was designed to reduce the constant googling that comes with debugging 3rd party libraries. It collects links to all the places you might be looking at while hunting down a tough bug.

And, if you’re still stuck at the end, we’re happy to hop on a call to see how we can help out.

Axis tick auto align on multiaxis

See original GitHub issue

What problem does this feature solve?

I want to have a functionality which allows the user to have the same number of ticks on every parallel axis.

i.e. I have 2 yAxis, but the auto ticks calculation gives me 6 ticks for one axis and 5 for the other. The difference creates irregular spacings between the split lines, which is not really good for user experience.

Here is the sample option code:

option = {
  "xAxis": [
    {
      "data": ["test"]
    }
  ],
  "yAxis": [
    {
      "name": "A",
    },
    {
      "name": "B",
    }
  ],
  "series": [
    {
      "name": "A",
      "type": "bar",
      "data": [
        275500000,
      ],
      "yAxisIndex": 0
    },
    {
      "name": "B",
      "type": "bar",
      "data": [
        2289000000
      ],
      "yAxisIndex": 1
    },
  ]
}

And here is the sample result: ECharts-tick-Align.jpg
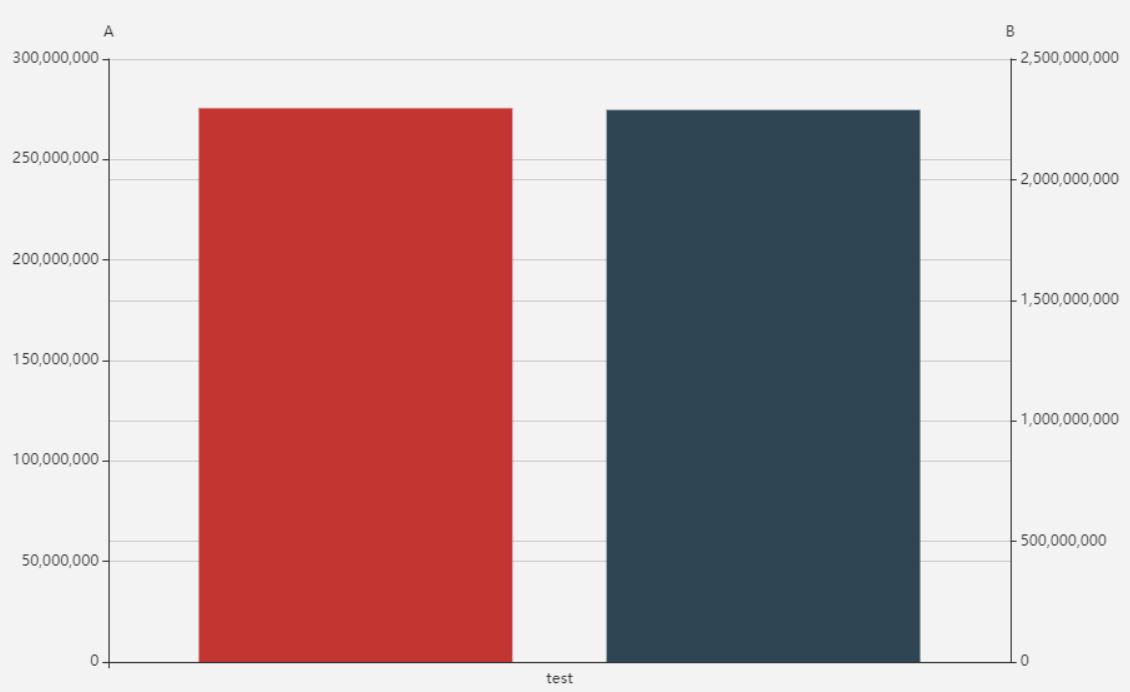
My request is based on the HighCharts library, which provides an API called alignTicks, which does the same thing as I described here.

What does the proposed API look like?

Let’s say we have a boolean attribute yAxis.axisAutoAlign. By setting it to true, its ticks will get aligned with every other axis in the yAxis array which has the same boolean to true. That way, if one of the axis has 6 ticks, all the other axis will also have 6 ticks and get nicely aligned altogether.

Issue Analytics

  • State:closed
  • Created 4 years ago
  • Reactions:3
  • Comments:7 (2 by maintainers)

github_iconTop GitHub Comments

1reaction
susiwen8commented, Jun 25, 2021

@tidemarks 这个改动影响面很大,需要很多验证,所以短期不会合入。

1reaction
Oviliacommented, Sep 24, 2019

This is an important feature and we should have some further discussion about it. Probably it’s not easy to implement this and may be done in v5.0.

Read more comments on GitHub >

github_iconTop Results From Across the Web

Axis tick auto align on multiaxis · Issue #10928 · apache/echarts
Let's say we have a boolean attribute yAxis.axisAutoAlign . By setting it to true, its ticks will get aligned with every other axis...
Read more >
How do I align gridlines for two y-axis scales using Matplotlib?
I created a method to align the ticks of multiple y- axes (could be more ... comb_ticks.sort() locator=MaxNLocator(nbins='auto', steps=[1, 2, 2.5, 3, 4,...
Read more >
Common tick options to all cartesian axes - Chart.js
Name Type Default align string 'center' crossAlign string 'near' sampleSize number ticks.length
Read more >
Graph Secondary Axis align to zero of primary axis
The automatic secondary axis boundaries go from +100% to -200% with gaps (major units) of 50%. Thus, two gaps above 0 and four...
Read more >
Axes – amCharts 5 Documentation
This tutorial looks into how to get the most of the axes on an XY chart. ... Like many axis elements, ticks are...
Read more >

github_iconTop Related Medium Post

No results found

github_iconTop Related StackOverflow Question

No results found

github_iconTroubleshoot Live Code

Lightrun enables developers to add logs, metrics and snapshots to live code - no restarts or redeploys required.
Start Free

github_iconTop Related Reddit Thread

No results found

github_iconTop Related Hackernoon Post

No results found

github_iconTop Related Tweet

No results found

github_iconTop Related Dev.to Post

No results found

github_iconTop Related Hashnode Post

No results found