
Lightrun Answers was designed to reduce the constant googling that comes with debugging 3rd party libraries. It collects links to all the places you might be looking at while hunting down a tough bug.
And, if you’re still stuck at the end, we’re happy to hop on a call to see how we can help out.
Chart IDs not updated in native_filter_configuration when importing dashboard
See original GitHub issueProblem reproduced with Superset 1.4rc4 with VERSIONED_EXPORT and DASHBOARD_NATIVE_FILTERS enabled - both are related to the problem.
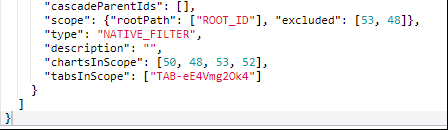
The native_filter_configuration section in dashboard’s json metadata contains two fields that refer to charts with numeric IDs (chartsInScope and scope.excluded). When exporting and then importing a such a dashboard, while charts get new numeric IDs, the IDs are not updated. As a result the filter scoping definitions might be affected.
How to reproduce the bug
- Install Superset 1.4rc4 with demo dashboards and VERSIONED_EXPORT, DASHBOARD_NATIVE_FILTERS feature flags enabled
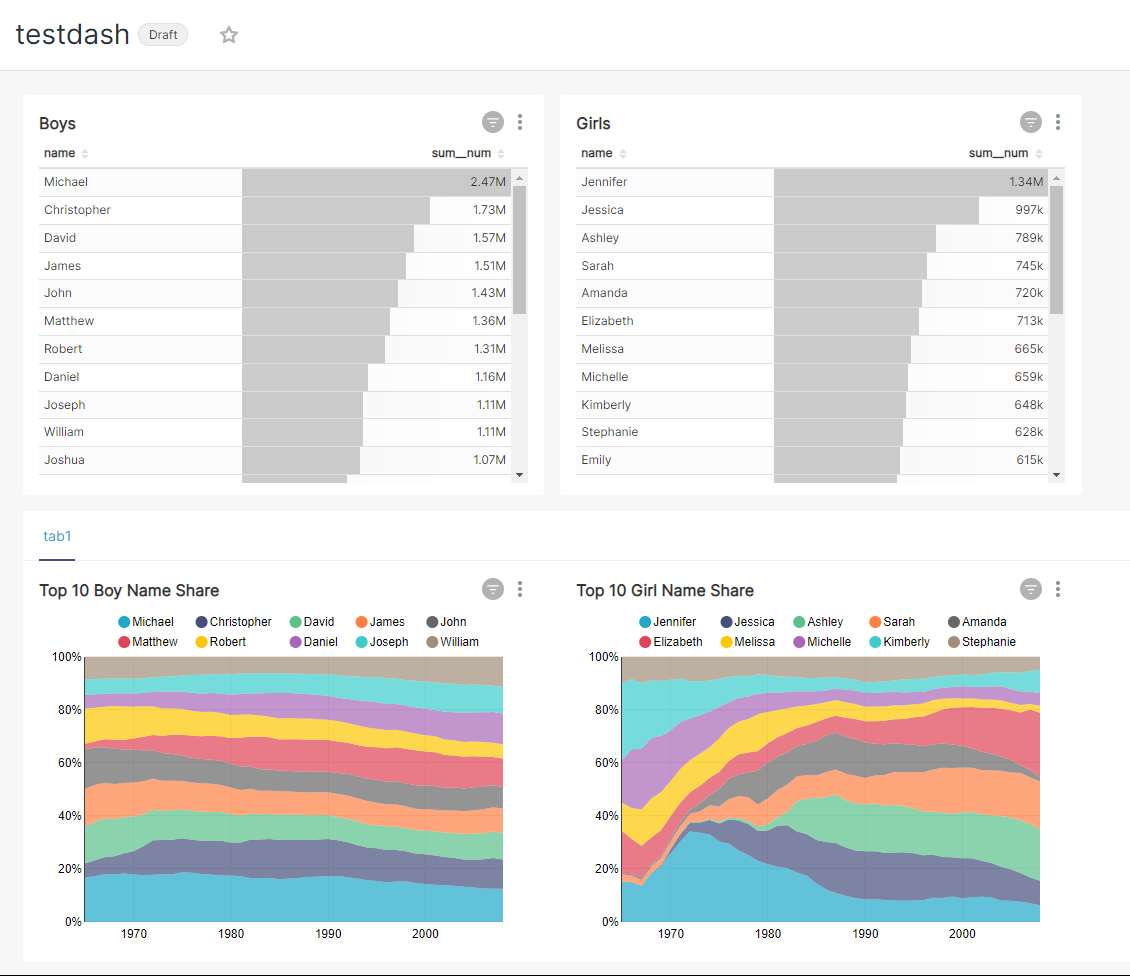
- Create a new dashboard
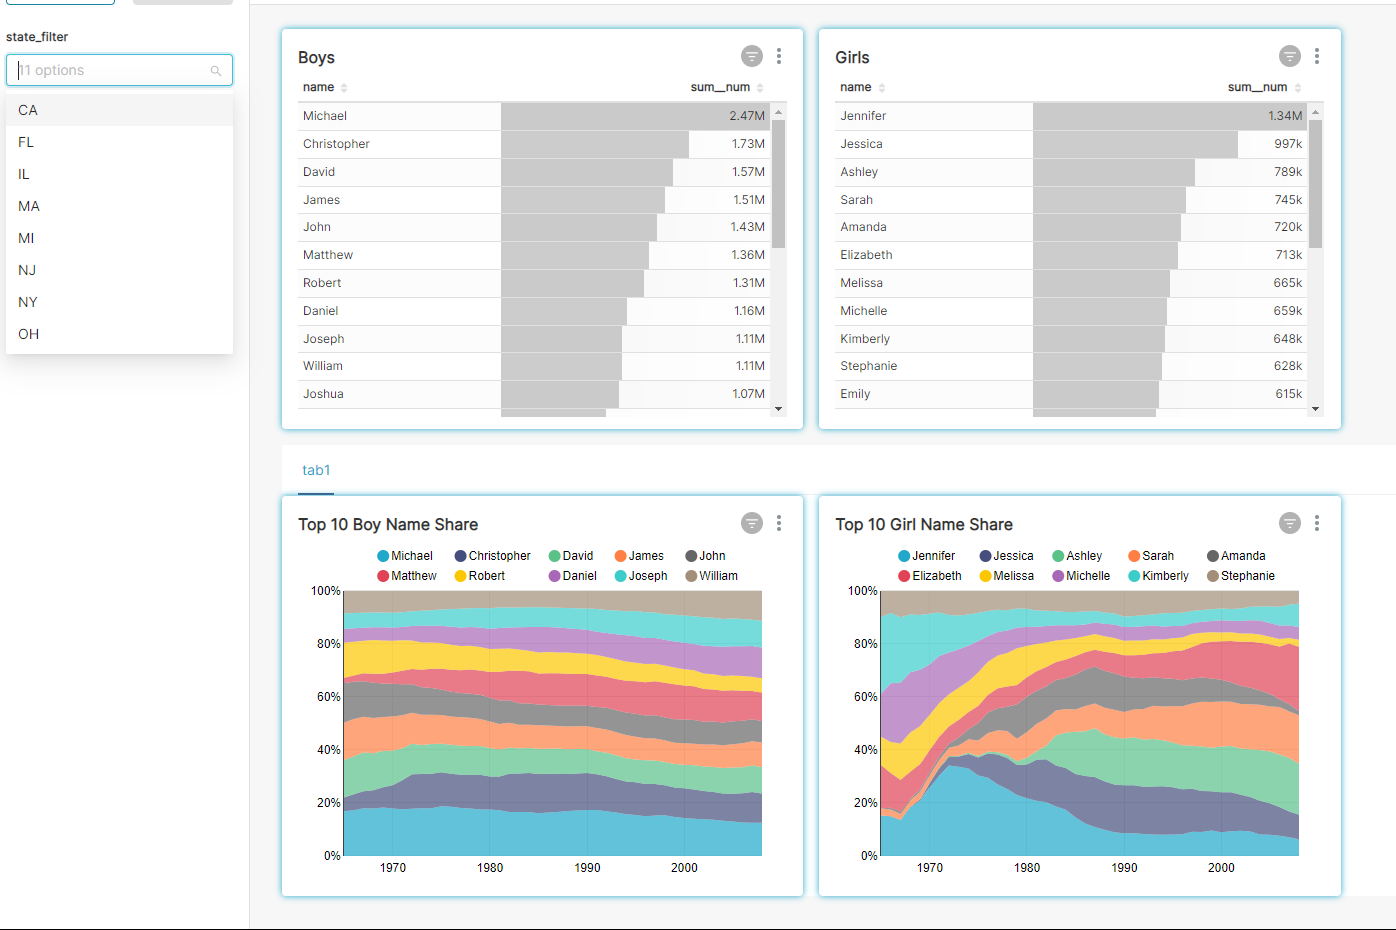
- Add 2 charts (Boys, Girls) to the dashboard
- Add a Tab component
- Add 2 charts (Top 10 Boy Name Share, Top 1-- Girl Name Share) to the Tab component
- Save the dashboard
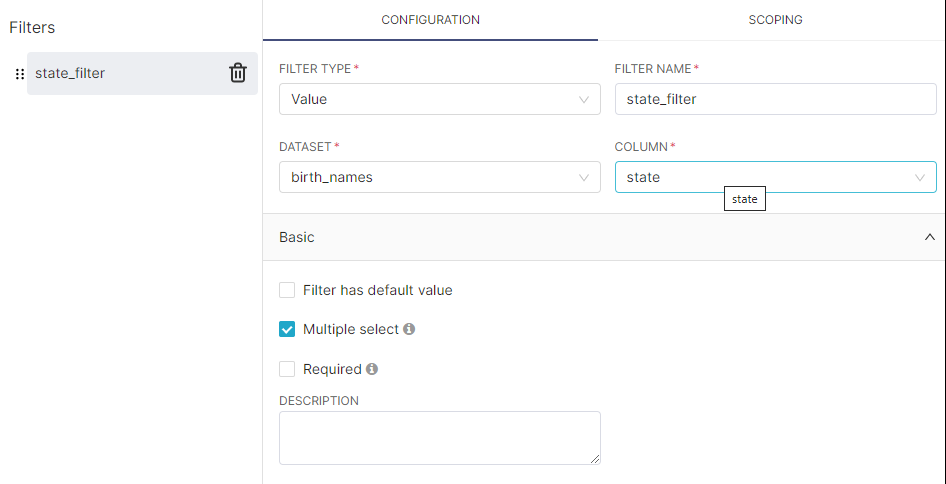
- Add a dashboard native filter on dataset “birth_names” and column “state”
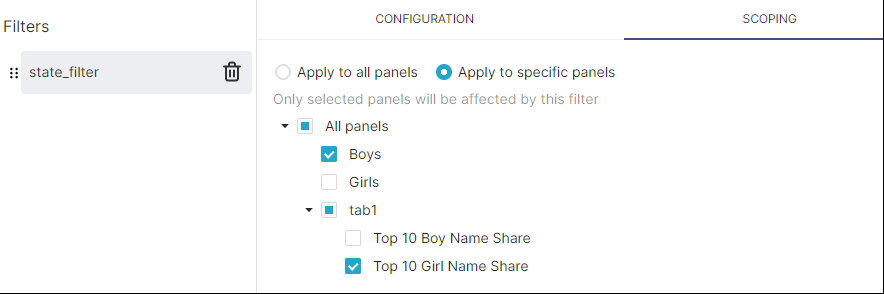
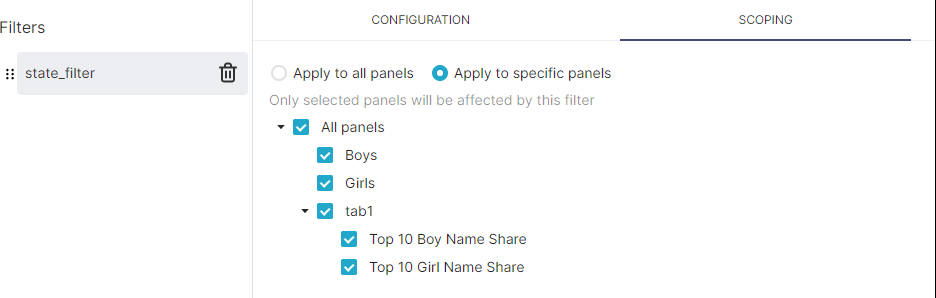
- Alter the scope of the filter to include only “boys” and “Top 10 Girl Name Share” and save
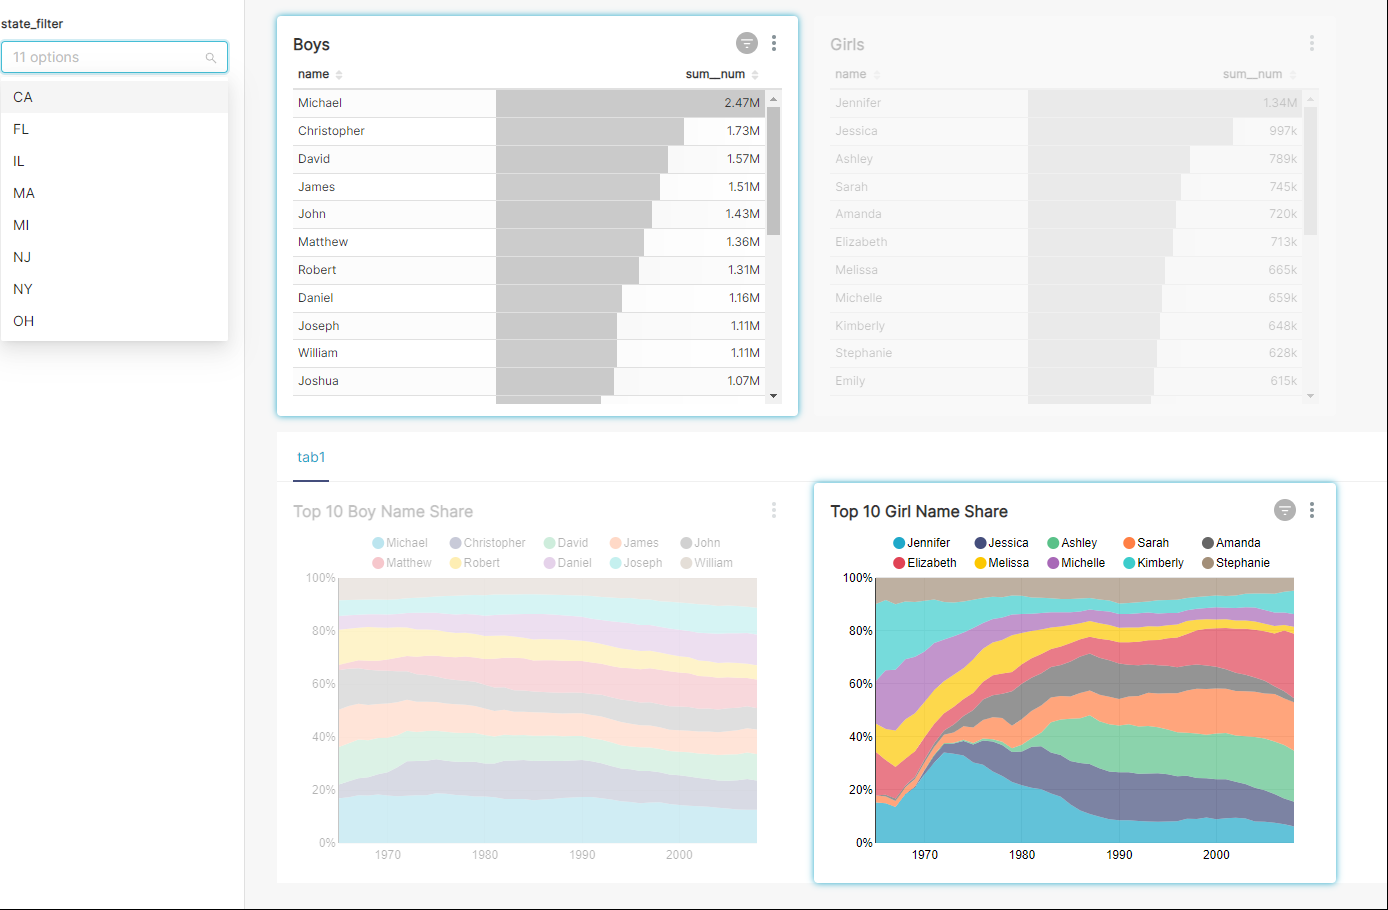
 The filter is only applied to the desired charts
- Check the dashboard properties JSON METADATA - The native_filter_configuration contains references to numeric IDs of the charts (“chartsInScope” and “scope”.“excluded”)
- Export the dashboard.
- Delete all charts and dashboards
- Import the exported dashboard -> notice that the numeric Ids of the 4 charts are now different (133, 134, 135, 136 in my case)
- Open the dashboard and activate the filter
Expected results
- The same two charts should be highlighted as after step 8
Actual results
- After step 13 all charts are highlighted (are in scope of the filter)
- After checking filter scoping:
- After checking the JSON METADATA - still old IDs:

Screenshots
Added in the steps
Environment
- browser type and version: Microsoft Edge 96.0.1054.43
- superset version:
superset version: 1.4rc4 - python version:
python --version - node.js version:
node -v - any feature flags active: VERSIONED_EXPORT, DASHBOARD_NATIVE_FILTERS, DASHBOARD_RBAC
Checklist
Make sure to follow these steps before submitting your issue - thank you!
- I have checked the superset logs for python stacktraces and included it here as text if there are any.
- I have reproduced the issue with at least the latest released version of superset.
- I have checked the issue tracker for the same issue and I haven’t found one similar.
Additional context
The problem can be partially reproduced with just two charts and without the tab component, but in this situation only one of the two fields with numeric IDs will be present in the dashboard’s json metadata. Adding the tab component allows to see also the “scope”.“excluded” field.
Issue Analytics
- State:

- Created 2 years ago
- Reactions:2
- Comments:6 (4 by maintainers)
 Top Related StackOverflow Question
 Troubleshoot Live Code
 Top Related Reddit Thread
 Top Related Hackernoon Post
 Top Related Tweet
 Top Related Dev.to Post
 Top Related Hashnode Post
Thanks for reporting this issue. 1.4.0 is based off 1.4.0rc4, so I would expect the bug to be in 1.4.0 as well. I’ll add this to the open list of bugs for 1.4.1 and we’ll see if someone can pick it up before we prepare the release.
cc @villebro. Is this bug on your radar for 1.4.2?