
Lightrun Answers was designed to reduce the constant googling that comes with debugging 3rd party libraries. It collects links to all the places you might be looking at while hunting down a tough bug.
And, if you’re still stuck at the end, we’re happy to hop on a call to see how we can help out.
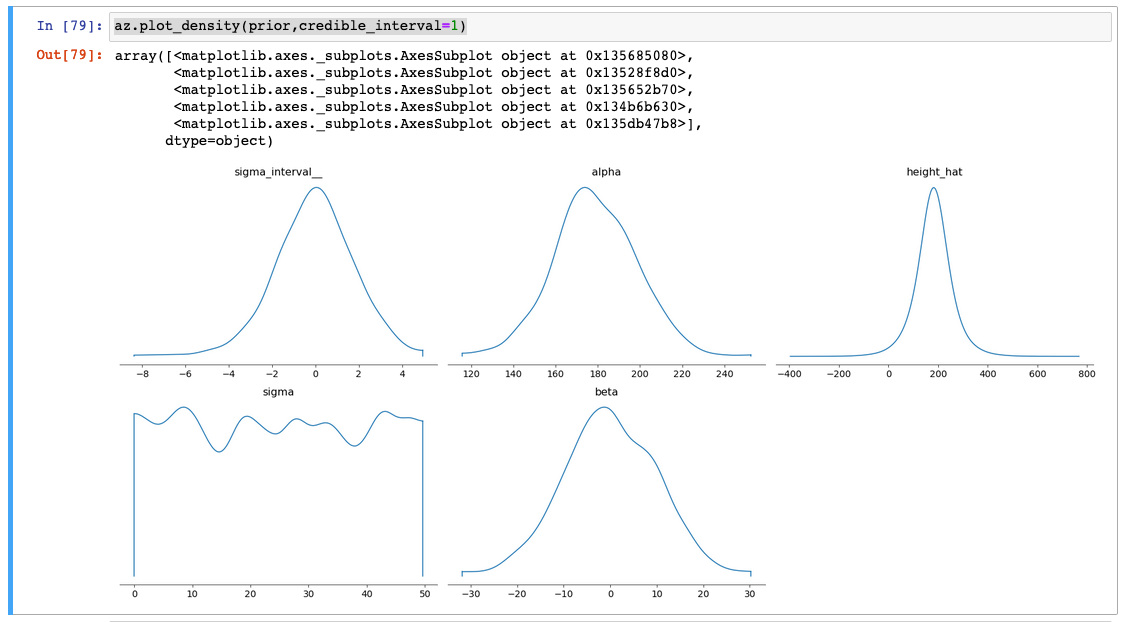
plot_density function doesn't work for predictive prior unless credible interval is specified as 1
See original GitHub issueDescribe the bug When attempt to plot prior predictive distributions using plot_density function, plots show nothin unless credible interval is defined as 1
To Reproduce
az.plot_density(prior,credible_interval=1)
az.plot_density(prior)
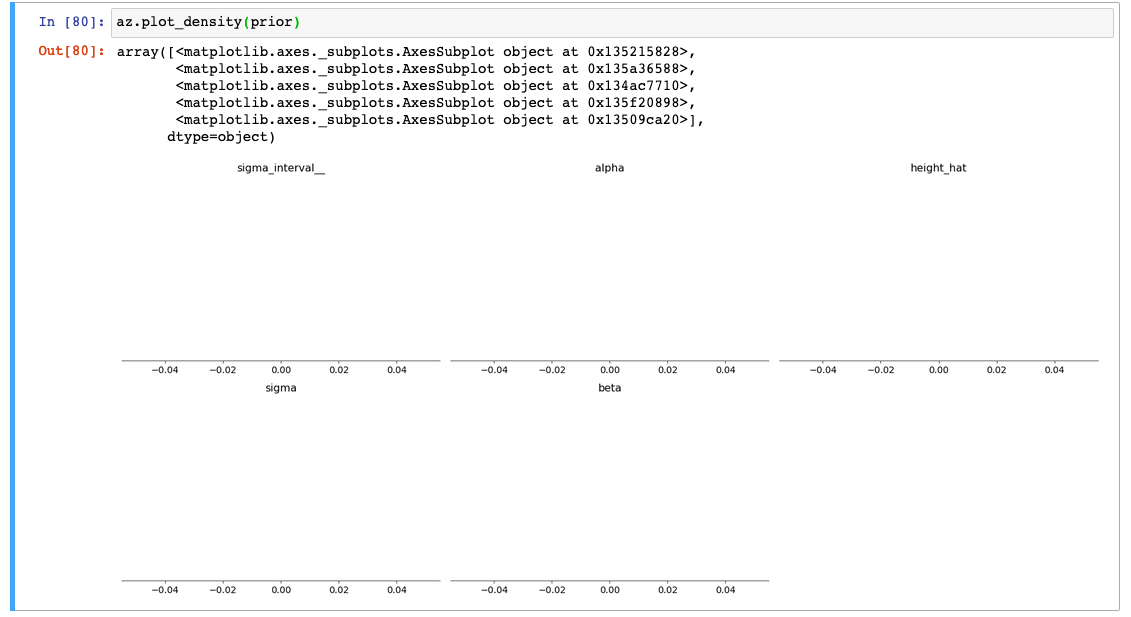
Expected behavior Expected that the plot should only contain the 0.89 credible interval, instead of blank plots
Additional context arviz 0.7.0 pymc3 3.8 matplotlib 3.2.1
also using
%matplotlib inline
Issue Analytics
- State:

- Created 3 years ago
- Comments:5 (3 by maintainers)
 Top Related StackOverflow Question
 Troubleshoot Live Code
 Top Related Reddit Thread
 Top Related Hackernoon Post
 Top Related Tweet
 Top Related Dev.to Post
 Top Related Hashnode Post
Thanks for the example. Now I can confirm the issue. I will work on this and keep you posted. In the meantime you can do this:
data = az.from_pymc3(posterior_1, prior=prior, posterior_predictive=posterior_pred_1)data will be an ArviZ’s InferenceData object
you can then pass it to arviz functions, for example.
az.summary(data)or
az.plot_density(data.prior)or equivalentlyaz.plot_density(data, group=prior)the default group isposteriorthusaz.plot_density(data)will give you a plot of the posterior.One tip, you can globally set a few arviz parameters using
az.rcParams, so for example you can addaz.rcParams["stats.credible_interval"] = 0.89at the beginning, and then all plots and summaries will use this value instead of the default one (0.94).My guess about statistical rethinking is because the credible interval of .89 is used by the book even when the most common default value is 0.95. ArviZ and Statistical rethinking both uses non common values to remind user of the arbitrary nature of any default value.
Your report was very good. You clearly stated the problem and the excepted outcome. A reproducible (simple) example always helps.
Closing as the recommended workflow is to generate the idata object.