
Lightrun Answers was designed to reduce the constant googling that comes with debugging 3rd party libraries. It collects links to all the places you might be looking at while hunting down a tough bug.
And, if you’re still stuck at the end, we’re happy to hop on a call to see how we can help out.
Get an error when trying the AWS tutorial for running a Lambda locally under SAM with vscode codelens
See original GitHub issueDescription
Using the vscode codelens “Debug locally” optiion to debug the simple hello-world node example gives an error.
Steps to reproduce
Follow the steps described in this short video tutorial exactly, but choose the nodejs12.x runtime. When you finally click the “Debug locally” CodeLense option above the exports.lambdaHandler = async (event, context) => { the error will be produced in the “Debug console”.
The steps listed are:
- open a bash terminal in WSL
- cd to a directory you’d keep your projects in (for me /c/var/www/lambda)
- In vscode CTRL-SHIFT-P
- Select “AWS: Create new SAM application”
- Select node12.x as SAM Application Runtime
- Select ASW SAM Hello World as SAM Application Template
- Enter . as the workspace folder for the new project
- Click okay at the path confirmation /c/var/www/lambda/
- enter sam-app as the name of your new app
- In vscode, edit the sam-app/hello-world/app.js file
- Insert a new line after line 19 and add
console.log("We got here!"); - Place a breakpoint on this new line
- Click Configure in the CodeLens options above the
exports.lambdaHandler = async (event, context) => { - Click on the TERMINAL link when placed into the editor fore template.json
- enter
sam local generate-event apigateway aws-proxy | clip6 select the {} in the"event": {},in templates.json and paste in the clipboard - ALT-SHIFT-F to auto format
- Now click the ``Debug Locally"" CodeLens option in the app.js file
Observed result
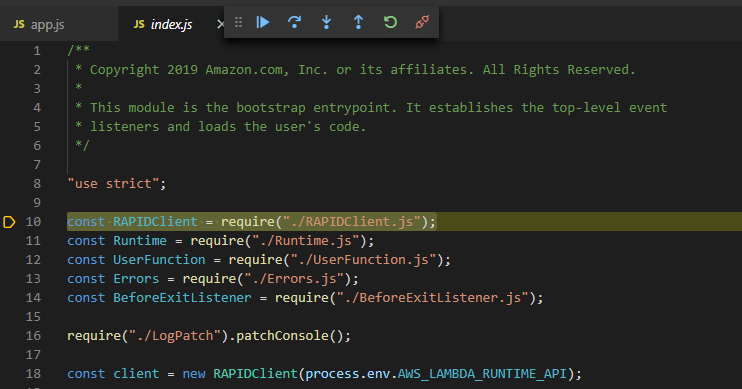
The debugger first stops at the line
const RAPIDClient = require(“./RAPIDClient.js”);
in file index.js
 After clicking the continue button in
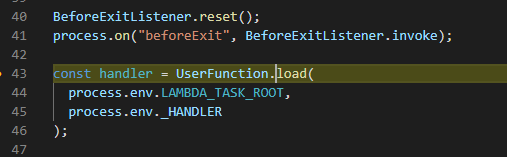
 it gets here
 the clicking continue again gives the error below in the DEBUG CONSOLE
2020-05-10T16:33:02.723Z	undefined	ERROR	Uncaught Exception 	{"errorType":"Runtime.ImportModuleError","errorMessage":"Error: Cannot find module 'app'\nRequire stack:\n- /var/runtime/UserFunction.js\n- /var/runtime/index.js","stack":["Runtime.ImportModuleError: Error: Cannot find module 'app'","Require stack:","- /var/runtime/UserFunction.js","- /var/runtime/index.js","    at _loadUserApp (/var/runtime/UserFunction.js:100:13)","    at Object.load (/var/runtime/UserFunction.js:140:17)","    at Object.<anonymous> (/var/runtime/index.js:43:30)","    at Module._compile (internal/modules/cjs/loader.js:1153:14)","    at Object..js (internal/modules/cjs/loader.js:1176:10)","    at Module.load (internal/modules/cjs/loader.js:1000:32)","    at Function._load (internal/modules/cjs/loader.js:899:14)","    at Function.executeUserEntryPoint [as runMain] (internal/modules/run_main.js:74:12)","    at internal/main/run_main_module.js:18:47"]}
START RequestId: b9a1ab35-1c23-10e5-fcfb-b89d7e57ac38 Version: $LATEST
END RequestId: b9a1ab35-1c23-10e5-fcfb-b89d7e57ac38
REPORT RequestId: b9a1ab35-1c23-10e5-fcfb-b89d7e57ac38	Init Duration: 20909.03 ms	Duration: 1.53 ms	Billed Duration: 100 ms	Memory Size: 128 MB	Max Memory Used: 42 MB

{"errorType":"Runtime.ImportModuleError","errorMessage":"Error: Cannot find module 'app'\nRequire stack:\n- /var/runtime/UserFunction.js\n- /var/runtime/index.js"}
Expected result
I expected the working result they show in the video, which was that the debugger stops at the breakpoint on the console.log("AM is the coolest"); statement.
Additional environment details (Ex: Windows, Mac, Amazon Linux etc)
- OS: Windows 10 Pro 1909 (Build 18363.815)
sam --version: SAM CLI, version 0.48.0- WSL bash: $ docker --version Docker version 19.03.8, build afacb8b7f0 (as client)
- Windows DockerDesktop version 2.2.0.5 (43884) Stable
- vscode: Version: 1.45.0 (system setup) Commit: d69a79b73808559a91206d73d7717ff5f798f23c Date: 2020-05-07T16:18:48.860Z Electron: 7.2.4 Chrome: 78.0.3904.130 Node.js: 12.8.1 V8: 7.8.279.23-electron.0 OS: Windows_NT x64 10.0.18363
Add --debug flag to command you are running
Issue Analytics
- State:

- Created 3 years ago
- Reactions:2
- Comments:15 (4 by maintainers)
 Top Related StackOverflow Question
 Troubleshoot Live Code
 Top Related Reddit Thread
 Top Related Hackernoon Post
 Top Related Tweet
 Top Related Dev.to Post
 Top Related Hashnode Post
any idea why it always breaks in /var/runtime/index.js line 10??
const RAPIDClient = require("./RAPIDClient.js");@ikamal-pxl @vgjenks Not sure why, but this seems to fix the issue:
Run the debugger. After it breaks, in the “CALL STACK” section, right click the second entry from the top and click “Exclude Caller”.