
Lightrun Answers was designed to reduce the constant googling that comes with debugging 3rd party libraries. It collects links to all the places you might be looking at while hunting down a tough bug.
And, if you’re still stuck at the end, we’re happy to hop on a call to see how we can help out.
Durable Entity State Seems to be Getting Lost Possibly Cause Competing Hosts Saving State During Shutdown / DrainMode enabled
See original GitHub issueDescription
We have a durable entity that thottles concurrent delivery of incoming messages from an event hub to a target. It does this with an EH binding putting Signaling the entity with an Enque, and then an eternal orchestration Once every couple of mins Calls() the process method n the entity which drains the queue.
Once in a while…messages seems to disappear from the queue. EG we have 980 messages for receiving the event message from hub, 980 messages about “EntitySignal:Queue” but when our process method kicks off it only sees 808 messages in the queue, and we only see 808 processing messages.
~Nothing is standing out in the logs~, and we’ve been unable to recreate this problem anywhere but prod 😦
update: found some unexpected behaviour in log, see first comment
looking for any advice/things to check/way to verify somethings going wrong with the entity state (probably because we are doing something wrong)
public class ThrottleSender
{
    //it's a singleton so we will always use it a single Id
    public const string InstanceId = "7399a8cd-878d-48a2-a37c-684210bcb902";
    public static readonly EntityId SingletonEntityId = new EntityId(
        nameof(ThrottleSender),
        InstanceId
    );


    [FunctionName(nameof(ThrottleSender))]
    public static Task Run(
        [EntityTrigger] IDurableEntityContext ctx
    ) => ctx.DispatchAsync<ThrottleSender>();


    [JsonProperty]
    private Queue<EnqueuedCommand> queuedCommands = new Queue<EnqueuedCommand>();

    [JsonProperty]
    private List<FailedCommand> failedCommands = new List<FailedCommand>();

    [JsonProperty]
    private List<SuccessfulCommand> recentlySuccessfulCommands = new List<SuccessfulCommand>();


    [JsonIgnore]
    private readonly ServiceClient serviceClient;

    [JsonIgnore]
    private readonly ILogger<ThrottleSender> log;

    [JsonIgnore]
    private readonly TelemetryClientWrapper telemetryClient;

    public ThrottleSender(
        ServiceClient serviceClient,
        ILogger<ThrottleSender> log,
        TelemetryClientWrapper telemetryClient
    )
    {
        this.serviceClient = serviceClient;
        this.log = log;
        this.telemetryClient = telemetryClient;
    }


    public Task<ThrottleSender> Queue(
        DoStuffCommand command
    )
    {
        queuedCommands.Enqueue(
            new EnqueuedCommand(
                Guid.NewGuid(),
                DateTimeOffset.UtcNow,
                command
            )
        );
        return Task.FromResult(this);
    }

    public async Task<ThrottleSender> ProcessQueuedCommands(
    )
    {

        // reset as we want to track this per run
        requestCount = 0;

        var startTime = DateTimeOffset.UtcNow;
       //stay under consumption plan 10 mins
        var endTime = startTime + TimeSpan.FromMinutes(5);

        var enqueuedCommandsBeforeMetric = new MetricTelemetry()
        {
            Name = Troubleshooting.TelemetryMetricNames.QUEUED_COMMANDS,
            Sum = queuedCommands.Count(),
            Timestamp = startTime,
        };

        var failedCommandsBeforeMetric = new MetricTelemetry()
        {
            Name = Troubleshooting.TelemetryMetricNames.FAILED_COMMMANDS_RETAINED,
            Sum = failedCommands.Count(),
            Timestamp = startTime,
        };

        var successCommandsBeforeMetric = new MetricTelemetry()
        {
            Name = Troubleshooting.TelemetryMetricNames.SUCCESSFUL_COMMANDS_RETAINED,
            Sum = recentlySuccessfulCommands.Count(),
            Timestamp = startTime,
        };

        telemetryClient.TrackMetric(enqueuedCommandsBeforeMetric);
        telemetryClient.TrackMetric(failedCommandsBeforeMetric);
        telemetryClient.TrackMetric(successCommandsBeforeMetric);

        //TODO: is this needed?
        telemetryClient.Flush();

        var sequentialFailures = 0;

        var inFlightTasks = new List<Task<DoStuffCommandResult>>();
        var inFlightCommands = new List<EnqueuedCommand>();
        var maxConcurrency = 5;

        // run loop while we have time AND (commandsToAdd OR processesToFinish)
        while (DateTimeOffset.UtcNow < endTime && (queuedCommands.Count > 0 || inFlightCommands.Count > 0))
        {
           //fill up with concurrent tasks
            while (DateTimeOffset.UtcNow < endTime && queuedCommands.Count > 0 && inFlightTasks.Count < maxConcurrency)
            {
                var c = queuedCommands.Dequeue();

                inFlightTasks.Add(serviceClient.Execute(c));
                inFlightCommands.Add(c);
            }

            var finishedTask = await Task.WhenAny(inFlightTasks);

            inFlightTasks.Remove(finishedTask);

            var result = await finishedTask;

            // remove the command whether or not it succeeded
            inFlightCommands.Remove(result.Command);

            if(result.Exception != null)
            {
                failedCommands.Add(
                    new FailedCommand(
                        result.Command.Id,
                        result.Command.Enqueued,
                        result.Command.Command,
                        DateTimeOffset.UtcNow,
                        result.Exception
                    )
                );

                log.LogError(
                    Troubleshooting.EventIDs.REQUEST_FAILURE,
                    result.Exception,
                    "executing command failed"
                );

                sequentialFailures++;

                if (sequentialFailures > maxSequentialFailures)
                {
                    // TODO: do we need to reset this? don't want the entity to sit around in dirty state
                    sequentialFailures = 0;

                    throw new Exception(
                        "ProcessQueuedCommands sequential failure limit reached"
                    );
                }

                continue;

            }

            // if we got here, task succeeded
            sequentialFailures = 0;

            log.LogInformation(
                    "processed command"
                );

            recentlySuccessfulCommands
            .Add(
                new SuccessfulCommand(
                    result.Command.Id,
                    result.Command.Enqueued,
                    result.Command.Command,
                    DateTimeOffset.UtcNow
                )
            );

        }

        //HACK: throw the rest back in the start of queue, we can redeliver these
        foreach (var c in inFlightCommands.Reverse())
        {
            queuedCommands = new Queue<EnqueuedCommand>(queuedCommands.Prepend(c));
        }

        // Hold onto recent success for 3 days
        for (var i = 0; i < recentlySuccessfulCommands.Count; i++)
        {
            if (recentlySuccessfulCommands[i].Succeeded < startTime.AddDays(-3))
            {
                recentlySuccessfulCommands.RemoveAt(i);
                break;
            }
        }

        // endtime doesn't always == time runout
        endTime = DateTimeOffset.UtcNow;

        var enqueuedCommandsAfterMetric = new MetricTelemetry()
        {
            Name = Troubleshooting.TelemetryMetricNames.QUEUED_COMMANDS,
            Sum = queuedCommands.Count(),
            Timestamp = endTime,
        };

        var failedCommandsAfterMetric = new MetricTelemetry()
        {
            Name = Troubleshooting.TelemetryMetricNames.FAILED_COMMMANDS_RETAINED,
            Sum = failedCommands.Count(),
            Timestamp = endTime,
        };

        var successCommandsAfterMetric = new MetricTelemetry()
        {
            Name = Troubleshooting.TelemetryMetricNames.SUCCESSFUL_COMMANDS_RETAINED,
            Sum = recentlySuccessfulCommands.Count(),
            Timestamp = endTime,
        };

        var requestCountMetrics = new MetricTelemetry()
        {
            Name = Troubleshooting.TelemetryMetricNames.REQUEST_SENT,
            Sum = requestCount,
            Timestamp = endTime,
        };

        telemetryClient.TrackMetric(enqueuedCommandsAfterMetric);
        telemetryClient.TrackMetric(failedCommandsAfterMetric);
        telemetryClient.TrackMetric(successCommandsAfterMetric);
        telemetryClient.TrackMetric(requestCountMetrics);

        return await Task.FromResult(this);
    }

}

public record EnqueuedCommand(
    Guid Id,
    DateTimeOffset Enqueued,
    DoStuffCommand Command
);
the thing filling the queue is DEAD simple
[FunctionName("QueueStuff")]
    public async Task QueueStuff(
        [EventHubTrigger("stuff", Connection = "con", ConsumerGroup = "$notdefault")] EventData message,
        [DurableClient] IDurableEntityClient durableEntityClient
    )
    {
        //bunch of value checks omitted

              await durableEntityClient.SignalEntityAsync(
                  ThottleSender.SingletonEntityId,
                  nameof(ThottleSender.Queue),
                  message.AsCommand()
              );
    }
and the eternal orchestration is
    [FunctionName(nameof(ProcessQueuedCommands))]
    public async Task ProcessQueuedCommands(
        [OrchestrationTrigger] IDurableOrchestrationContext context
    )
    {

        var replaySafelogger = context.CreateReplaySafeLogger(log);
        var loop = 0;

        while (loop++ < 100)
        {

            await context.CallEntityAsync(
                ThrottleSender.SingletonEntityId,
                nameof(ThrottleSender.ProcessQueuedCommands)
            );

            var completeTime = context.CurrentUtcDateTime;


            await context.CreateTimer(completeTime.AddSeconds(10), CancellationToken.None);

        }

        //after 100 loops we want to clear history, but keep executing see best practice at https://docs.microsoft.com/en-us/azure/azure-functions/durable/durable-functions-eternal-orchestrations?tabs=csharp
        context.ContinueAsNew();
    }
Expected behavior
Expect if we see 980 SignalEntity:Queue messages we’d see 980 commands in the queue when process start is called
Actual behavior
only saw 808 commmands in the queue
Relevant source code snippets
see above
Known workarounds
none
App Details
- Durable Functions extension version (e.g. v1.8.3): 2.7.2
- Azure Functions runtime version (1.0 or 2.0): v4 .net 6 in process
- Programming language used: c#
Screenshots
If applicable, add screenshots to help explain your problem.
If deployed to Azure
We have access to a lot of telemetry that can help with investigations. Please provide as much of the following information as you can to help us investigate!
- Timeframe issue observed: 8am -9am MT
- Function App name: fgp01fap-amc-ont-ext-prod
- Function name(s): holdreleasecommandprocessor
- Azure region: West US 2
- Orchestration instance ID(s): @holdreleasecommandprocessor@7399a8cd-878d-48a2-a37c-684210bcb902 is entity id
- Azure storage account name: fgp01stramcontextprod
If you don’t want to share your Function App or storage account name GitHub, please at least share the orchestration instance ID. Otherwise it’s extremely difficult to look up information.
Issue Analytics
- State:

- Created 6 months ago
- Reactions:2
- Comments:19
 Top Related StackOverflow Question
 Troubleshoot Live Code
 Top Related Reddit Thread
 Top Related Hackernoon Post
 Top Related Tweet
 Top Related Dev.to Post
 Top Related Hashnode Post
I can confirm that scenario 2 is taking place in this window. I can also see that the inputs are large, which means the contents are stored in blobs. My current suspicion is that the e-tag protection may not have taken into account this “large properties spill into blobs” mechanism which could explain why the loser’s state ends up winning (because it overwrites the blob) even though its table storage access loses (because the e-tag does not match). I will keep investigating.
ok spent a few more hours trolling the logs…there was a minute 8:49 AM MT were exactly 172 queue method were invoke…so that seemed like a bad coincidence. looking around those logs…this entity was processing things simultaniously on two hosts…as i understood it that is NOT supposed to happen.
during the execution of ProcessQueuedCommands these logs came thru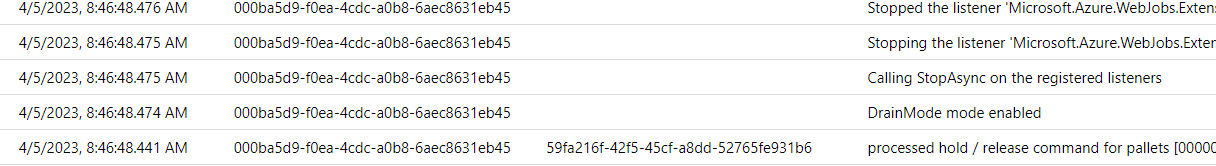
so that host was being shut down
shortly after that the other host started the entity
but during that the first host (that was shutting down) was happy to keep running it’s activity…
until it finally exited, and the host quickly shut down
and presumably that shutting down host then serialized it’s state (which was now an empty queue) to storage…and all the state from the other host was wiped out.
so… (1) is this a bug in the runtime?
(2) should two hosts ever be working with the same entity instance id simultaniously? (3) are we doing something wrong in our code? like are we supposed to take a cancellation token and have our activity early exit because of the drain event? i don’t recall ever reading any docs around that…but it kinda makes sense… (4) any other advice?