[BUG] Azure.Data.Table memory consumption is 120% higher than Microsoft.Azure.Cosmos.Table
See original GitHub issueDescribe the bug When I try to stream through all entities in a table per partition concurrently it seems that garbage collection isn’t working. After fetching about 400k (just streaming through without holding on to any entities) the memory consumption gets to 1 GB.
Expected behavior
Streaming through entities via await foreach (var page in pages) should only hold objects associated with the current page and previous pages should be garbage collected efficiently.
Actual behavior (include Exception or Stack Trace) Memory consumption is around 120% higher when using Azure.Data.Table SDK than the legacy Microsoft.Azure.Cosmos.Table SDK.
To Reproduce
// Creating temp table
var tableClient = new TableClient(url, "tempdata", new TableSharedKeyCredential(accountName, accountKey));
await tableClient.CreateAsync();
var partitions = Enumerable.Range(0, 100).ToList();

// Creating entities 100k entities
Console.WriteLine("Creating entities 100k entities...");

var creationTasks = partitions.Select(async partitionKey =>
{
	for (var i = 0; i < 10; i++)
	{
		var batch = tableClient.CreateTransactionalBatch("" + partitionKey);
		var entities = Enumerable.Repeat("", 100).Select(x => new TableEntity("" + partitionKey, "" + Guid.NewGuid())).ToList();

		foreach (var entity in entities)
		{
			entity["Line1"] = "Lorem ipsum dolor sit amet, consectetur adipiscing elit.";
			entity["Line2"] = "Donec tellus massa, finibus ac consequat sit amet, eleifend eget tellus.";
			entity["Line3"] = "Curabitur aliquet molestie rhoncus. Vestibulum blandit diam et bibendum interdum.";
			entity["Line4"] = "Ut auctor, diam non mollis faucibus, velit elit fringilla metus, vel tincidunt risus felis eget sapien.";
			entity["Line5"] = "Ut lacus leo, bibendum nec ullamcorper sed, tristique at erat.";
			batch.UpsertEntity(entity);
		}

		await batch.SubmitBatchAsync();
	}
}).ToList();

await Task.WhenAll(creationTasks);

// Force GC and wait 2 secs
GC.Collect(GC.MaxGeneration, GCCollectionMode.Forced);
await Task.Delay(2000);

Console.WriteLine("Streaming through 100k entities...");
var fetched = 0;

var streamTasks = partitions.Select(async x =>
{
	var iterations = 0;
	var result = tableClient.QueryAsync<TableEntity>($"PartitionKey eq '{x}'", 200);
	var pages = result.AsPages(null, 200);

	await foreach (var page in pages)
	{
		iterations++;
		var val = Interlocked.Add(ref fetched, page.Values.Count);
		lock (tableClient)
		{
			Console.CursorLeft = 0;
			Console.Write($"Fetched {val:N0} entities...");
		}

		// GC.Collect(); // If I leave out this line the process uses over 300 MB RAM
	}
}).ToList();

await Task.WhenAll(streamTasks);
Console.WriteLine("");

// Delete temp table
await tableClient.DeleteAsync();
tableClient = null;

Console.WriteLine("Done.");
Console.ReadKey();
Environment:
- Azure.Data.Table.3.0.0-beta.5
- .NET SDK (reflecting any global.json): Version: 5.0.201 Commit: a09bd5c86c Runtime Environment: OS Name: Windows OS Version: 10.0.19042 OS Platform: Windows RID: win10-x64
- IDE and version : Visual Studio 16.9.1
Issue Analytics
- State:
- Created 2 years ago
- Comments:6 (3 by maintainers)
 Top Results From Across the Web
Troubleshoot out of memory errors with Azure SQL Database
Provides steps to investigate and troubleshoot out of memory issues in Azure SQL Database.
Read more >What is the difference between azure.data.tables vs ...
azure.cosmos.table is a client library which enables working with the Microsoft Azure CosmosDB Table API as well as Azure Table Storage. When ...
Read more >Azure Cosmos DB pricing
Get pricing info for the Azure Cosmos DB, fully managed NoSQL database for modern app development. No upfront costs. Pay as you go....
Read more >Migration of Data from Azure table storage to ...
Hi, I have a requirement to migrate tables from Azure table storage to Azure cosmos DB Table API. What is the most efficient...
Read more >API for Table in Azure Cosmos DB ...
With Azure Table storage one only pays for capacity that's used. This helps to explain why API for Table can offer a 10...
Read more > Top Related Medium Post
No results found
 Top Related StackOverflow Question
No results found
 Troubleshoot Live Code
Lightrun enables developers to add logs, metrics and snapshots to live code - no restarts or redeploys required.
Start Free Top Related Reddit Thread
No results found
 Top Related Hackernoon Post
No results found
 Top Related Tweet
No results found
 Top Related Dev.to Post
No results found
 Top Related Hashnode Post
No results found

In my testing, putting a
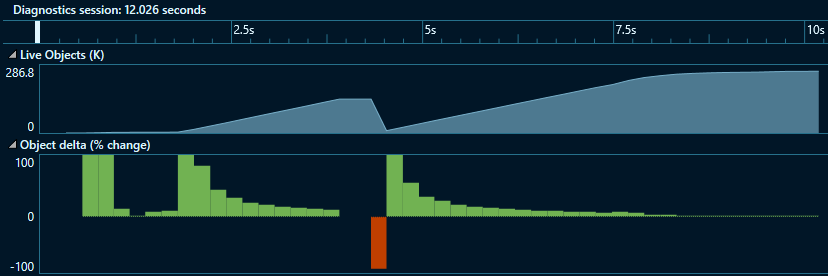
Task.Delay(3500)in the pages loop of the repro code example accomplishes the same thing. It provides enough time for the GC to take an opportunity to collect. In other words, if you artificially slow the track 2 client down to be roughly equivalent from a throughput perspective, the GC will collect more often on its own. This doesn’t appear to be an issue with the client, but the expected behavior of the GC when the process is very busy.@HansOlavS I did some profiling with the Performance Profiler in Visual Studio and the results show that there is actually not a significant difference in memory total allocations, but there is a significant difference in GC collections which is why it appears to be different at any given time.
Here is the NET Object Allocation Tracking graph for the track1 client (Microsoft.Azure.Cosmos.Table):
Note that there is never a large peak in live objects, but there 115 GC collections. The time taken to iterate through the 100k entities was roughly twice that of the track 2 client, which I believe gave more time for the GC to collect naturally.
Here is the NET Object Allocation Tracking graph for the track1 client (Azure.Data.Tables):
Note that the peak live objects are roughly equivalent, but there are only 56 GC collections.
To make the differences even more apparent, I configured the test application to use the server GC and also delay collections with
TryStartNoGCRegion. This was done with 10 object allocation granularity (the previous test was with 100 granularity)Track1 (Microsoft.Azure.Cosmos.Table):
Track2 (Azure.Data.Tables):
So in summary, the track2 client seems to allocate no more than track2 (perhaps less), and is significantly faster (roughly 2x).