[BUG] Stacked bar using time axis without having the same datetime
See original GitHub issueExpected Behavior
Create a stacked bar using time axis with different datetime in the datasets. For example:
datasets:
  [
    {
      label: 'A',
      data:
      [
        {
          x: "01-01-2018",
          y: 12
        },
        {
          x: "02-01-2018",
          y: 15
        },
      ],
    },
    {
      label: 'B',
      data:
      [
        {
          x: "02-01-2018",
          y: 23
        },
        {
          x: "03-01-2018",
          y: 34
        },
        {
          x: "04-01-2018",
          y: 45
        },
      ]
    }
  ],
In this example dataset B haven’t the point at “01-01-2018”
Current Behavior
Currently, using the stacked bar with time axis need the datasets having the same point datatime even if some point is set to 0.
datasets:
  [
    {
      label: 'A',
      data:
      [
        {
          x: "01-01-2018",
          y: 12
        },
        {
          x: "02-01-2018",
          y: 15
        },
      ],
    },
    {
      label: 'B',
      data:
      [
        {
          x: "01-01-2018",
          y: 0
        },
        {
          x: "02-01-2018",
          y: 23
        },
        {
          x: "03-01-2018",
          y: 34
        },
        {
          x: "04-01-2018",
          y: 45
        },
      ]
    }
  ],
Possible Solution
Calculate the height of the single bar looking for every datasets if the datetime is present or not
Steps to Reproduce (for bugs)
Here the problem on stackoverflow Here the jsfiddle
Context
I want show the stacked bar without having to manipulate all the datasets for add the missing point.
Environment
- Chart.js version: 2.7.2
- Browser name and version: Firefox 61.0.1
Issue Analytics
- State:
- Created 5 years ago
- Reactions:3
- Comments:7 (1 by maintainers)
 Top Results From Across the Web
Bar Chart with Wide Format Data Fails With Data of Type ...
As noted in the comments, the current date format fails, so it can be converted to a stacked bar chart by converting it...
Read more >Stacked column chart- Date axis showing date with time values
Hi, I have a Stacked column chart with Date on X-axis. While selecting a single months date-time values show on X-axis. Does notm...
Read more >WebChartControl cannot add stacked bar chart where ...
Hi We need to show a Gantt chart type of report, where we can show stacked items based on its time line. We...
Read more >Clustered and Stacked Column and Bar Charts - Peltier Tech
Excel has built-in chart types for clustered bars, and for stacked bars. This tutorial shows how to cluster and stack the bars in...
Read more >Date Axis in Excel Chart is wrong - AuditExcel
If you right click on the horizontal axis and choose to Format Axis, you will see that under Axis Type it has 3...
Read more > Top Related Medium Post
No results found
 Top Related StackOverflow Question
No results found
 Troubleshoot Live Code
Lightrun enables developers to add logs, metrics and snapshots to live code - no restarts or redeploys required.
Start Free Top Related Reddit Thread
No results found
 Top Related Hackernoon Post
No results found
 Top Related Tweet
No results found
 Top Related Dev.to Post
No results found
 Top Related Hashnode Post
No results found

+1
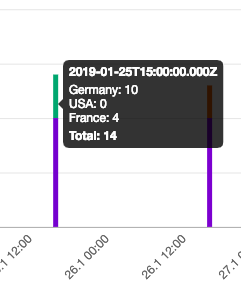
This is also bugging us in our project. It would be great if you guys could provide a fix for this. Otherwise we always have to fill up the datasets, which lack certain ticks and set there a value ‘0’, which is then unfortunately also shown in the unified tooltip as value 0 for that particular dataset.
We want to dynamically load a bunch of different records (last month, last week, etc.) these contain diverse datasets per chunk. These datasets are different in length/number. Therefore we have to determine the order and enhancing of the datasets ourselves and this would be necessary with every reload/view change.
As seen here:
Here is a stackblitz for it: Stackblitz
+1