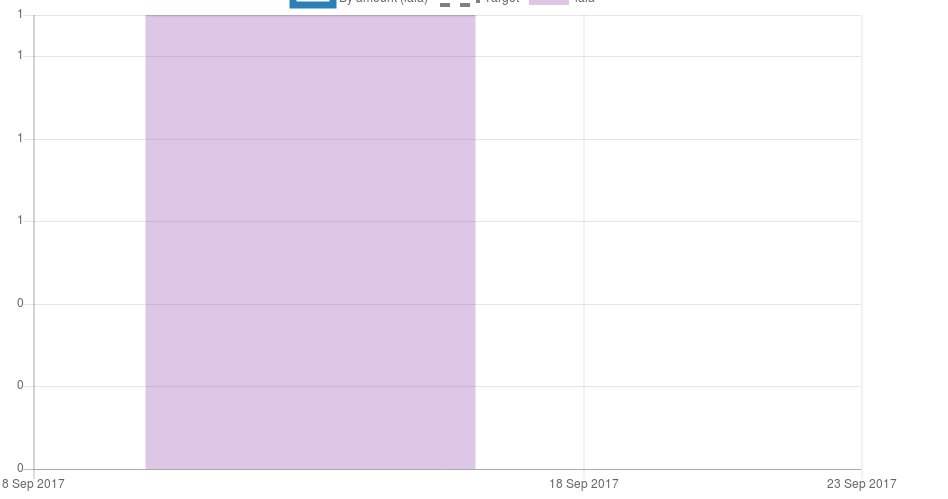
Repeating same tick values
See original GitHub issue
See Y axis? This is caused because we are returning rounded value in options.yAxes.ticks.callback. So chart.js calls callback with 0, 0.1 … 0.9, 1.0, 1.1 values, but callback returns 0, 1 only. Repeating same values in a chart is undesirable for end user.
In userspace, I’ve applied following fix to solve this issue:
// this is to prevent repeating tick values
var middlewareToMakeTicksUnique = function(next) {
    return function(value, index, values) {
        var nextValue = next(value);

        if (index && values.length > index+1 && // always show first and last tick
            // don't show if next or previous tick is same
            (next(values[index + 1]) === nextValue || next(values[index - 1]) === nextValue)
        ) {
            return null;
        }

        return nextValue;
    }
};

...

yAxes: [{
    ticks: {
        callback: middlewareToMakeTicksUnique(function (value) {
            return value.format();
        })
    }
}]
Issue Analytics
- State:
- Created 6 years ago
- Comments:19 (4 by maintainers)
 Top Results From Across the Web
Chart Y axis repeating tick values | Infragistics Forums
I have a line chart with a Y axis value of whole integers and a X axis values of time. On the Y...
Read more >How do I tell d3 to not repeat values in ticks? - Stack Overflow
You'll have to use . tickValues() to set the tick values explicitly in this case. but I'm parsing my frequency data with parseInt(datum....
Read more >Why do my 3D plot axis tick marks keep repeating? - MathWorks
I am trying to create a 3D plot video, but my X axis tick marks keep repeating. The X axis tick marks should...
Read more >The same Y axis ticks repeated if the values are too small.
I try to set y-tick-inverval equal to 1. The problem is solved but the chart loses the ability to set Y ticks automatically...
Read more >Solved: x-axis values repeats - Microsoft Power BI Community
Solved: Hello, I have a chart in which one of the x-axis values repeats with no data on it... I can't fix it...
Read more > Top Related Medium Post
No results found
 Top Related StackOverflow Question
No results found
 Troubleshoot Live Code
Lightrun enables developers to add logs, metrics and snapshots to live code - no restarts or redeploys required.
Start Free Top Related Reddit Thread
No results found
 Top Related Hackernoon Post
No results found
 Top Related Tweet
No results found
 Top Related Dev.to Post
No results found
 Top Related Hashnode Post
No results found

Closing as this was solved in #4841 and is already available in version 2.7.3 (setting
ticks.precisionto0, no need forcallback).I don’t care about classification of this, I never mentioned it’s a bug. I don’t see current behaviour as sensible though. I don’t see any use case where it’s useful when values shown there are duplicated, do you? I also don’t see why is developer forced to work around this. Developer never provided non-integer value, but Chart.js tries to display them. I’ve never see this in other charting solutions.