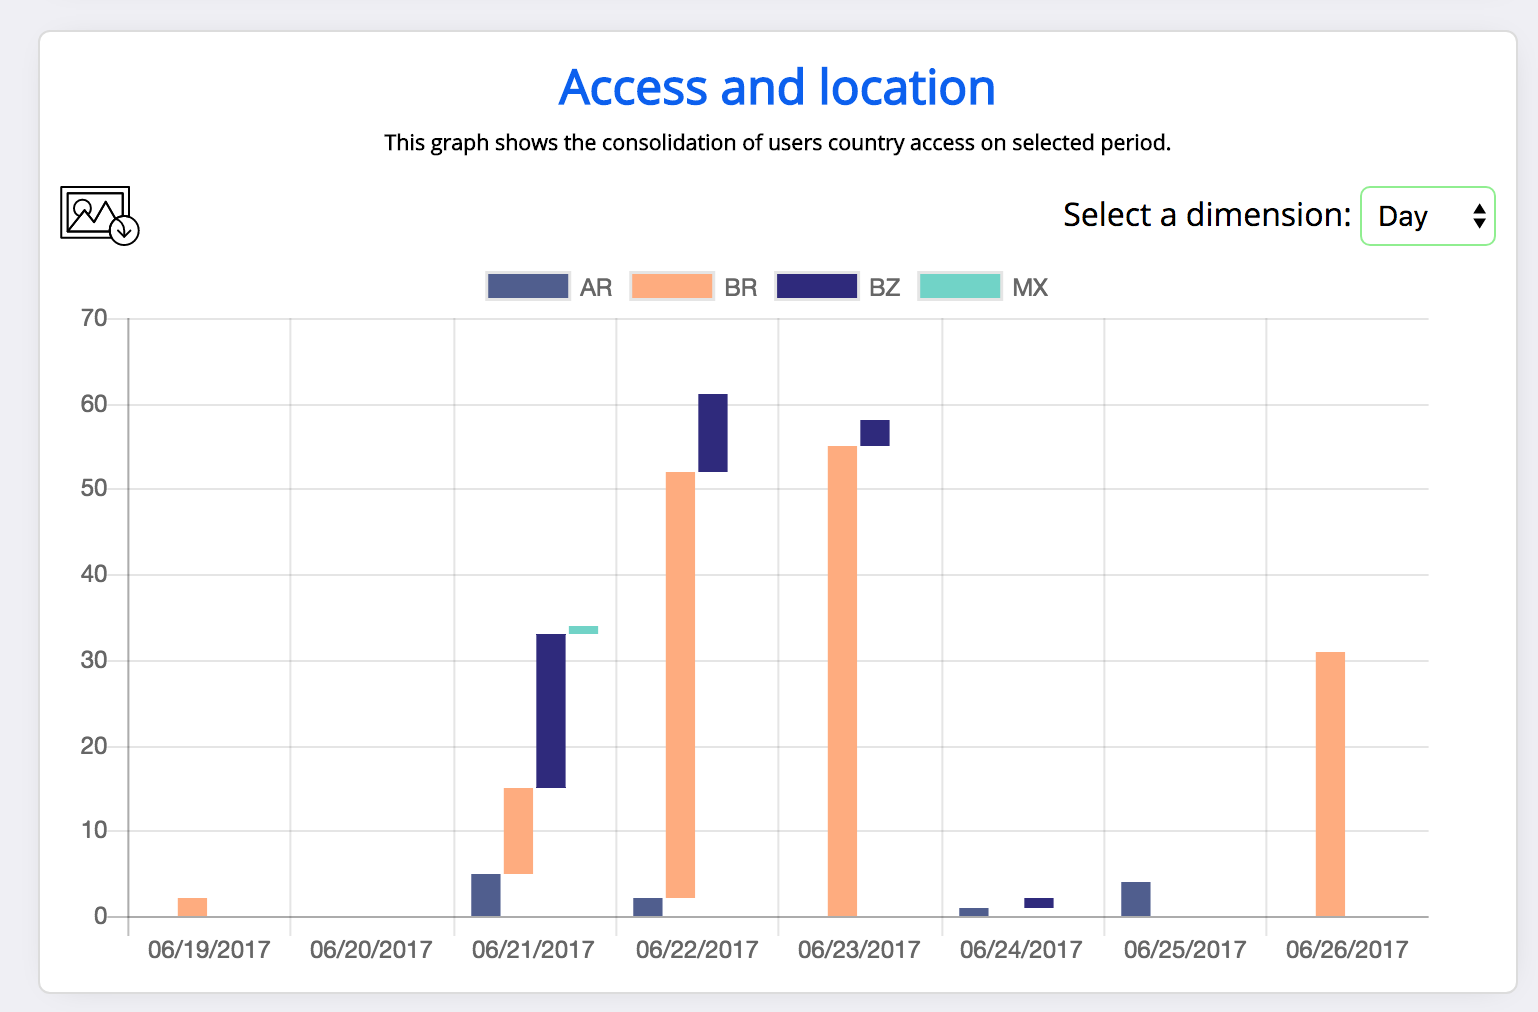
Stacked bar visualisation on 2.6.0
See original GitHub issueAfter upgrading from chart.js 2.5.0 to 2.6.0 stacked bar visualisations aren’t stacking any more - will try to look into chart.js code and make a pull request if successful.
2.5.0

2.6.0

Code
new Chart(chartContainer, {
    "type": "bar",
    "data": {
        "labels": context.contextLabels,
        "datasets": datasets
    },
    "options": {
        "scales": {
            "yAxes": [{
                "stacked": true,
                "ticks": {
                    "min": 1,
                    "max": max > 100 ? max : 100
                }
            }]
        }
    }
});
Edit (SB): code formatting
Issue Analytics
- State:
- Created 6 years ago
- Comments:10 (6 by maintainers)
 Top Results From Across the Web
Stacked bar visualization - IBM
Use a stacked bar visualization to compare the proportional contributions for each item to the total, such as sales for products and sales...
Read more >Stacked and Grouped Bar Charts and Mosaic Plots in R
Stacked and Grouped Bar Charts and Mosaic Plots in R: How to create and customize stacked bar charts, clustered bar charts and mosaic...
Read more >How to change the order of the bars in your stack bar chart
Changing the order of your stacked bar chart.
Read more >Excel - Stacked bar chart of single variable - YouTube
Add Total Values for Stacked Charts in Excel: Column & Bar Charts · 2D Stacked Bar chart in MS Excel - Project Schedule...
Read more >Constructing a Stacked Bar Graph - YouTube
This video show how to construct a stacked bar graph.
Read more > Top Related Medium Post
No results found
 Top Related StackOverflow Question
No results found
 Troubleshoot Live Code
Lightrun enables developers to add logs, metrics and snapshots to live code - no restarts or redeploys required.
Start Free Top Related Reddit Thread
No results found
 Top Related Hackernoon Post
No results found
 Top Related Tweet
No results found
 Top Related Dev.to Post
No results found
 Top Related Hashnode Post
No results found

This is how
stackedworks on both axes in 2.6.0:@jungleBadger you can still create a fiddle with your code
@jungleBadger that’s actually a bug fix, the 2.6.0 screenshot is the expected result: stacked on y but not on x. I think setting
stacked: trueon the x axis should produce the result you want?