question-mark
Stuck on an issue?

Lightrun Answers was designed to reduce the constant googling that comes with debugging 3rd party libraries. It collects links to all the places you might be looking at while hunting down a tough bug.

And, if you’re still stuck at the end, we’re happy to hop on a call to see how we can help out.

Display one label of the sum of stacked bars

See original GitHub issue

Hi,

I have a horizontal stacked bar chart which looks like this:

chrome_2017-11-30_14-51-19

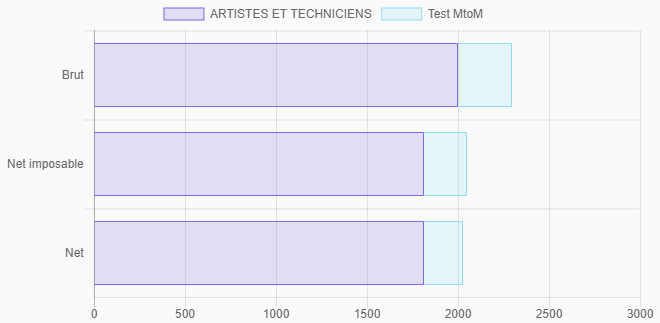
And I would like to display the sum of each stacked bar, like so:

chrome_2017-11-30_14-50-04

I managed to get this result by returning an empty string for datasets that are not the last one (datasetIndex), and computing the sum for each bar (dataIndex):

plugins: {
	datalabels: {
		formatter: (value, ctx) => {
			let datasets = ctx.chart.data.datasets; // Tried `.filter(ds => !ds._meta.hidden);` without success
			if (ctx.datasetIndex === datasets.length - 1) {
				let sum = 0;
				datasets.map(dataset => {
					sum += dataset.data[ctx.dataIndex];
				});
				return sum.toLocaleString(/* ... */);
			}
			else {
				return '';
			}

		},
		anchor: 'end',
		align: 'end'
	}
}

It works great, but if I toggle off one dataset (via the chart’s legend), the result is less great:

  • if I toggle off the first dataset, I still have the sum of the two datasets as a label:

    chrome_2017-11-30_15-57-51

  • if I toggle off the last dataset, I don’t have a label anymore:

    chrome_2017-11-30_15-59-59

As I commented in my code snippet, I tried to filter out the datasets with the _meta.hidden metadata, but it seems that the formatter function is not called again when toggleing datasets via the chart’s legend.

Is there a better way to use datalabels with stacked bar charts? Or does anyone have an idea to make it work?

Issue Analytics

  • State:closed
  • Created 6 years ago
  • Reactions:5
  • Comments:16 (4 by maintainers)

github_iconTop GitHub Comments

19reactions
simonbrunelcommented, Nov 30, 2017

I think I would move the summation logic into a separated plugin responsible to compute the total for each “stack” and the utmost dataset index, the one for which you want to display the label. It would happen only one time, before the chart update (better for performances):

const totalizer = {
  id: 'totalizer',

  beforeUpdate: chart => {
    let totals = {}
    let utmost = 0

    chart.data.datasets.forEach((dataset, datasetIndex) => {
      if (chart.isDatasetVisible(datasetIndex)) {
        utmost = datasetIndex
        dataset.data.forEach((value, index) => {
          totals[index] = (totals[index] || 0) + value
        })
      }
    })

    chart.$totalizer = {
      totals: totals,
      utmost: utmost
    }
  }
}

Then you need to register this plugin to the charts you want to display the total:

new Chart('chart', {
  plugins: [totalizer],
  // ...
}

At this point, you can access computed information from chart.$totalizer and thus configure the datalabels plugin easily:

new Chart('chart', {
  plugins: [totalizer],
  options: {
    plugins: {
      datalabels: {
        formatter: (value, ctx) => {
          const total = ctx.chart.$totalizer.totals[ctx.dataIndex]
          return total.toLocaleString('fr-FR', {
            style: 'currency',
            currency: 'EUR'
          })
        },
        display: function(ctx) {
           return ctx.datasetIndex === ctx.chart.$totalizer.utmost
        }
      }
    }
  }
  // ...
}

Note that it’s better to hide the other labels using the display option because nothing else will be computed for this label (e.g. the formatter will not be called for hidden labels).

Fiddle: https://jsfiddle.net/simonbrunel/9ezggxx5/

This example doesn’t take in account all use cases, such as grouped stacks or negative values.

Edit: I didn’t realize that you got a working solution before writing this comment.

7reactions
michvllnicommented, Jan 14, 2019

I know this is an old topic, but I modified Simon’s plugin to be usable for grouped stacks. Hope this helps anyone.

const totalizer = {
            id: 'totalizer',
            beforeUpdate: function (chart) {
                var totals = [];
                var utmost = {};
                chart.data.datasets.forEach(function (dataset, datasetIndex) {
                    if (chart.isDatasetVisible(datasetIndex)) {
                        var stack = dataset.stack;
                        utmost[stack] = datasetIndex;
                        dataset.data.forEach(function (value, index) {
                            if (totals[index] === undefined) {
                                totals[index] = {};
                            }
                            totals[index][stack] = (totals[index][stack] || 0) + value;
                        })
                    }
                });
                chart.$totalizer = {
                    totals: totals,
                    utmost: utmost
                }
            }
        }

The totals are then callable by using chart.$totalizer.totals[dataIndex][stack] and the utmost items are callable by using chart.$totalizer.utmost[stack]

Read more comments on GitHub >

github_iconTop Results From Across the Web

How to add total labels to stacked column chart in Excel?
Add total labels to stacked column chart with an amazing tool · 1. Create the stacked column chart. · 2. Select the stacked...
Read more >
How to Add Labels to Show Totals in Stacked Column Charts ...
8. In the chart, right-click the "Total" series and then, on the shortcut menu, select Add Data Labels.
Read more >
Add Total Values for Stacked Column and Stacked Bar Charts ...
This is the only video you need to learn how to add add totals to stacked bar charts and stacked column charts in...
Read more >
How to Add Total Values to Stacked Bar Chart in Excel
Step 1: Enter the Data · Step 2: Calculate the Total Values · Step 3: Create Stacked Bar Chart · Step 4: Add...
Read more >
Add Total Value Labels to Stacked Bar Chart in Excel (Easy)
Stacked Bar Charts Missing Total Labels In Excel. Unfortunately, Microsoft does not have the ability to insert data labels at the top of ......
Read more >

github_iconTop Related Medium Post

No results found

github_iconTroubleshoot Live Code

Lightrun enables developers to add logs, metrics and snapshots to live code - no restarts or redeploys required.
Start Free

github_iconTop Related Reddit Thread

No results found

github_iconTop Related Hackernoon Post

No results found

github_iconTop Related Tweet

No results found

github_iconTop Related Dev.to Post

No results found

github_iconTop Related Hashnode Post

No results found