
Stuck on an issue?
Lightrun Answers was designed to reduce the constant googling that comes with debugging 3rd party libraries. It collects links to all the places you might be looking at while hunting down a tough bug.
And, if you’re still stuck at the end, we’re happy to hop on a call to see how we can help out.
Why is "colour.plotting.plot_RGB_colourspaces_gamuts" definition producing unexpected results?
See original GitHub issueHi Colour Team,
I use this snippet code to generate the gamuts in CIE XYZ:


My Colour version: 0.3.15
I think this result is wrong, because sRGB gamut lies outside ProPhoto RGB one. Expected result:
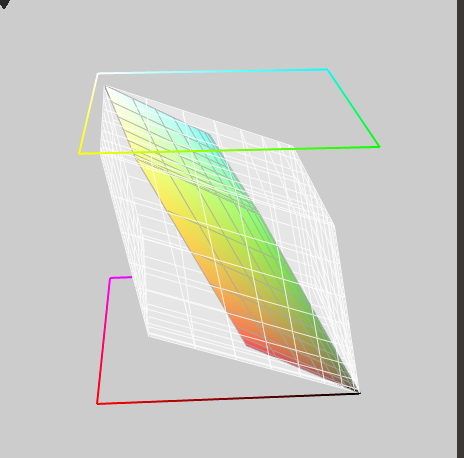
sRGB gamut should lie entirely inside ProPhoto RGB one.
Could you help me check this out? Did I write any thing wrong in my code?
Thanks
Issue Analytics
- State:

- Created 3 years ago
- Comments:9 (4 by maintainers)
 Top Results From Across the Web
colour.plotting.plot_multi_sds — Colour 0.4.2 documentation
plot () definition, used to control the style of the plotted spectral distributions. plot_kwargs` can be either a single dictionary applied to all...
Read more > Top Related Medium Post
No results found
 Top Related StackOverflow Question
No results found
 Troubleshoot Live Code
Lightrun enables developers to add logs, metrics and snapshots to live code - no restarts or redeploys required.
Start Free Top Related Reddit Thread
No results found
 Top Related Hackernoon Post
No results found
 Top Related Tweet
No results found
 Top Related Dev.to Post
No results found
 Top Related Hashnode Post
No results found
Hi @hminle,
This is a pure side effect of the illuminants of the two RGB colourspaces being different, i.e. D65 vs D50. What you can do is something like that:
If you have a doubt like that, try CIE xyY and you will see that ProPhoto RGB encompasses almost entirely sRGB but they diverge at the top of the volume because of their different whitepoint.
You can also verify that here: https://www.colour-science.org:8020/
@hminle : I have added support in the develop branch to chromatically adapt the RGB colourspaces in the various plotting definitions: