
Lightrun Answers was designed to reduce the constant googling that comes with debugging 3rd party libraries. It collects links to all the places you might be looking at while hunting down a tough bug.
And, if you’re still stuck at the end, we’re happy to hop on a call to see how we can help out.
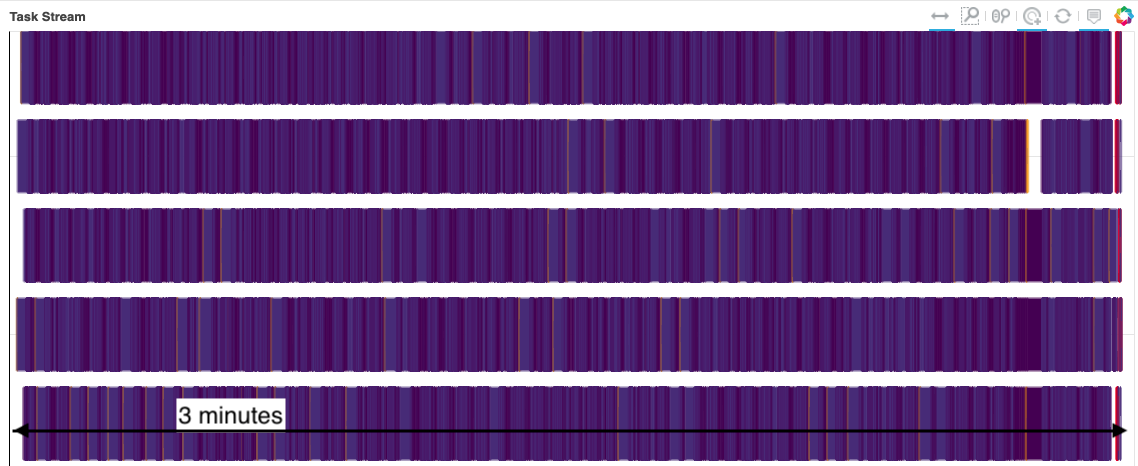
an example that shows the need for memory backpressure
See original GitHub issueIn my work with large climate datasets, I often concoct calculations that cause my dask workers to run out of memory, start dumping to disk, and eventually grind my computation to a halt. There are many ways to mitigate this by e.g. using more workers, more memory, better disk-spilling settings, simpler jobs, etc. and these have all been tried over the years with some degree of success. But in this issue, I would like to address what I believe is the root of my problems within the dask scheduler algorithms.
The core problem is that the tasks early in my graph generate data faster than it can be consumed downstream, causing data to pile up, eventually overwhelming my workers. Here is a self contained example:
import dask.array as dsa

# create some random data
# assume chunk structure is not under my control, because it originates
# from the way the data is laid out in the underlying files
shape = (500000, 100, 500)
chunks = (100, 100, 500)
data = dsa.random.random(shape, chunks=chunks)

# now rechunk the data to permit me to do some computations along different axes
# this aggregates chunks along axis 0 and dis-aggregates along axis 1
data_rc = data.rechunk((1000, 1, 500))
FACTOR = 15


def my_custom_function(f):
    # a pretend custom function that would do a bunch of stuff along
    # axis 0 and 2 and then reduce the data heavily
    return f.ravel()[::15][None, :]

# apply that function to each chunk
c1 = math.ceil(data_rc.ravel()[::FACTOR].size / c0)
res = data_rc.map_blocks(my_custom_function, dtype=data.dtype,
                         drop_axis=[1, 2], new_axis=[1], chunks=(1, c1))

res.compute()
(Perhaps this could be simplified further, but I have done my best to preserve the basic structure of my real problem.)
When I watch this execute on my dashboard, I see the workers just keep generating data until they reach their memory thresholds, at which point they start writing data to disk, before my_custom_function ever gets called to relieve the memory buildup. Depending on the size of the problem and the speed of the disks where they are spilling, sometimes we can recover and manage to finish after a very long time. Usually the workers just stop working.
This fail case is frustrating, because often I can achieve a reasonable result by just doing the naive thing:
for n in range(500):
    res[n].compute()
and evaluating my computation in serial.
I wish the dask scheduler knew to stop generating new data before the downstream data could be consumed. I am not an expert, but I believe the term for this is backpressure. I see this term has come up in https://github.com/dask/distributed/issues/641, and also in this blog post by @mrocklin regarding streaming data.
I have a hunch that resolving this problem would resolve many of the pervasive but hard-to-diagnose problems we have in the xarray / pangeo sphere. But I also suspect it is not easy and requires major changes to core algorithms.
Dask version 1.1.4
Issue Analytics
- State:

- Created 5 years ago
- Reactions:23
- Comments:108 (66 by maintainers)
 Top Related StackOverflow Question
 Troubleshoot Live Code
 Top Related Reddit Thread
 Top Related Hackernoon Post
 Top Related Tweet
 Top Related Dev.to Post
 Top Related Hashnode Post
I’ve tried rerunning a couple examples from this thread under the new PR. Performance is greatly improved.
@rabernat’s canonical anomaly-mean example from https://github.com/dask/distributed/issues/2602#issuecomment-498718651
20-worker cluster with 2-CPU, 10GiB workers
main: 624.51sMALLOC_TRIM_THRESHOLD_=0: 93.42s (6x speedup)@mrocklin originally said about this example:
This is still true. However in this example,
datawas only 200GiB, which is a reasonable size for a cluster (mine had exactly 200GiB total memory). So this still won’t work on your laptop. But on a cluster, when we place the initial chunks ofdatawell so they don’t have to be shuffled around later, we can actually compute this quite efficiently.@dougiesquire’s climactic mean example from https://github.com/dask/distributed/issues/2602#issuecomment-535009454
20-worker cluster with 2-CPU, 20GiB workers
main+MALLOC_TRIM_THRESHOLD_=0: gave up after 30min and 1.25TiB spilled to disk (!!)MALLOC_TRIM_THRESHOLD_=0: 230sFWIW, even with the colocation PR, this struggled when workers only had 8GiB of memory. Bumping to 20GiB smoothed things out (well, not for
main). It would still be really cool if dask/distributed could tell you what amount of memory per worker was necessary to compute a given graph.So #4892 helps with this a lot. On my laptop (8-core intel MPB, 32GB memory), @rabernat’s original example at the top of of this issue takes:
main: 43 minutes, spills ~130GB data to disk, makes my system largely unresponsivemain (performance report): #4892 (performance report):
I want to give a big shout-out to @JSKenyon, who so clearly identified the problem in #4864, and @fjetter who started us towards a solution. Dask had been scheduling the initial data-creation tasks in a very bad way, leading to huge amounts of unnecessary data transfer, and therefore data duplication, and therefore ballooning memory usage.
I made two changes before running these trials:
Added a
.copy()at the end of the “pretend memory-reducing function”:This is essential, because the small slice of
fwe were returning was just a view off’s memory. And that meant all off’s memory had to stick around—so the memory-reducing function was not reducing memory at all! The NumPy docs even mention this:This is unintuitive behavior, but I wonder how often it happens unknowingly with Dask, and if it plays a role in real-world cases. I wonder if we could add logic to Dask to warn you of this situation, where the memory backing an array result is, say, 2x larger than memory needed for the number of elements in that array, and suggest you make a copy.
Ran under jemalloc to avoid the unreleased memory issue (@crusaderky has explained this clearly in the Dask docs):
It probably would have still worked without this, but would have spilled more and been messier.
It’s also interesting that memory backpressure wouldn’t have helped with this exact example snippet. Because of the view-vs-copy issue, that code was essentially trying to compute all 93 GiB of the original data into memory. No matter your order through the graph, that end result’s just not possible.
Not to say that we won’t ever need memory backpressure (xref #4891). But I wonder how many other cases that feel like Dask is producing more data than it can consume actually involve other sly bugs like the ones here. (Both the view-vs-copy and the poor ordering of root tasks were sly bugs, on behalf of a user and of dask.) And if there are tools/visualizations to help identify these issues that would serve us better than adding more complexity (memory backpressure) to try to work around them.
I’d love to hear if folks who have also run into these memory problems could retry their workloads with this update and report back how things change?