
Stuck on an issue?
Lightrun Answers was designed to reduce the constant googling that comes with debugging 3rd party libraries. It collects links to all the places you might be looking at while hunting down a tough bug.
And, if you’re still stuck at the end, we’re happy to hop on a call to see how we can help out.
Smooth Gaussians in corner plot
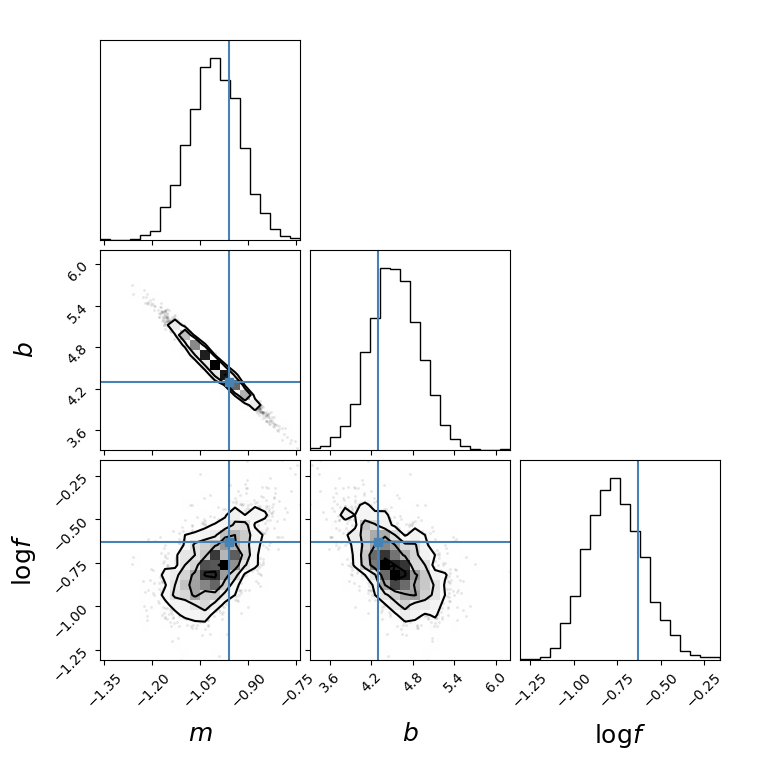
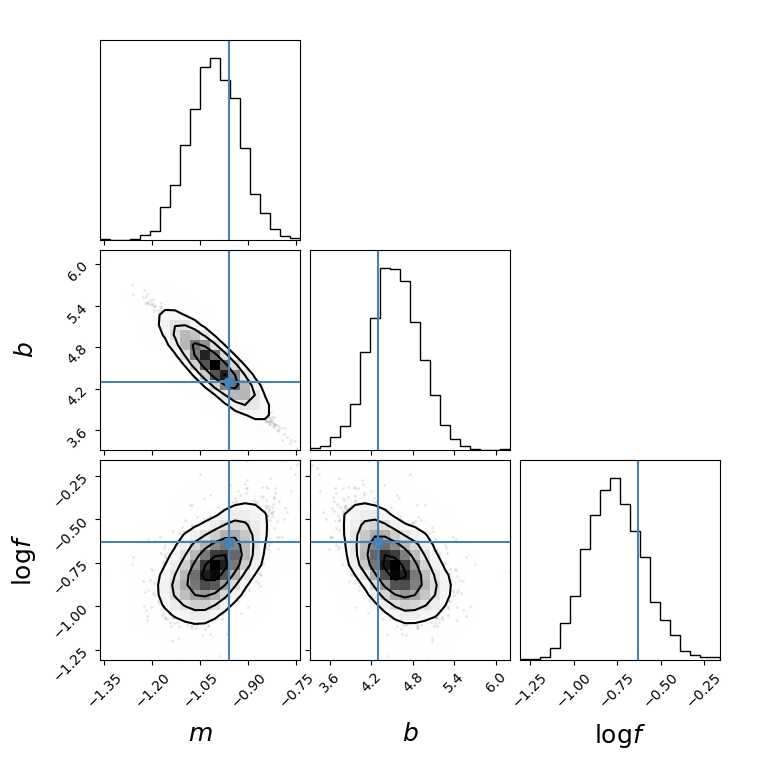
See original GitHub issueHow to get smooth Gaussians in corner plot? The option smooth=True did not help. Have I used the option incorrectly? The following is my code (which is the example from here). In the plot, only the contour lines are smoothened but not the Gaussian or the shaded region within the contours (which appear like squares). I have also, attached the plots with and without the smooth=True option.
Thanks in advance.
import matplotlib.pyplot as plt
import tqdm

np.random.seed(123)

m_true = -0.9594
b_true = 4.294
f_true = 0.534

N = 50
x = np.sort(10 * np.random.rand(N))
yerr = 0.1 + 0.5 * np.random.rand(N)
y = m_true * x + b_true
y += np.abs(f_true * y) * np.random.randn(N)
y += yerr * np.random.randn(N)

x0 = np.linspace(0, 10, 500)

def log_likelihood(theta):
    m, b, log_f = theta
    model = m * x + b
    sigma2 = yerr ** 2 + model ** 2 * np.exp(2 * log_f)
    return -0.5 * np.sum((y - model) ** 2 / sigma2 + np.log(sigma2))

def log_prior(theta):
    m, b, log_f = theta
    if -5.0 < m < 0.5 and 0.0 < b < 10.0 and -10.0 < log_f < 1.0:
        return 0.0
    return -np.inf

m1=np.array([-1.2,-1.05,-0.9])
b1=np.array([4.2,4.8,5.4])
logf1=np.array([-1,-0.75,-0.5])

para_spc=np.array([m1,b1,logf1])
def log_probability(theta):
    lp = log_prior(theta)
    if not np.isfinite(lp):
        return -np.inf
    return lp + log_likelihood(theta)

import emcee

pos = np.array([-1, 4.52, -0.79]) + 1e-4 * np.random.randn(32, 3)
nwalkers, ndim = pos.shape

sampler = emcee.EnsembleSampler(nwalkers, ndim, log_probability)
sampler.run_mcmc(pos, 1000, progress=True);

fig, axes = plt.subplots(3, figsize=(10, 7), sharex=True)
samples = sampler.get_chain()
labels = ["$m$", "$b$", "$\log f$"]

for i in range(ndim):
    ax = axes[i]
    ax.plot(samples[:, :, i], "k", alpha=0.3)
    ax.set_xlim(0, len(samples))
    ax.set_ylabel(labels[i])
    ax.yaxis.set_label_coords(-0.1, 0.5)

axes[-1].set_xlabel("step number");

settings=dict(fontsize=18)
import corner
flat_samples = sampler.get_chain(discard=100, thin=15, flat=True)
fig = corner.corner(
    flat_samples,labels=labels, truths=[m_true, b_true, np.log(f_true)],labelpad=0.01,label_kwargs=settings, smooth=True)

axes = np.array(fig.axes).reshape((ndim, ndim))

plt.show()
Issue Analytics
- State:

- Created 2 years ago
- Comments:6 (3 by maintainers)
 Top Results From Across the Web
Detailed API documentation - corner.py - Read the Docs
smooth (float) – The standard deviation for Gaussian kernel passed to scipy.ndimage.gaussian_filter to smooth the 2-D and 1-D histograms respectively.
Read more >Using corner to plot smooth contours - python - Stack Overflow
You can use the smooth keyword (see documentation for more details) in corner.corner() to smoothen the posterior contours. Implementing it is as simple...
Read more >Effect of curve smoothing using Gaussian function with ...
The aim of the smoothing is to reduce the effect of local variation and noise so as to remove weak and false corners....
Read more >smoothr: Smooth and Tidy Spatial Features in R
Currently, three smoothing methods have been implemented: Chaikin's corner cutting algorithm, Gaussian kernel smoothing, and spline interpolation.
Read more >bvgoncharov/normal_corner: Corner plot module for Gaussian ...
This code produces a corner plot for analytical multi-dimensional Gaussian distribution, using covariance matrix and mean matrix. It also allows us to plot...
Read more > Top Related Medium Post
No results found
 Top Related StackOverflow Question
No results found
 Troubleshoot Live Code
Lightrun enables developers to add logs, metrics and snapshots to live code - no restarts or redeploys required.
Start Free Top Related Reddit Thread
No results found
 Top Related Hackernoon Post
No results found
 Top Related Tweet
No results found
 Top Related Dev.to Post
No results found
 Top Related Hashnode Post
No results found
Oh - I see what you’re looking for now! No, there’s no KDE option. These parameters smooth out sampling noise but you’re always going to see a histogram with bin sizes set by the bins parameter. If you want something different, you’ll need to plot it manually using matplotlib directly. To do that, you can use the method described here to access the axis objects directly and then plot whatever you want: https://corner.readthedocs.io/en/latest/pages/custom.html
Unfortunately I can’t give you more concrete suggestions.
Thanks.