
Lightrun Answers was designed to reduce the constant googling that comes with debugging 3rd party libraries. It collects links to all the places you might be looking at while hunting down a tough bug.
And, if you’re still stuck at the end, we’re happy to hop on a call to see how we can help out.
Cannot debug Blazor Wasm application on .Net 6: Unable to attach to browser
See original GitHub issueIs there an existing issue for this?
- I have searched the existing issues
Describe the bug
When launching a Blazor wasm application in debug, the browser (either Chrome or Edge) tab will open and the application will crash with “got exception System.Net.WebSockets.WebSocketException (0x80004005): The server returned status code ‘500’ when status code ‘101’ was expected.”
By setting "launchBrowser": false, I can open a Chrome tab to the application but the debugging still doesn’t work.
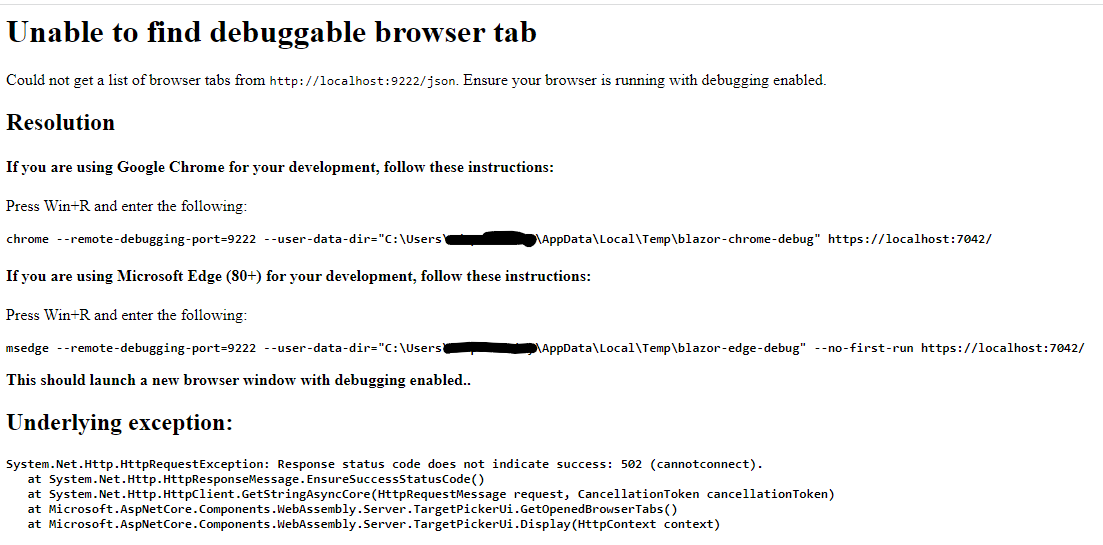
If I use Shift-Alt-D, I get a page that says Unable to find debuggable browser tab. Could not get a list of browser tabs from http://localhost:9222/json. Ensure your browser is running with debugging enabled..
I can however navigate to http://localhost:9222/json and see the document.
This is very similar to https://github.com/dotnet/aspnetcore/issues/26824 but the fix does not work for me.
I have uninstalled every other .Net sdk version and have tried with my proxy disabled.
This happens with every Blazor Wasm app I can launch including the default project template.
This issue does not happen with Firefox but it shows a message that debugging is explicitly not supported
Expected Behavior
The application should open in the browser all allow breakpoints to be set in the code.
Steps To Reproduce
- Install .Net 6
- Create a new project with
dotnet new blazorwasm - Open the project in Visual Studio 2022
- Launch the application either with IIS or Kestrel targetting Chrome or Edge
Exceptions (if any)
got exception System.Net.WebSockets.WebSocketException (0x80004005): The server returned status code ‘500’ when status code ‘101’ was expected. at System.Net.WebSockets.WebSocketHandle.ConnectAsync(Uri uri, CancellationToken cancellationToken, ClientWebSocketOptions options) at System.Net.WebSockets.ClientWebSocket.ConnectAsyncCore(Uri uri, CancellationToken cancellationToken) at Microsoft.WebAssembly.Diagnostics.DevToolsProxy.Run(Uri browserUri, WebSocket ideSocket) at Microsoft.WebAssembly.Diagnostics.DebugExtensions.<>c__DisplayClass2_0.<<UseDebugProxy>g__ConnectProxy|5>d.MoveNext()
.NET Version
6.0.202
Anything else?
I’m using Visual Studio Professional 2022 v17.1.6 Using Chrome Version 101.0.4951.41 (Official Build) (64-bit) Using Edge Version 100.0.1185.50 (Official build) (64-bit)
dotnet --info output:
F:\temp>dotnet --info .NET SDK (reflecting any global.json): Version: 6.0.202 Commit: f8a55617d2
Runtime Environment: OS Name: Windows OS Version: 10.0.19042 OS Platform: Windows RID: win10-x64 Base Path: C:\Program Files\dotnet\sdk\6.0.202\
Host (useful for support): Version: 6.0.4 Commit: be98e88c76
.NET SDKs installed: 6.0.202 [C:\Program Files\dotnet\sdk]
.NET runtimes installed: Microsoft.AspNetCore.App 6.0.4 [C:\Program Files\dotnet\shared\Microsoft.AspNetCore.App] Microsoft.NETCore.App 6.0.0-rc.2.21480.5 [C:\Program Files\dotnet\shared\Microsoft.NETCore.App] Microsoft.NETCore.App 6.0.4 [C:\Program Files\dotnet\shared\Microsoft.NETCore.App] Microsoft.WindowsDesktop.App 6.0.4 [C:\Program Files\dotnet\shared\Microsoft.WindowsDesktop.App]

What Chrome shows before crashing:

The debug tab:
Log in visualstudio-js-debugger.txt:
{"tag":"runtime.launch","timestamp":1651256875766,"message":"Launch returned error","metadata":{"error":{"message":"Unable to attach to browser","stack":"Error: Unable to attach to browser\n at h.target [as prepareLaunch] (c:\\program files\\microsoft visual studio\\2022\\professional\\common7\\ide\\commonextensions\\microsoft\\jsdiagnostics\\debugger\\debugAdapter\\out\\src\\targets\\browser\\browserLauncher.js:124:19)\n at h.result (c:\\program files\\microsoft visual studio\\2022\\professional\\common7\\ide\\commonextensions\\microsoft\\jsdiagnostics\\debugger\\debugAdapter\\out\\src\\targets\\browser\\browserLauncher.js:168:15)\n at t.Binder.captureLaunch (c:\\program files\\microsoft visual studio\\2022\\professional\\common7\\ide\\commonextensions\\microsoft\\jsdiagnostics\\debugger\\debugAdapter\\out\\src\\binder.js:248:13)\n at t.Binder._launch (c:\\program files\\microsoft visual studio\\2022\\professional\\common7\\ide\\commonextensions\\microsoft\\jsdiagnostics\\debugger\\debugAdapter\\out\\src\\binder.js:224:9)\n at async Promise.all (index 5)\n at t.Binder.result [as _boot] (c:\\program files\\microsoft visual studio\\2022\\professional\\common7\\ide\\commonextensions\\microsoft\\jsdiagnostics\\debugger\\debugAdapter\\out\\src\\binder.js:172:9)\n at t.default._onMessage (c:\\program files\\microsoft visual studio\\2022\\professional\\common7\\ide\\commonextensions\\microsoft\\jsdiagnostics\\debugger\\debugAdapter\\out\\src\\dap\\connection.js:145:27)"},"wasCancelled":false,"name":"h"},"level":2}
Issue Analytics
- State:

- Created a year ago
- Comments:25 (16 by maintainers)
 Top Related StackOverflow Question
 Troubleshoot Live Code
 Top Related Reddit Thread
 Top Related Hackernoon Post
 Top Related Tweet
 Top Related Dev.to Post
 Top Related Hashnode Post
Thank you for the very fast response.
Here is the full content of http://localhost:9222/json:
Here is the full debugger file
visualstudio-js-debugger.txt
Works for me on 7.0 RTM There were some issue occasionally but cleaning the solution helped. Have you solved your issue guys?