Jest leaks memory from required modules with closures over imports
See original GitHub issue🐛 Bug Report
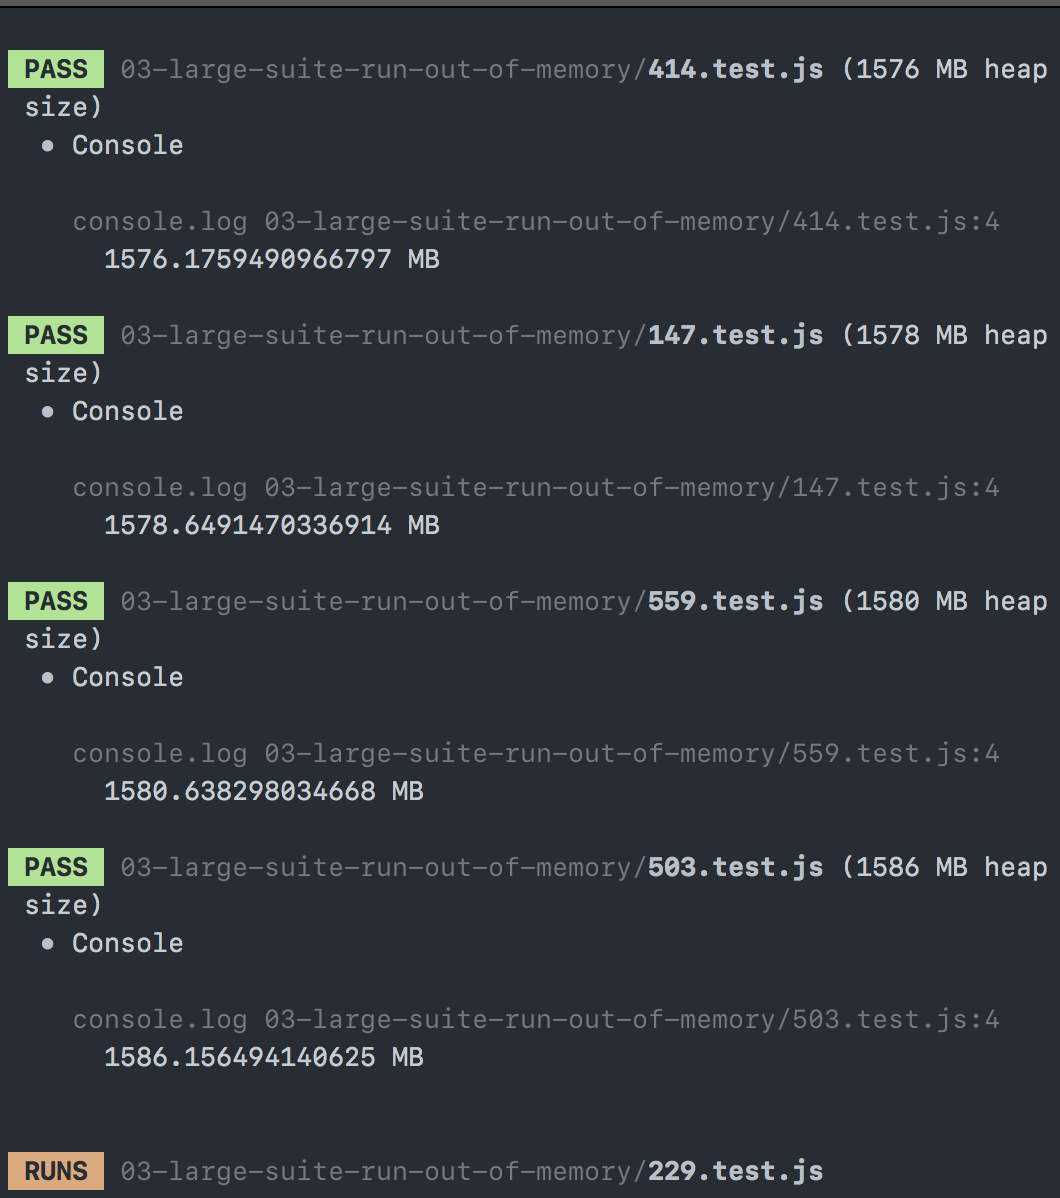
We are running into a issue in Jest 23.4.2 where Jest leaks and runs out of memory when running a moderately hefty test suite (~500 to 1000 test files). I believe I have isolated this to the require system in Jest and it is not the fault of other packages. Even with the most minimal recreation it leaks around 2-6MB per test.
This is very similar to https://github.com/facebook/jest/issues/6399 but I opted to make a new issue as I think it’s not specific to packages or the node environment. I think it’s the also the source or related to the following issues as well but didn’t want to sidetrack potentially different issues and conversations.
https://github.com/facebook/jest/issues/6738 https://github.com/facebook/jest/issues/6751 https://github.com/facebook/jest/issues/5837 https://github.com/facebook/jest/issues/2179
This is my first time digging into memory issues, so please forgive me if I am focusing on the wrong things!
Link to repl or repo
I have created a very minimal reproduction here: https://github.com/pk-nb/jest-memory-leak-repro. You should be able to run and see heap grow and also debug it with the chrome node devtools. With the reproduction, we can see this happens in both JSDOM and node environments in Jest.


To Reproduce
Simply run a test suite with tests that require in a file that creates a closure over an imported variable:
// sourceThatLeaks.js

const https = require('https');

let originalHttpsRequest = https.request;

https.request = (options, cb) => {
  return originalHttpsRequest.call(https, options, cb);
};

// If this is uncommented, the leak goes away!
// originalHttpsRequest = null;
// 1.test.js, 2.test.js, ...

require("./sourceThatLeaks");

it("leaks memory", () => {});
While every worker leaks memory and will eventually run out, it is easiest to see with --runInBand.
Note that we are not doing anything with require to force a reimport—this is a vanilla require in each test.
When run with jasmine, we can see the issue go away as there is no custom require implementation for mocking code. We also see the issue disappear if we release the variable reference for GC by setting to null.
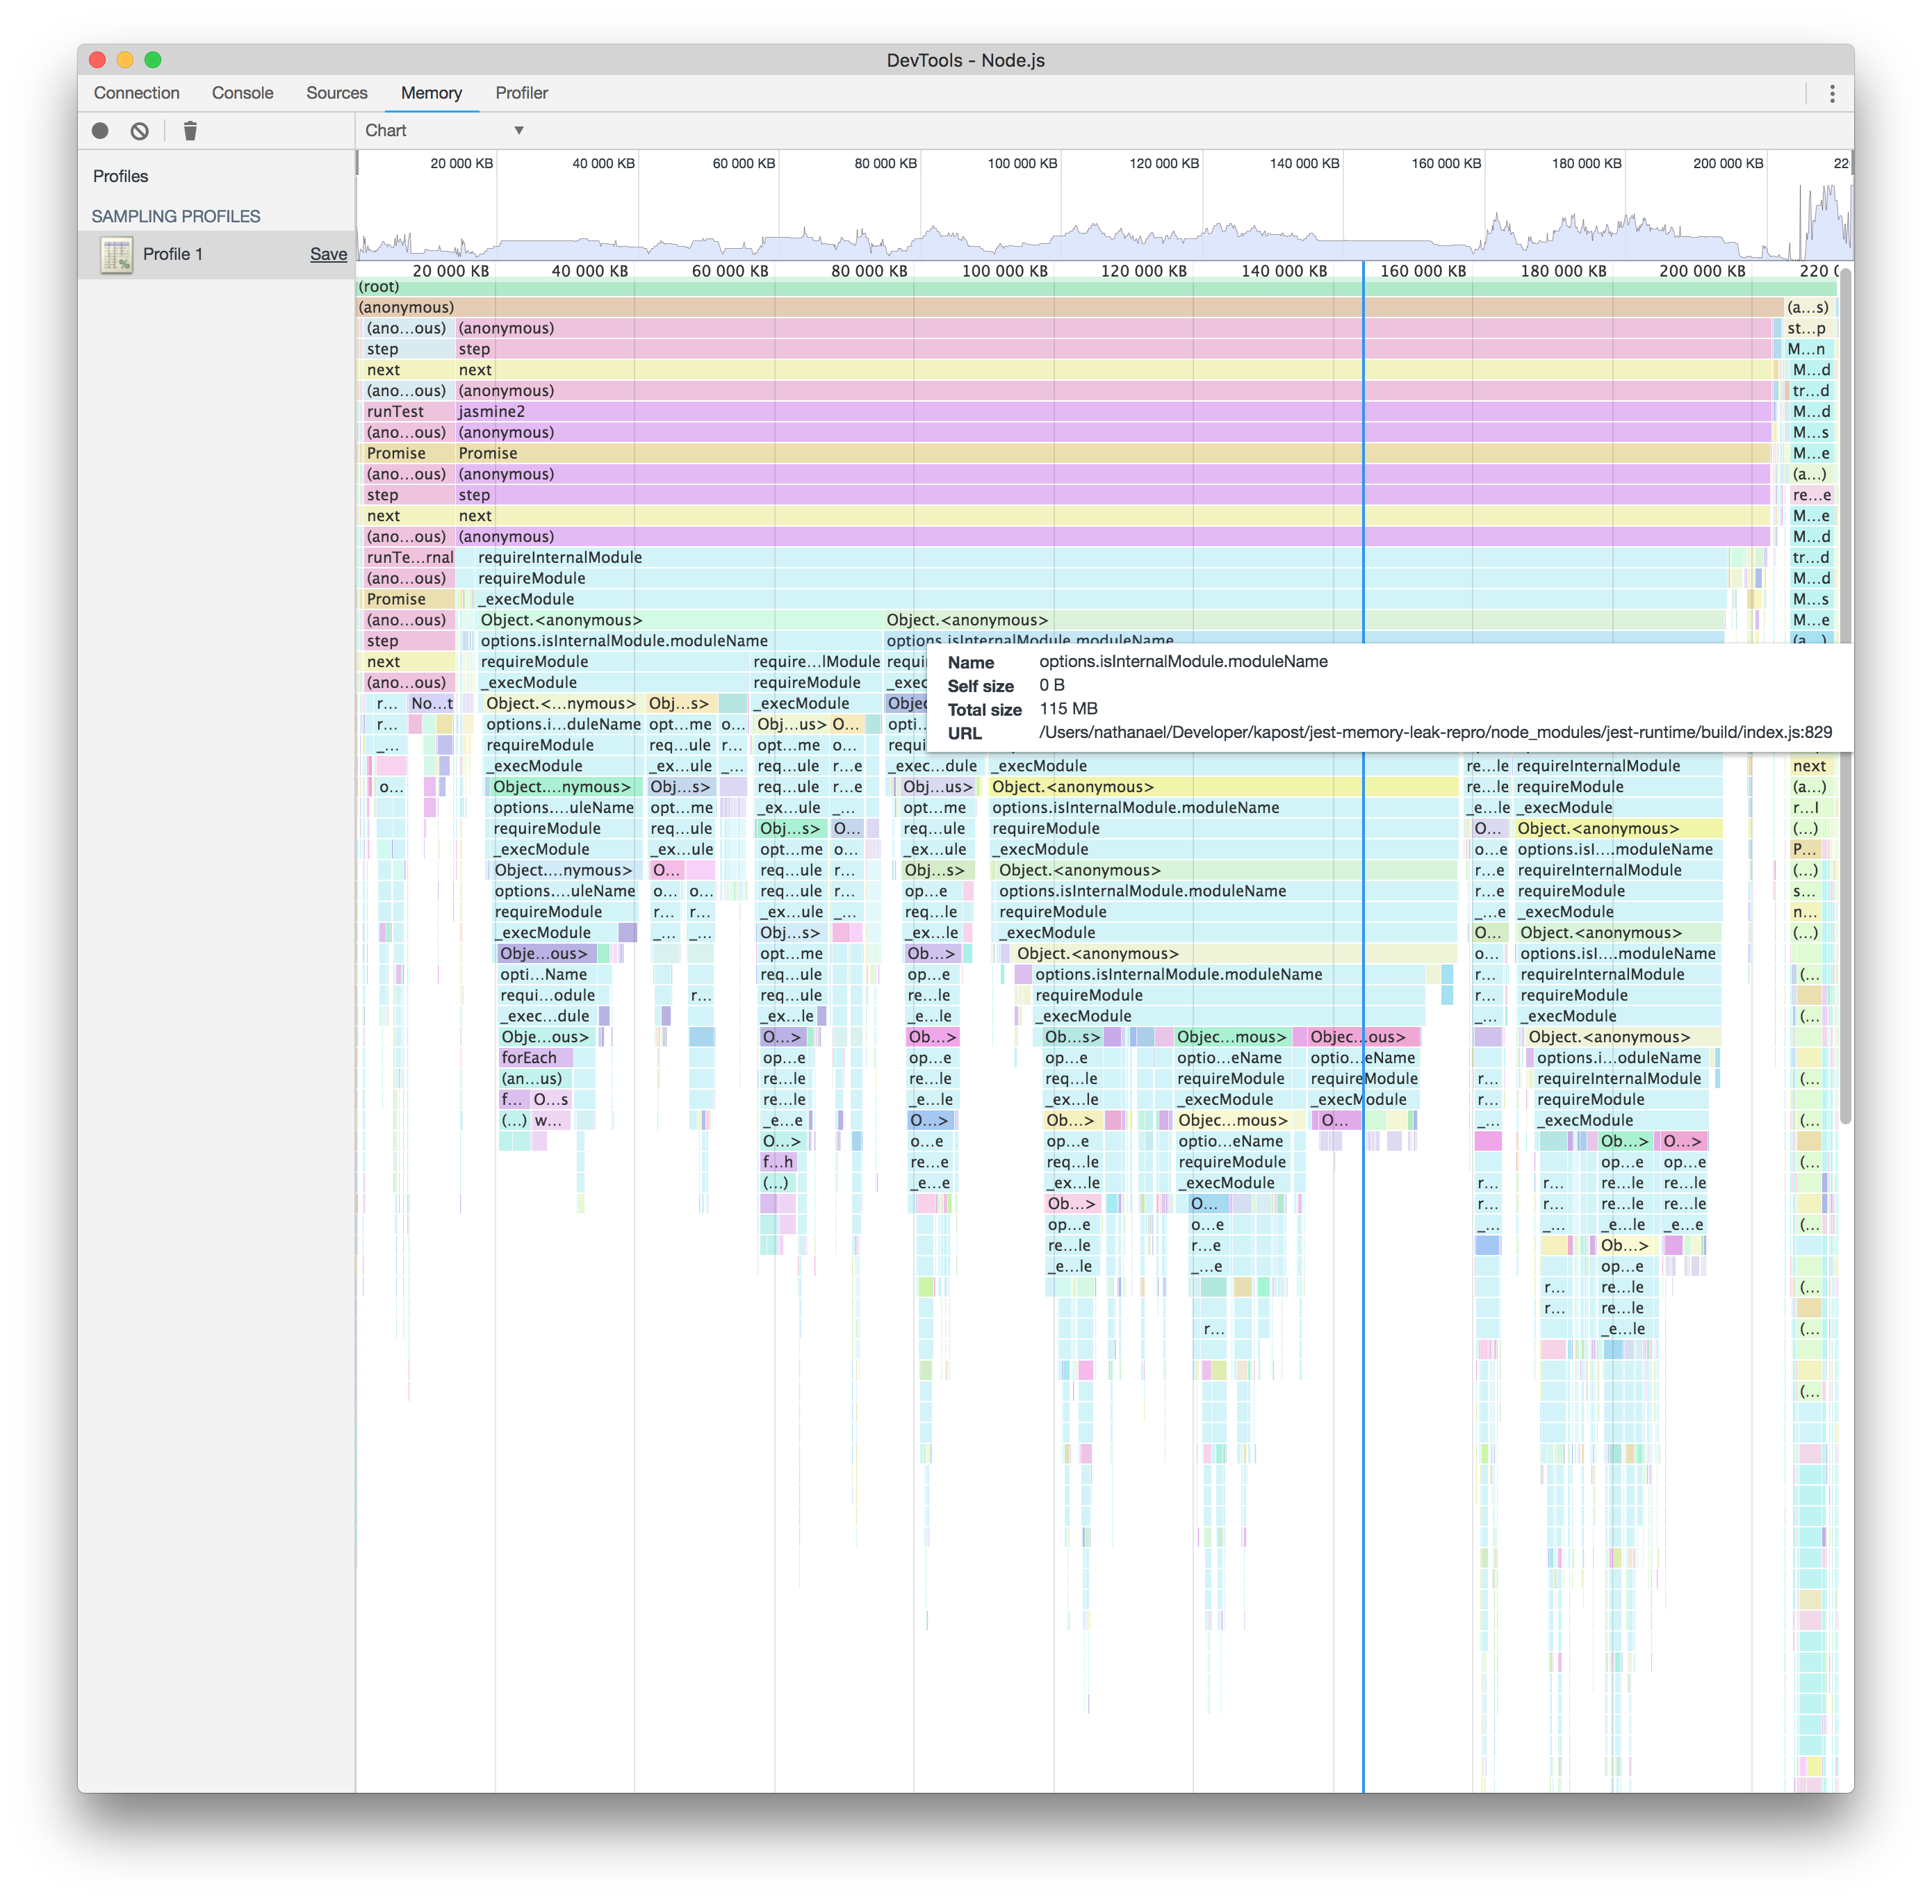
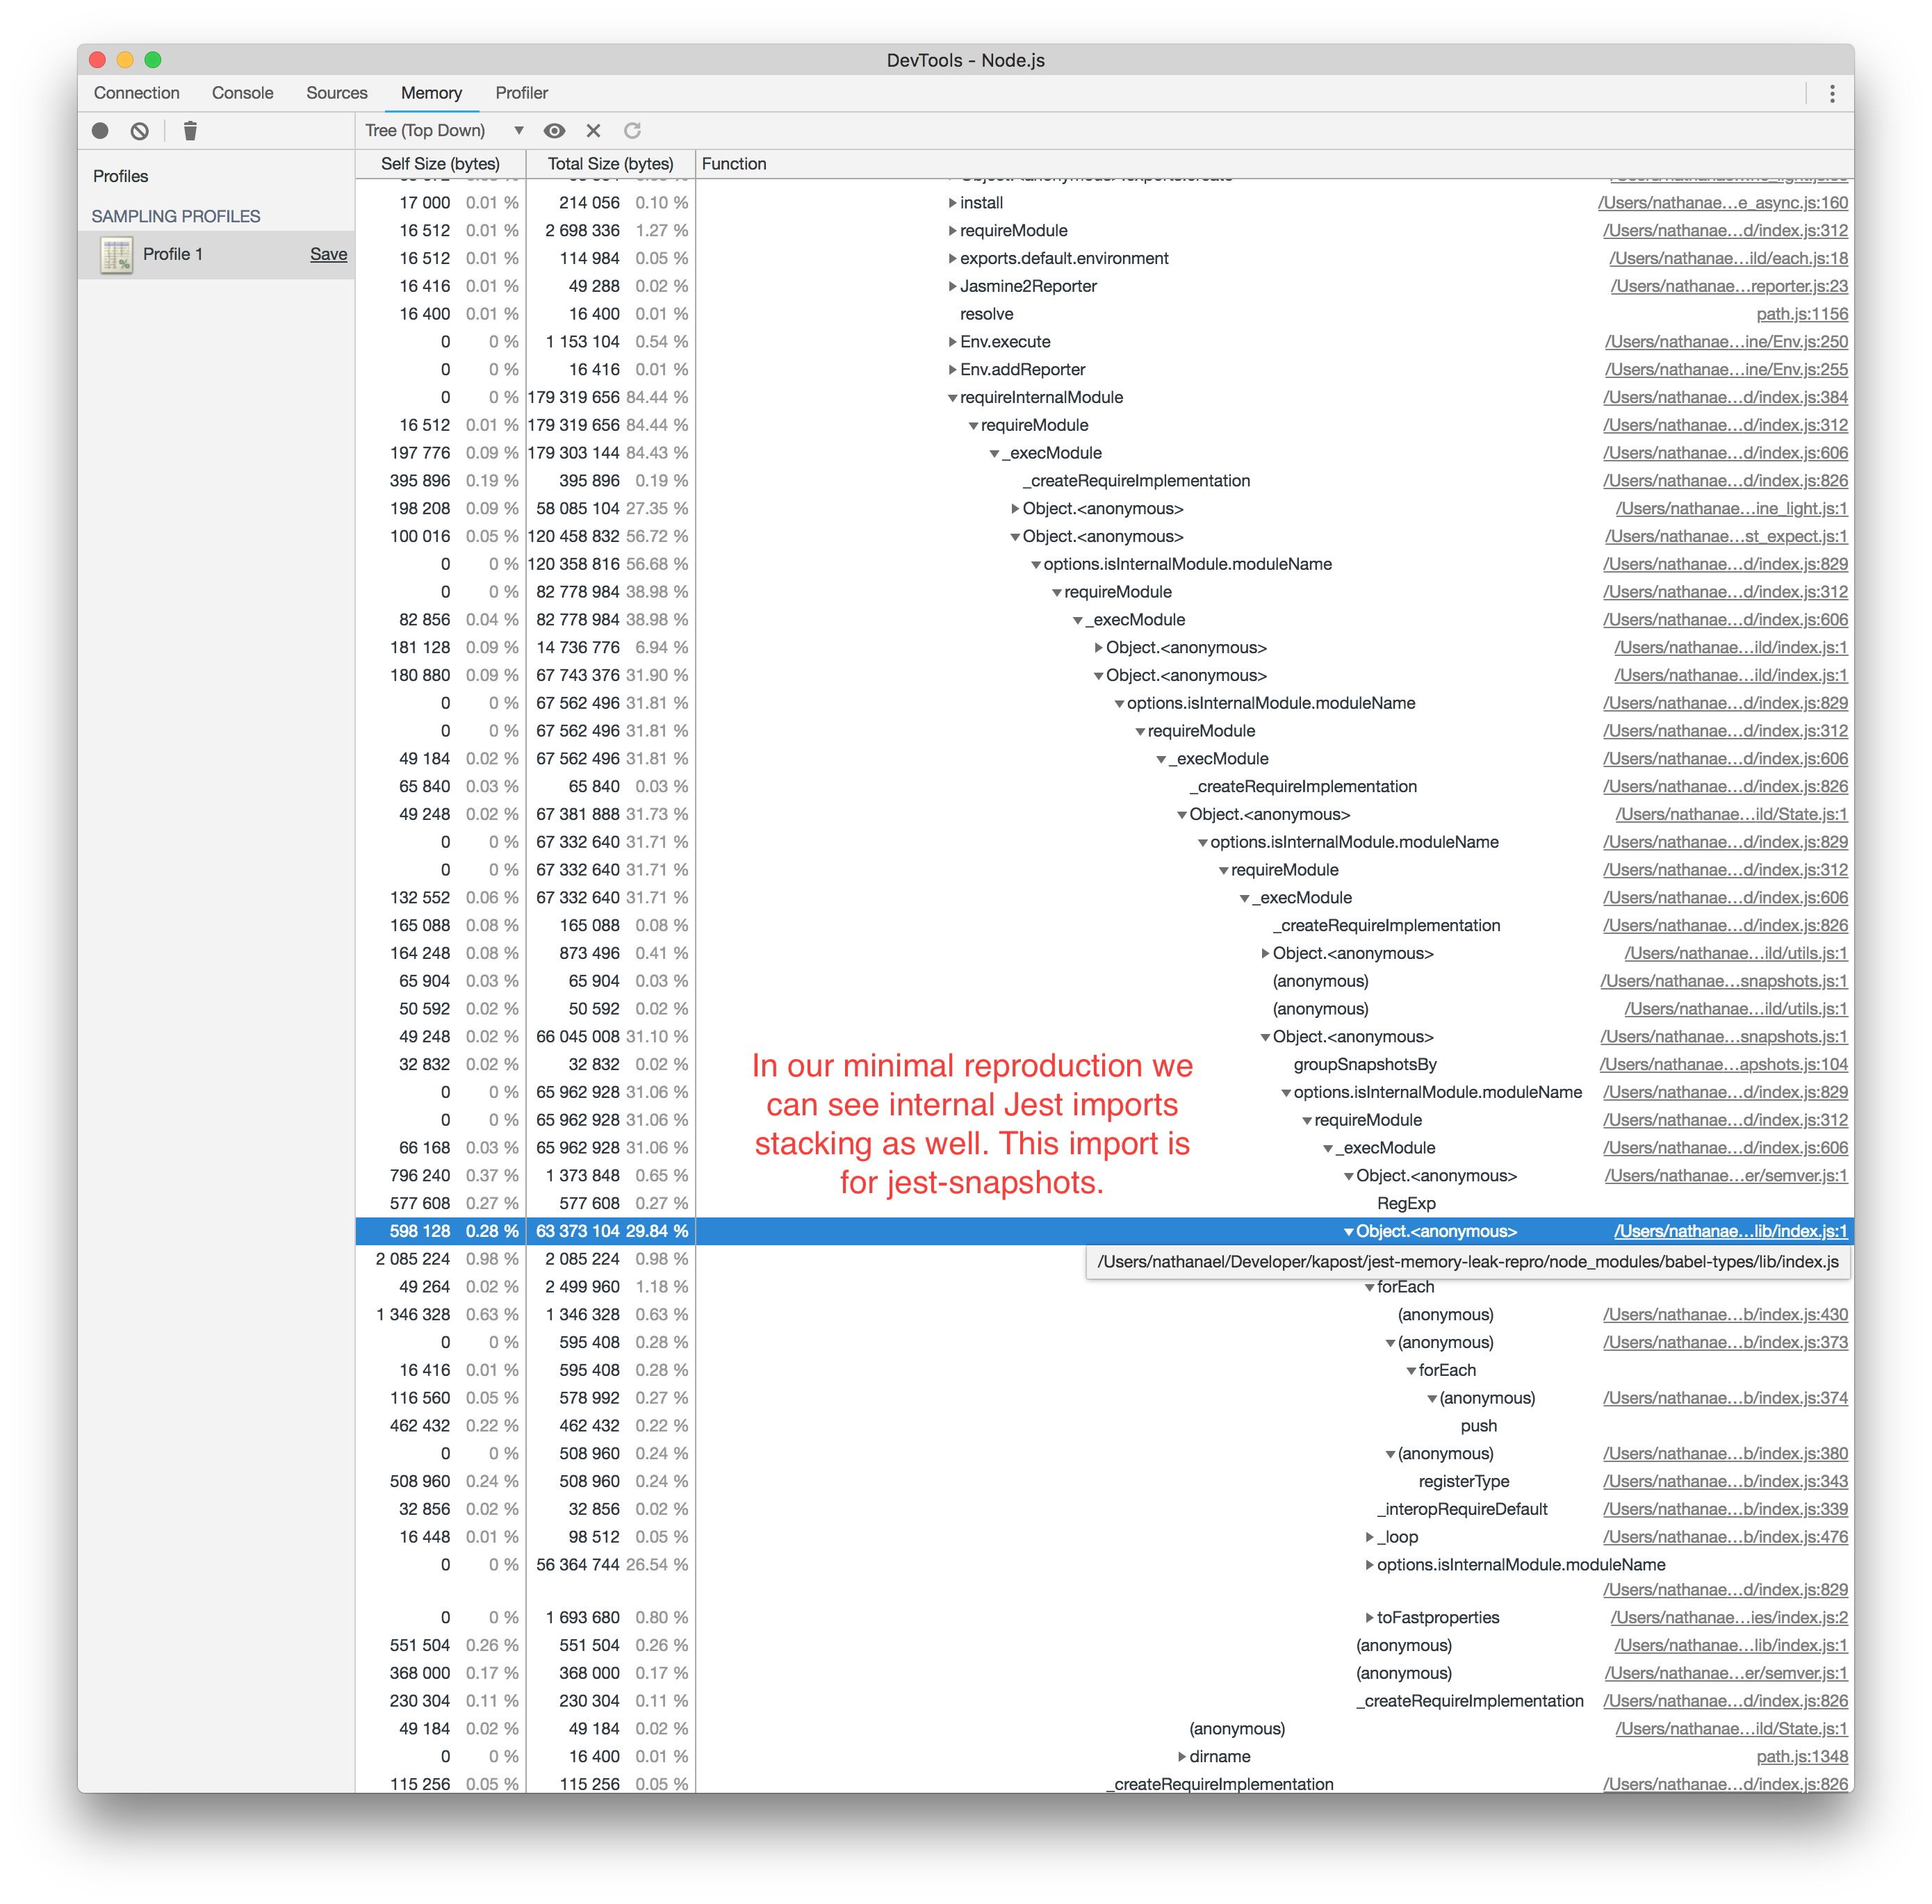
I believe the closure is capturing the entire test context (which also includes other imports like jest-snapshots) which quickly adds up.
Expected behavior
Hoping to fix so there is no leak. This unfortunately is preventing us from moving to Jest as we cannot run the suite on our memory bound CI (even with multiple workers to try to spread the leak).
I’m hoping the reproduction is useful—I spent some time trying to fix with some basic guesses at closures but ultimately am in over my head with the codebase.
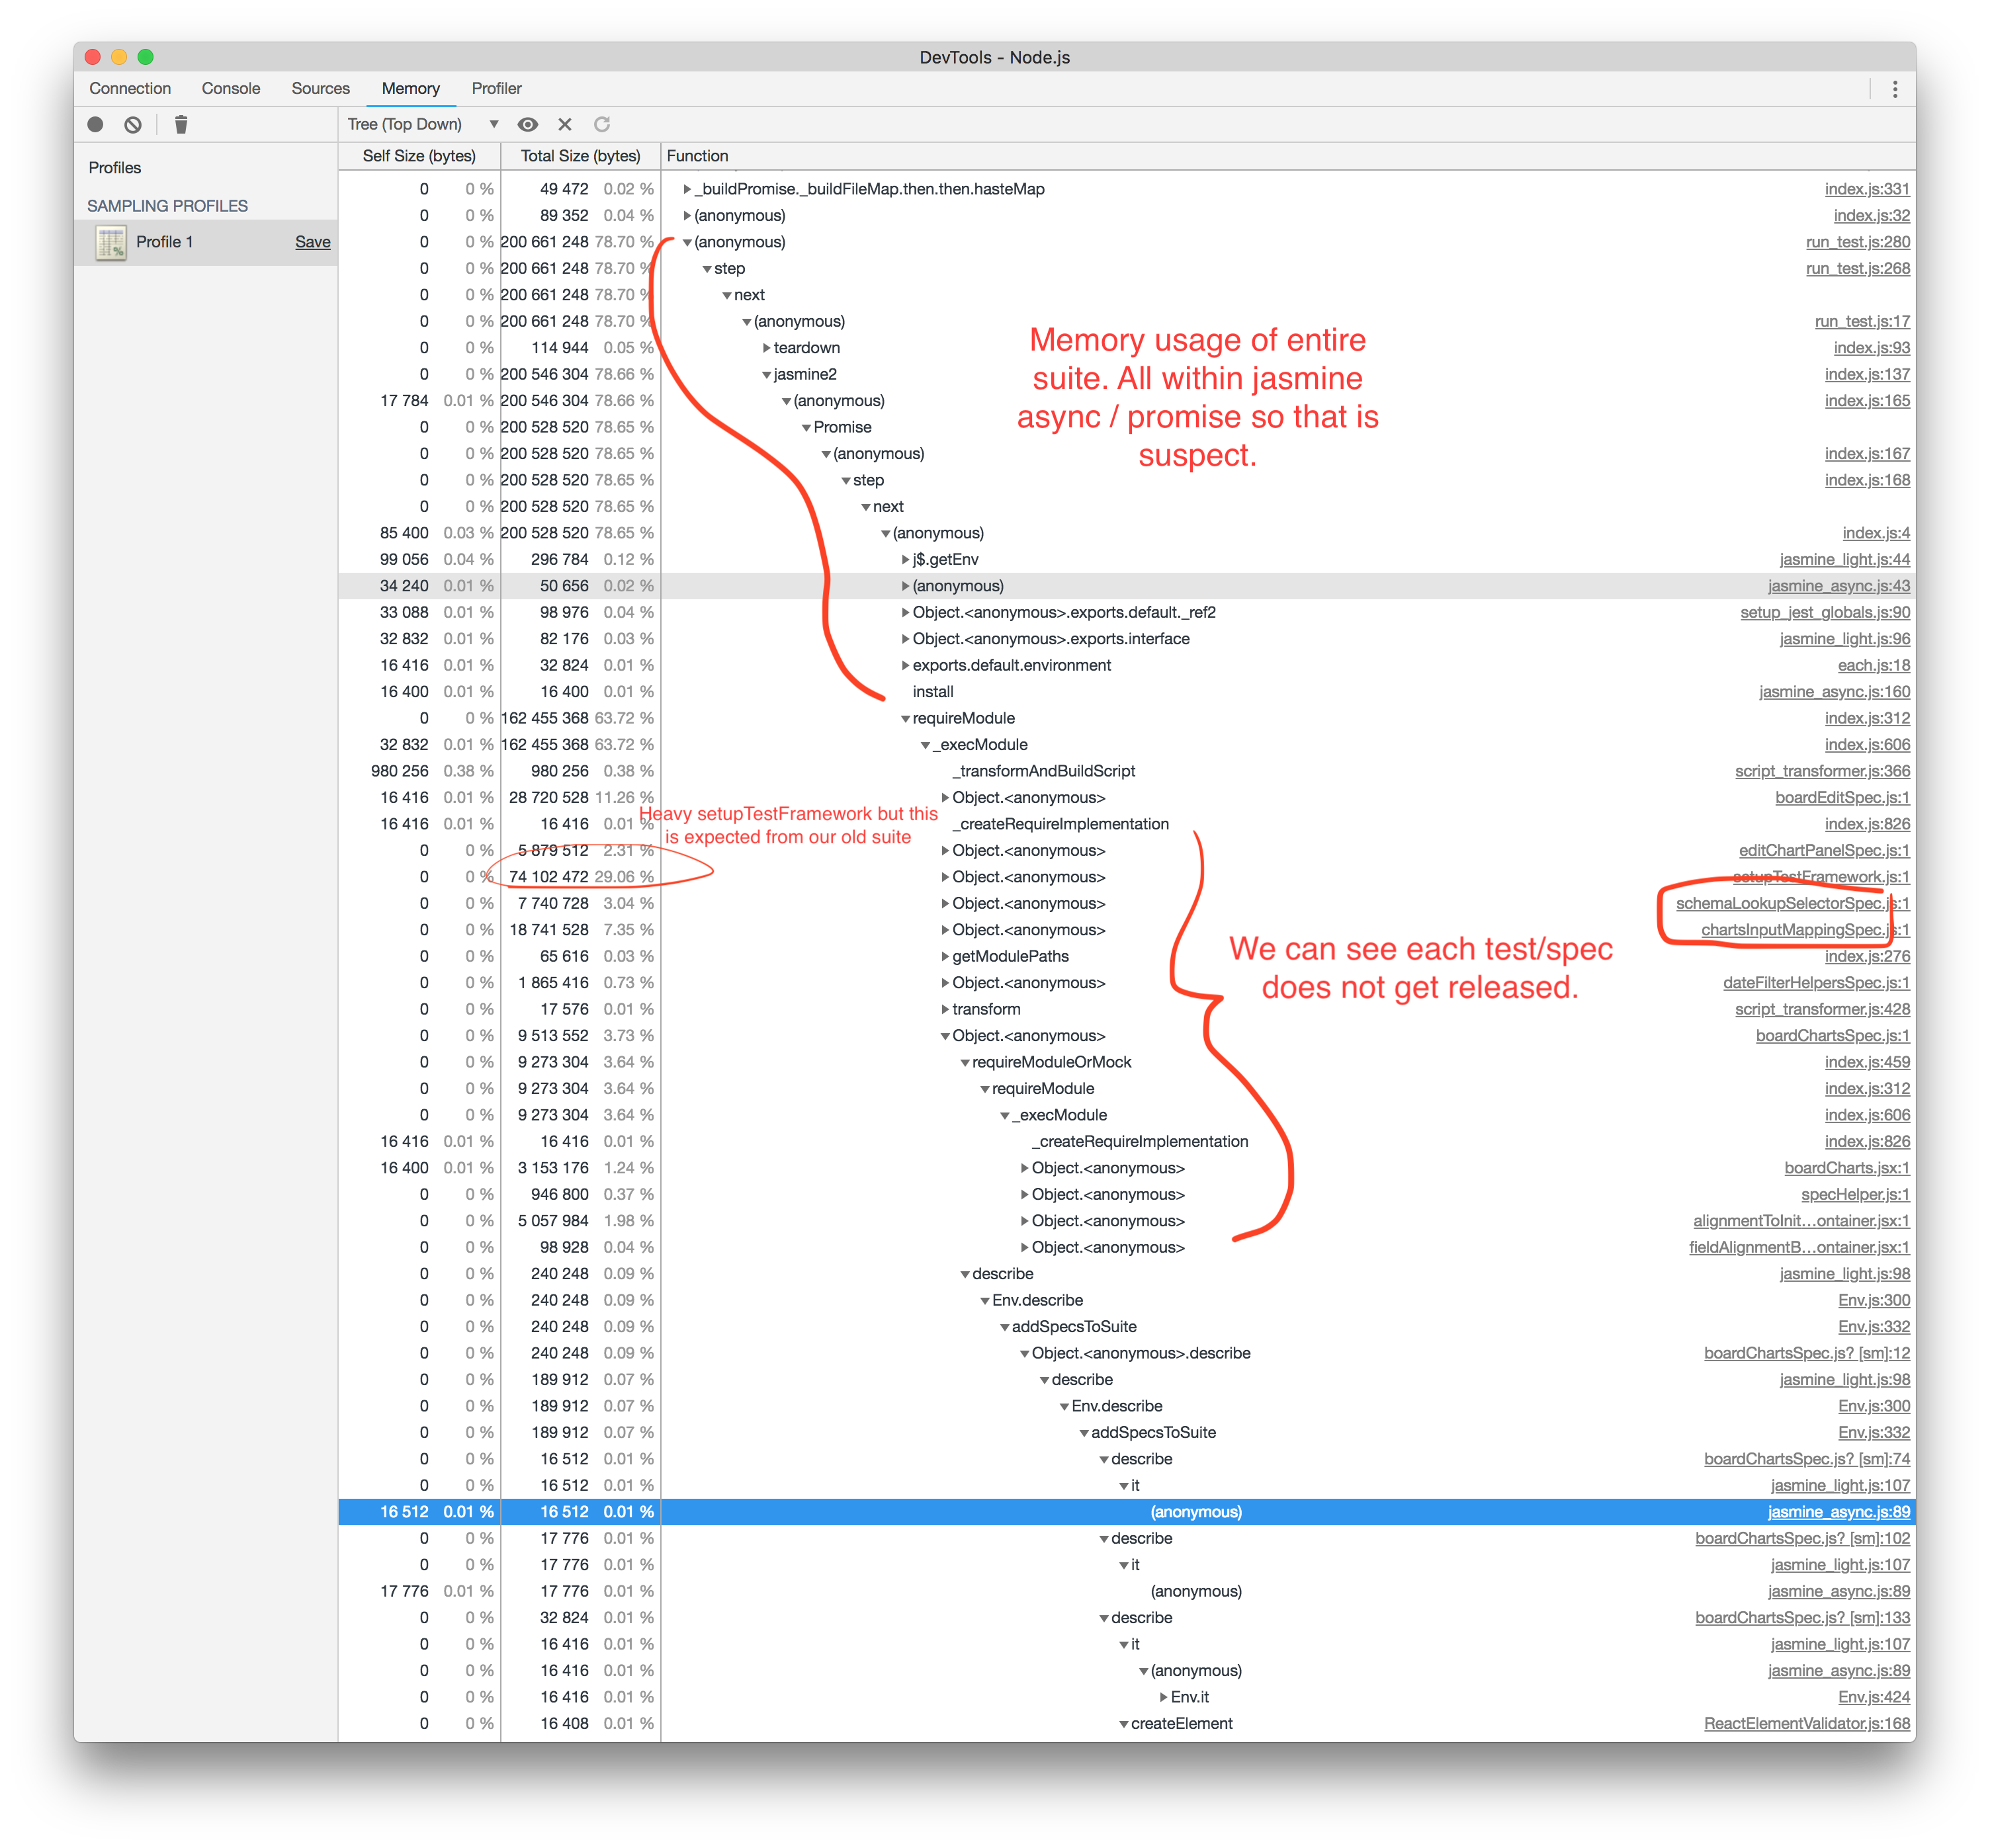
You can see the huge closure in the memory analysis so I’m inclined to think it’s some closure capture over the require implementation and/or the jasmine async function (promise).


Some leak suspects:
- Closures (section 4)
- Wondering if this or other similar code in here is a closure capture that V8 can’t break https://github.com/facebook/jest/blob/master/packages/jest-runtime/src/index.js#L589-L591
- Promises (async generator) leaking
- Wondering if the promise / asyncToGenerator babel is capturing scope with the
next, preventing it from releasing? https://github.com/facebook/jest/blob/master/packages/jest-runner/src/run_test.js#L218-L220
- Wondering if the promise / asyncToGenerator babel is capturing scope with the
- Global data (section 1)
- Capturing too much with the global console? https://github.com/facebook/jest/blob/master/packages/jest-runner/src/run_test.js#L108
- All of the above?
These are educated guesses, but there are quite a few closures within the runtime / runner / jasmine packages though so it’s very difficult (as least for me being new to the codebase) to pinpoint where the capture lies. I’m hoping that there’s a specific point and that each closure in the runtime would not present the same issue.
Our suite
I have ensured the issue stems from Jest and not our suite—I ran the old suite (mocha) and saw a healthy sawtooth usage of heap.
Run npx envinfo --preset jest
▲ npx envinfo --preset jest
npx: installed 1 in 2.206s

  System:
    OS: macOS High Sierra 10.13.6
    CPU: x64 Intel(R) Core(TM) i9-8950HK CPU @ 2.90GHz
  Binaries:
    Node: 8.11.3 - ~/.nodenv/versions/8.11.3/bin/node
    Yarn: 1.9.4 - ~/.nodenv/versions/8.11.3/bin/yarn
    npm: 5.6.0 - ~/.nodenv/versions/8.11.3/bin/npm
  npmPackages:
    jest: ^23.4.2 => 23.4.2
Please let me know if I can help in any way! I’d really love to get our company on Jest and am happy to help where I can. Thanks @lev-kazakov for the original isolation repro.
Issue Analytics
- State:
- Created 5 years ago
- Reactions:112
- Comments:33 (7 by maintainers)

 Top Related StackOverflow Question
@SimenB If it’s innate to the implementation of Jest that a lot of larger code bases might run into these problems then I think it would be very helpful to actually have more details in the docs on why this would happen and common ways of debugging it (beyond the existing CLI args).
As it currently stands there’s not a lot of detail on how the module loading works in the docs. And that’s understandable in the sense that users “shouldn’t have to know how it works”. However if it is the case that having somewhat of an understanding of at least the general working of Jest can help users write more performant tests and understand why memory leaks can easy become an issue, then it’s perhaps worth reconsidering.
any updates? We still face memory leaks from time to time, especially in a memory-constrained CI environment (leaks add up and crash at some point)