
Stuck on an issue?
Lightrun Answers was designed to reduce the constant googling that comes with debugging 3rd party libraries. It collects links to all the places you might be looking at while hunting down a tough bug.
And, if you’re still stuck at the end, we’re happy to hop on a call to see how we can help out.
Components plots doubling in Jupyterlab
See original GitHub issueWhen plotting model components charts in Jupyterlab, they appear twice:
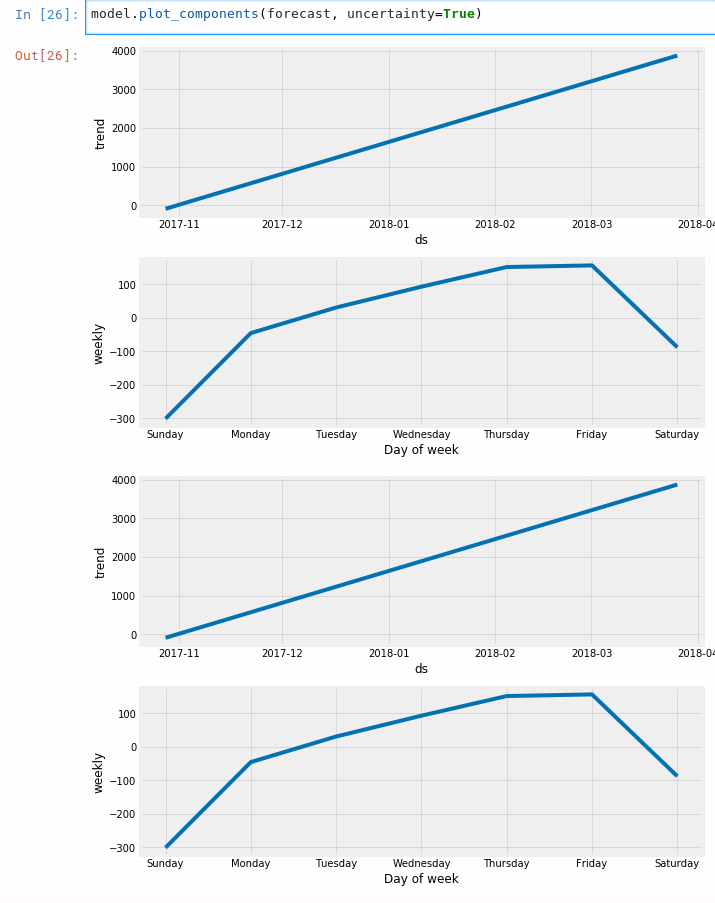
In the notebook, I have set %matplotlib inline, so the charts are plotted directly below notebook cells.
Issue Analytics
- State:

- Created 6 years ago
- Comments:7 (4 by maintainers)
 Top Results From Across the Web
Why is Jupyter Notebook creating duplicate plots when ...
You are displaying your figure once using the display function, and then the figure is being displayed again automatically by the inline backend....
Read more >Plotting and Programming in Python - Our Lessons
Type Terminal and then double-click the search result or hit Enter. After you have launched Terminal, type the command to launch the JupyterLab...
Read more >File and Output Formats — JupyterLab 3.6.0a5 documentation
JupyterLab supports image data in cell output and as files in the above formats. In the image file viewer, you can use keyboard...
Read more >How to Effortlessly Optimize Your Jupyter Notebook | by ...
High-Resolution Plots. One simple line of IPython magic will give you double resolution plot output for Retina screens. Just be aware that this ......
Read more >Terraforming Jupyter: Changing JupyterLab to suit your needs
Terraforming Jupyter: Changing JupyterLab to suit your needsStephanie Stattel (Bloomberg LP), Paul Ivanov (Bloomberg LP)As the ...
Read more > Top Related Medium Post
No results found
 Top Related StackOverflow Question
No results found
 Troubleshoot Live Code
Lightrun enables developers to add logs, metrics and snapshots to live code - no restarts or redeploys required.
Start Free Top Related Reddit Thread
No results found
 Top Related Hackernoon Post
No results found
 Top Related Tweet
No results found
 Top Related Dev.to Post
No results found
 Top Related Hashnode Post
No results found
You can place a ‘;’ behind your statement in order to get the plot only once. I think this is due to the fact that the plot is already rendered in the function.
Correct, it is because jupyter will automatically render any matplotlib plots, and will in addition to that print the output of the last line in the cell (in this case the figure, hence the duplication). Semicolon will suppress printing the last line in the cell so you’ll get it only once. Alternatively you can assign the output of plot to a variable and it won’t print the 2nd time: